

Key Insights
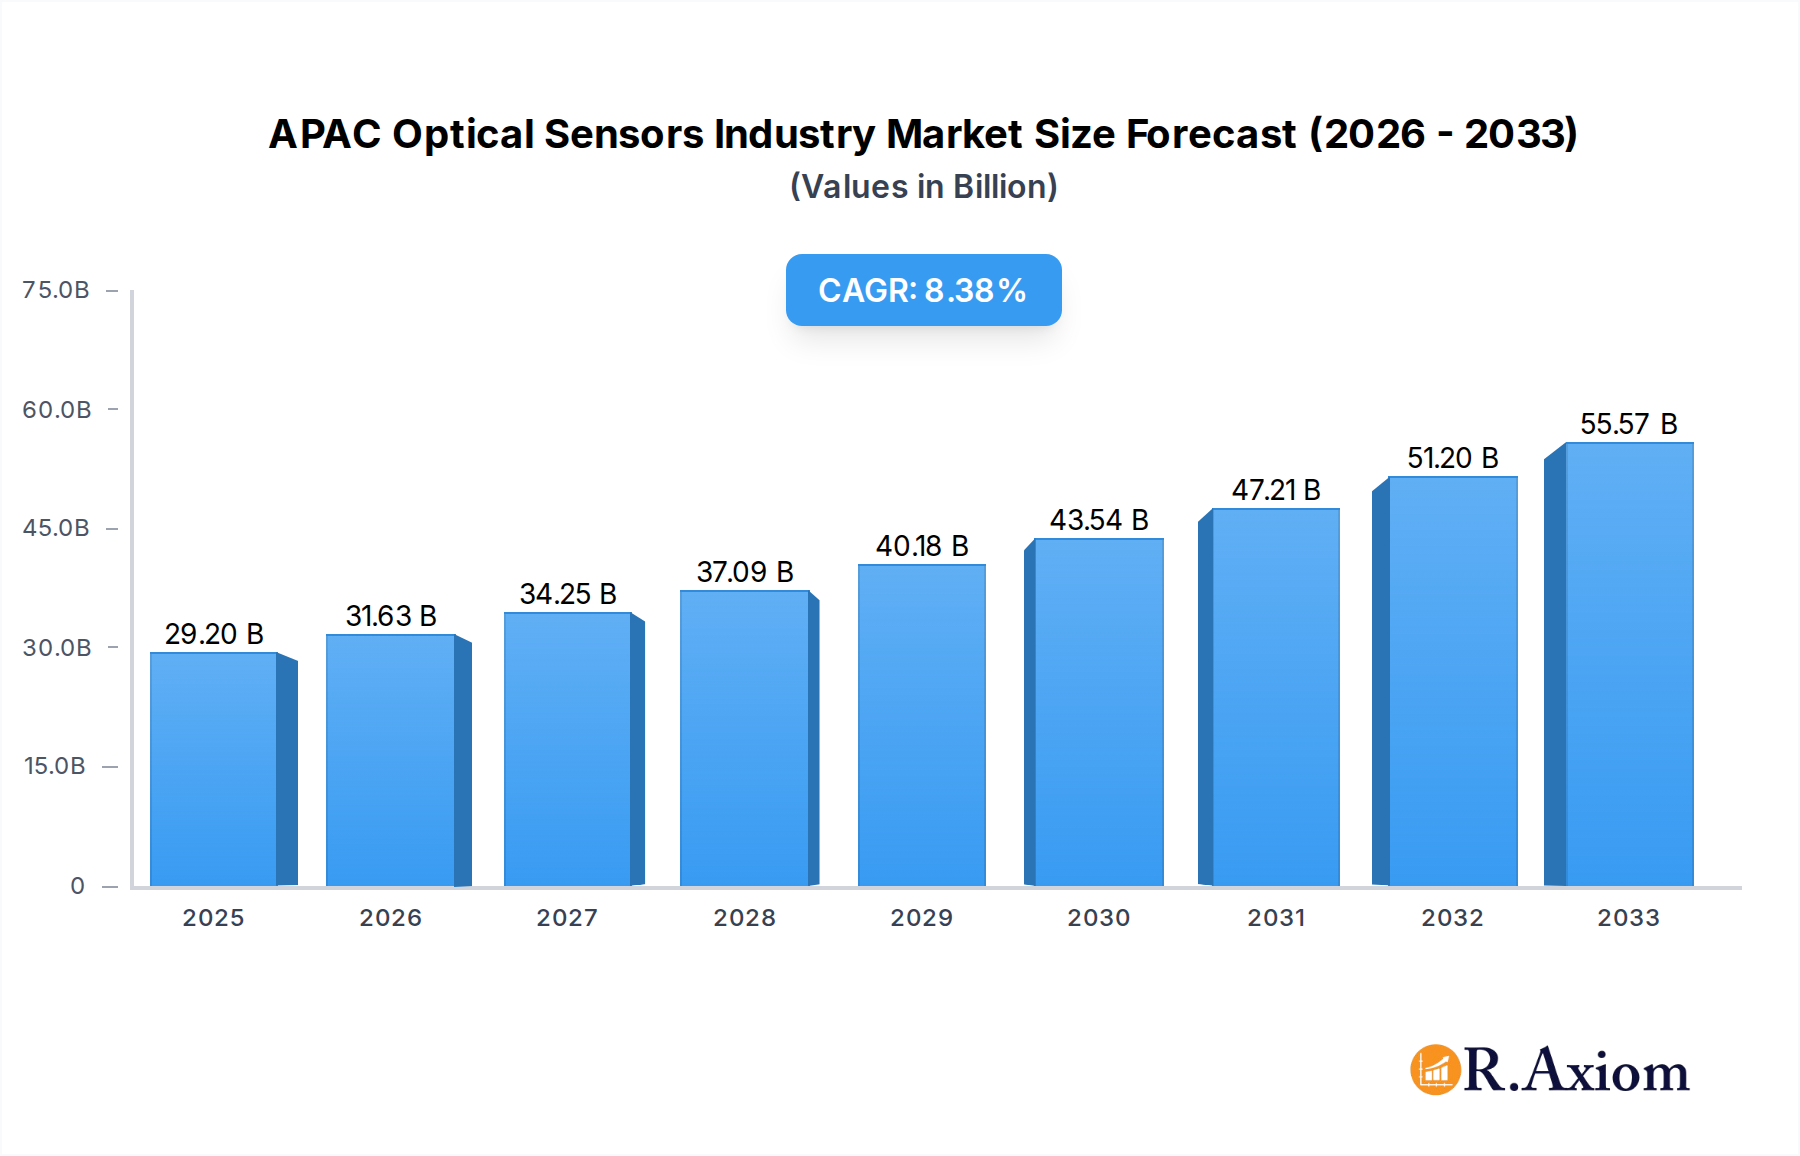
The APAC Optical Sensors Industry is poised for substantial growth, projected to reach USD 29.2 billion by 2025, driven by a robust CAGR of 8.3% throughout the forecast period (2025-2033). This expansion is fueled by the escalating adoption of optical sensors across diverse and rapidly evolving sectors within the Asia Pacific region. Key drivers include the burgeoning demand for advanced automation in industrial manufacturing, the critical need for precision and miniaturization in medical devices, and the increasing integration of biometric and automotive safety features. The widespread proliferation of consumer electronics, from smartphones to smart home devices, further amplifies the requirement for sophisticated optical sensing solutions. The region's strong manufacturing base, coupled with significant investments in research and development, creates a fertile ground for innovation and the adoption of next-generation optical sensor technologies.

APAC Optical Sensors Industry Market Size (In Billion)
The market's trajectory is further shaped by emerging trends such as the development of highly specialized sensor types, including advanced fiber optic and image sensors for enhanced data acquisition and analysis, and the growing importance of infrared and proximity sensors in contactless applications. While the rapid pace of technological advancement and the expanding application landscape present significant opportunities, the industry also navigates challenges such as the initial cost of implementing sophisticated optical sensor systems and the need for standardization in certain application areas. However, the strong underlying demand, supported by favorable government initiatives promoting technological adoption and smart manufacturing across countries like China, India, and Japan, ensures a dynamic and promising outlook for the APAC optical sensors market.
APAC Optical Sensors Industry Company Market Share
APAC Optical Sensors Industry Market Concentration & Innovation
The APAC optical sensors industry exhibits a moderate to high level of market concentration, with key players like Honeywell International Inc., Keyence Corporation, and SICK AG holding significant market share, estimated to be around 30-40% collectively in the 2025 base year. Innovation is a critical differentiator, driven by advancements in miniaturization, increased sensing accuracy, and the development of novel materials. The regulatory framework across APAC nations, while evolving, generally supports technological adoption, particularly in areas like industrial automation and automotive safety. Product substitutes, though present in some niche applications, often fall short of the precision and reliability offered by optical sensors. End-user trends are shifting towards smart manufacturing, the proliferation of Internet of Things (IoT) devices, and enhanced safety features in vehicles, all of which are accelerating the demand for sophisticated optical sensing solutions. Mergers and acquisitions (M&A) activity is a significant indicator of market dynamics, with an estimated $2.5 billion in M&A deals anticipated between 2019 and 2024, reflecting consolidation and strategic expansion by major corporations. The market is poised for further evolution, driven by a continuous push for higher performance and specialized sensor functionalities across diverse applications.
APAC Optical Sensors Industry Industry Trends & Insights
The APAC optical sensors industry is experiencing robust growth, propelled by a confluence of compelling market growth drivers and transformative technological disruptions. The burgeoning demand for automation across manufacturing sectors, spurred by initiatives like Industry 4.0 and smart factories, is a primary catalyst. Optical sensors, with their inherent precision and non-contact measurement capabilities, are indispensable for optimizing production lines, enhancing quality control, and ensuring worker safety. The automotive sector's rapid evolution towards autonomous driving and advanced driver-assistance systems (ADAS) is another significant growth engine. The increasing integration of cameras, LiDAR, and proximity sensors for object detection, navigation, and safety monitoring is directly fueling market expansion. Furthermore, the consumer electronics segment is witnessing an unprecedented uptake of optical sensors for functionalities ranging from biometric authentication (fingerprint and facial recognition) to gesture control and ambient light sensing in smartphones, wearables, and smart home devices. The ongoing miniaturization of electronic components, coupled with advancements in semiconductor technology, enables the development of more compact, energy-efficient, and cost-effective optical sensor solutions. The projected Compound Annual Growth Rate (CAGR) for the APAC optical sensors market is estimated to be in the range of 15-18% over the 2025–2033 forecast period, indicating a highly dynamic and expanding market landscape. Market penetration is steadily increasing across all key application areas, driven by the inherent advantages of optical sensing technology in terms of speed, accuracy, and versatility. Competitive dynamics are characterized by intense innovation, strategic partnerships, and a growing emphasis on integrated sensing solutions that combine multiple sensor types for enhanced functionality. Emerging economies within APAC are also contributing significantly to this growth trajectory as they increasingly adopt advanced technologies to bolster their industrial and technological capabilities. The shift towards sustainable and energy-efficient solutions is also influencing product development, with a focus on low-power optical sensors for battery-operated devices and IoT applications.
Dominant Markets & Segments in APAC Optical Sensors Industry
The Industrial application segment is a dominant force within the APAC optical sensors industry, consistently demonstrating the highest market penetration and revenue contribution. This dominance is underpinned by several key drivers:
- Economic Policies and Infrastructure: Governments across APAC are heavily investing in industrial modernization and smart manufacturing initiatives, fostering an environment ripe for the adoption of advanced automation technologies, including optical sensors. Infrastructure development for industrial parks and specialized manufacturing zones further supports this growth.
- Operational Efficiency Demands: The relentless pursuit of operational efficiency, reduced downtime, and enhanced product quality in manufacturing facilities necessitates the precision and reliability offered by optical sensors for tasks such as automated assembly, defect detection, and process monitoring.
- Worker Safety Regulations: Increasingly stringent worker safety regulations in industrial settings mandate the use of non-contact sensors to minimize human exposure to hazardous environments and moving machinery, directly benefiting the adoption of optical sensor solutions.
Within sensor types, Image Sensors and Position Sensors are experiencing particularly strong demand within the industrial landscape. Image sensors are crucial for machine vision applications, enabling detailed inspection and quality control, while position sensors are vital for robotic automation, material handling, and precise alignment in assembly processes. The growing adoption of collaborative robots (cobots) in manufacturing environments further amplifies the demand for sophisticated optical sensing capabilities to ensure safe human-robot interaction and accurate task execution. The Automotive segment also holds significant sway, propelled by the global shift towards electrification and autonomous driving. Advanced driver-assistance systems (ADAS), crucial for vehicle safety and navigation, rely heavily on a suite of optical sensors, including cameras, LiDAR, and radar (often integrated with optical processing). The increasing complexity of vehicle architectures and the demand for enhanced passenger safety are driving the integration of more advanced and multi-functional optical sensing solutions. Countries like China, Japan, and South Korea, with their strong automotive manufacturing bases, are at the forefront of this trend. The Consumer Electronics segment is another key contributor, fueled by the ubiquitous presence of smart devices. Ambient light sensors, proximity sensors, and image sensors are integral to the functionality of smartphones, tablets, wearables, and smart home devices, enhancing user experience through automatic brightness adjustment, gesture recognition, and advanced camera capabilities. The rapid innovation cycle in consumer electronics ensures a continuous demand for the latest optical sensing technologies.
APAC Optical Sensors Industry Product Developments
Product developments in the APAC optical sensors industry are characterized by a relentless pursuit of enhanced performance, miniaturization, and specialized functionalities. Innovations are focusing on increasing resolution in image sensors for more detailed analysis, improving sensing range and accuracy in proximity and position sensors, and developing more robust and energy-efficient optical components for industrial and automotive applications. The integration of AI and machine learning algorithms into sensor processing is enabling smarter data interpretation and predictive capabilities. Furthermore, the development of novel materials and fabrication techniques is leading to more cost-effective and scalable production, making advanced optical sensing accessible across a wider range of applications. These advancements are crucial for maintaining competitive advantages in rapidly evolving markets like autonomous vehicles and smart manufacturing.
Report Scope & Segmentation Analysis
This report provides a comprehensive analysis of the APAC optical sensors industry, segmented by Sensor Type and Application.
Sensor Types: The market is analyzed across Fiber Optic Sensors, crucial for remote sensing and harsh environments; Image Sensors, fundamental for machine vision and imaging applications; Position Sensors, vital for precise measurement and control; Ambient Light Sensors, enabling adaptive display technologies; Proximity Sensors, used for non-contact object detection; and Infrared Sensors, integral to thermal imaging and presence detection. Each segment is evaluated for its market size, growth projections, and competitive dynamics.
Applications: The report delves into the adoption of optical sensors across Industrial automation and manufacturing; Medical devices and diagnostics; Biometric identification and security; Automotive safety and autonomous systems; Consumer Electronics for smart devices; and Other Applications, encompassing sectors like aerospace and defense. Growth trajectories and market penetration within each application are meticulously detailed.
Key Drivers of APAC Optical Sensors Industry Growth
The APAC optical sensors industry is propelled by several synergistic growth drivers. Technologically, advancements in artificial intelligence (AI) and the Internet of Things (IoT) are creating demand for intelligent, data-rich sensing capabilities. The increasing sophistication of machine vision systems in industrial automation and quality control directly translates to higher adoption of advanced image and proximity sensors. Economically, the robust growth of manufacturing sectors across APAC, particularly in China, India, and Southeast Asia, coupled with significant government investments in smart manufacturing and digital transformation initiatives, provides a fertile ground for sensor deployment. Regulatory drivers, such as stringent safety standards in the automotive industry for ADAS and enhanced workplace safety regulations, are compelling manufacturers to integrate more advanced optical sensing technologies. The growing prevalence of smart consumer electronics also contributes significantly to market expansion.
Challenges in the APAC Optical Sensors Industry Sector
Despite the promising growth trajectory, the APAC optical sensors industry faces several challenges. Intense price competition, particularly from low-cost manufacturers, can erode profit margins and necessitate continuous innovation to maintain market leadership. Supply chain disruptions, exacerbated by geopolitical factors and raw material availability, can impact production timelines and costs. Evolving regulatory landscapes in different APAC countries, while generally supportive, can introduce complexities and compliance requirements for international players. Furthermore, the need for specialized technical expertise for the development, integration, and maintenance of advanced optical sensing systems can pose a challenge in certain regions. The high initial investment cost for some cutting-edge optical sensor technologies can also be a barrier to adoption for smaller enterprises.
Emerging Opportunities in APAC Optical Sensors Industry
Emerging opportunities within the APAC optical sensors industry are abundant and diverse. The rapid expansion of the electric vehicle (EV) market presents significant opportunities for optical sensors in battery management, charging infrastructure, and advanced driver assistance. The burgeoning healthcare sector, driven by an aging population and advancements in medical technology, is creating demand for optical sensors in diagnostic equipment, minimally invasive surgical tools, and patient monitoring systems. The increasing adoption of smart city initiatives across APAC, focused on traffic management, public safety, and environmental monitoring, will fuel the demand for various types of optical sensors. Furthermore, the continuous miniaturization and cost reduction of optical sensor technology are opening up new application areas in portable devices, agricultural technology, and industrial IoT solutions, promising substantial market growth.
Leading Players in the APAC Optical Sensors Industry Market
- Honeywell International Inc.
- Keyence Corporation
- SICK AG
- STMicroelectronics NV
- Shinkoh Electronics Co Ltd
- Robert Bosch GmbH
- Atmel Corporation
- Rockwell Automation Inc
- OZ Optics Ltd
- Neubrex Co Ltd
Key Developments in APAC Optical Sensors Industry Industry
- September 2022: The Northeast Frontier Railway (NFR) announced rolling out an optical sensor technology to alert locomotive drivers about the presence of animals in the vicinity of trains. The development took place after the amplifying system imitating the buzz of a swarm of honey bees to keep wild jumbos away from rail tracks failed to give an ultimate solution to curb elephant deaths.
Strategic Outlook for APAC Optical Sensors Industry Market
The strategic outlook for the APAC optical sensors industry is exceptionally positive, driven by the accelerating pace of technological adoption across key sectors. The ongoing digital transformation in manufacturing, the relentless drive towards autonomous mobility, and the pervasive integration of smart technologies in consumer electronics will continue to be major growth catalysts. Investments in research and development focused on next-generation optical sensing technologies, including advancements in AI-powered analytics and hyper-spectral imaging, will be crucial for market leaders. Strategic collaborations between sensor manufacturers, system integrators, and end-users will foster innovation and accelerate market penetration. The trend towards customized and integrated sensing solutions tailored to specific application needs will also define future market strategies, ensuring sustained growth and market leadership in this dynamic industry.
APAC Optical Sensors Industry Segmentation
-
1. Sensor Type
- 1.1. Fiber Optic Sensors
- 1.2. Image Sensors
- 1.3. Position Sensors
- 1.4. Ambient light
- 1.5. Proximity Sensors
- 1.6. Infrared Sensors
-
2. Application
- 2.1. Industrial
- 2.2. Medical
- 2.3. Biometric
- 2.4. Automotive
- 2.5. Consumer Electronics
- 2.6. Other Applications
APAC Optical Sensors Industry Segmentation By Geography
-
1. North America
- 1.1. United States
- 1.2. Canada
- 1.3. Mexico
-
2. South America
- 2.1. Brazil
- 2.2. Argentina
- 2.3. Rest of South America
-
3. Europe
- 3.1. United Kingdom
- 3.2. Germany
- 3.3. France
- 3.4. Italy
- 3.5. Spain
- 3.6. Russia
- 3.7. Benelux
- 3.8. Nordics
- 3.9. Rest of Europe
-
4. Middle East & Africa
- 4.1. Turkey
- 4.2. Israel
- 4.3. GCC
- 4.4. North Africa
- 4.5. South Africa
- 4.6. Rest of Middle East & Africa
-
5. Asia Pacific
- 5.1. China
- 5.2. India
- 5.3. Japan
- 5.4. South Korea
- 5.5. ASEAN
- 5.6. Oceania
- 5.7. Rest of Asia Pacific
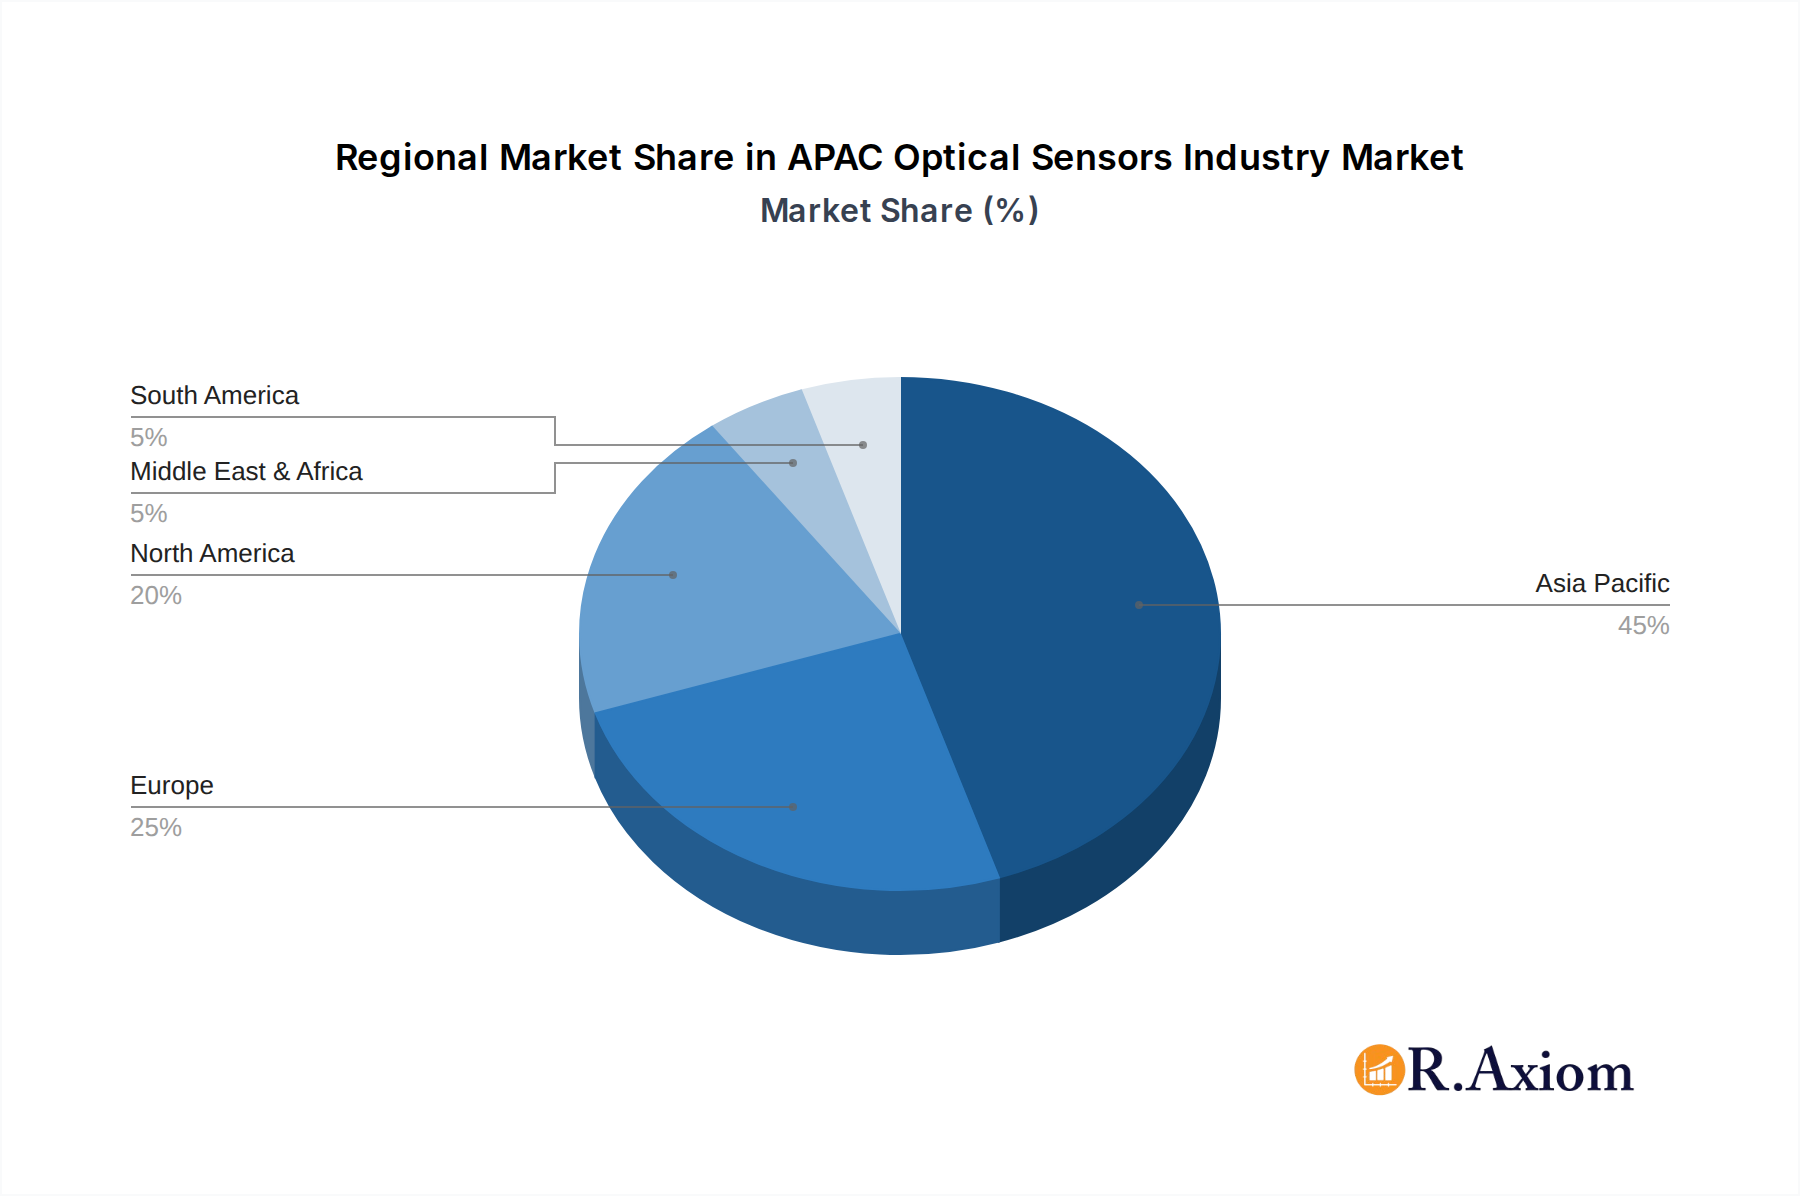
APAC Optical Sensors Industry Regional Market Share
Geographic Coverage of APAC Optical Sensors Industry
APAC Optical Sensors Industry REPORT HIGHLIGHTS
| Aspects | Details |
|---|---|
| Study Period | 2020-2034 |
| Base Year | 2025 |
| Estimated Year | 2026 |
| Forecast Period | 2026-2034 |
| Historical Period | 2020-2025 |
| Growth Rate | CAGR of 8.3% from 2020-2034 |
| Segmentation |
|
Table of Contents
- 1. Introduction
- 1.1. Research Scope
- 1.2. Market Segmentation
- 1.3. Research Objective
- 1.4. Definitions and Assumptions
- 2. Executive Summary
- 2.1. Market Snapshot
- 3. Market Dynamics
- 3.1. Market Drivers
- 3.2. Market Restrains
- 3.3. Market Trends
- 3.4. Market Opportunities
- 4. Market Factor Analysis
- 4.1. Porters Five Forces
- 4.1.1. Bargaining Power of Suppliers
- 4.1.2. Bargaining Power of Buyers
- 4.1.3. Threat of New Entrants
- 4.1.4. Threat of Substitutes
- 4.1.5. Competitive Rivalry
- 4.2. PESTEL analysis
- 4.3. BCG Analysis
- 4.3.1. Stars (High Growth, High Market Share)
- 4.3.2. Cash Cows (Low Growth, High Market Share)
- 4.3.3. Question Mark (High Growth, Low Market Share)
- 4.3.4. Dogs (Low Growth, Low Market Share)
- 4.4. Ansoff Matrix Analysis
- 4.5. Supply Chain Analysis
- 4.6. Regulatory Landscape
- 4.7. Current Market Potential and Opportunity Assessment (TAM–SAM–SOM Framework)
- 4.8. RAX Analyst Note
- 4.1. Porters Five Forces
- 5. Market Analysis, Insights and Forecast 2021-2033
- 5.1. Market Analysis, Insights and Forecast - by Sensor Type
- 5.1.1. Fiber Optic Sensors
- 5.1.2. Image Sensors
- 5.1.3. Position Sensors
- 5.1.4. Ambient light
- 5.1.5. Proximity Sensors
- 5.1.6. Infrared Sensors
- 5.2. Market Analysis, Insights and Forecast - by Application
- 5.2.1. Industrial
- 5.2.2. Medical
- 5.2.3. Biometric
- 5.2.4. Automotive
- 5.2.5. Consumer Electronics
- 5.2.6. Other Applications
- 5.3. Market Analysis, Insights and Forecast - by Region
- 5.3.1. North America
- 5.3.2. South America
- 5.3.3. Europe
- 5.3.4. Middle East & Africa
- 5.3.5. Asia Pacific
- 5.1. Market Analysis, Insights and Forecast - by Sensor Type
- 6. Global APAC Optical Sensors Industry Analysis, Insights and Forecast, 2021-2033
- 6.1. Market Analysis, Insights and Forecast - by Sensor Type
- 6.1.1. Fiber Optic Sensors
- 6.1.2. Image Sensors
- 6.1.3. Position Sensors
- 6.1.4. Ambient light
- 6.1.5. Proximity Sensors
- 6.1.6. Infrared Sensors
- 6.2. Market Analysis, Insights and Forecast - by Application
- 6.2.1. Industrial
- 6.2.2. Medical
- 6.2.3. Biometric
- 6.2.4. Automotive
- 6.2.5. Consumer Electronics
- 6.2.6. Other Applications
- 6.1. Market Analysis, Insights and Forecast - by Sensor Type
- 7. North America APAC Optical Sensors Industry Analysis, Insights and Forecast, 2020-2032
- 7.1. Market Analysis, Insights and Forecast - by Sensor Type
- 7.1.1. Fiber Optic Sensors
- 7.1.2. Image Sensors
- 7.1.3. Position Sensors
- 7.1.4. Ambient light
- 7.1.5. Proximity Sensors
- 7.1.6. Infrared Sensors
- 7.2. Market Analysis, Insights and Forecast - by Application
- 7.2.1. Industrial
- 7.2.2. Medical
- 7.2.3. Biometric
- 7.2.4. Automotive
- 7.2.5. Consumer Electronics
- 7.2.6. Other Applications
- 7.1. Market Analysis, Insights and Forecast - by Sensor Type
- 8. South America APAC Optical Sensors Industry Analysis, Insights and Forecast, 2020-2032
- 8.1. Market Analysis, Insights and Forecast - by Sensor Type
- 8.1.1. Fiber Optic Sensors
- 8.1.2. Image Sensors
- 8.1.3. Position Sensors
- 8.1.4. Ambient light
- 8.1.5. Proximity Sensors
- 8.1.6. Infrared Sensors
- 8.2. Market Analysis, Insights and Forecast - by Application
- 8.2.1. Industrial
- 8.2.2. Medical
- 8.2.3. Biometric
- 8.2.4. Automotive
- 8.2.5. Consumer Electronics
- 8.2.6. Other Applications
- 8.1. Market Analysis, Insights and Forecast - by Sensor Type
- 9. Europe APAC Optical Sensors Industry Analysis, Insights and Forecast, 2020-2032
- 9.1. Market Analysis, Insights and Forecast - by Sensor Type
- 9.1.1. Fiber Optic Sensors
- 9.1.2. Image Sensors
- 9.1.3. Position Sensors
- 9.1.4. Ambient light
- 9.1.5. Proximity Sensors
- 9.1.6. Infrared Sensors
- 9.2. Market Analysis, Insights and Forecast - by Application
- 9.2.1. Industrial
- 9.2.2. Medical
- 9.2.3. Biometric
- 9.2.4. Automotive
- 9.2.5. Consumer Electronics
- 9.2.6. Other Applications
- 9.1. Market Analysis, Insights and Forecast - by Sensor Type
- 10. Middle East & Africa APAC Optical Sensors Industry Analysis, Insights and Forecast, 2020-2032
- 10.1. Market Analysis, Insights and Forecast - by Sensor Type
- 10.1.1. Fiber Optic Sensors
- 10.1.2. Image Sensors
- 10.1.3. Position Sensors
- 10.1.4. Ambient light
- 10.1.5. Proximity Sensors
- 10.1.6. Infrared Sensors
- 10.2. Market Analysis, Insights and Forecast - by Application
- 10.2.1. Industrial
- 10.2.2. Medical
- 10.2.3. Biometric
- 10.2.4. Automotive
- 10.2.5. Consumer Electronics
- 10.2.6. Other Applications
- 10.1. Market Analysis, Insights and Forecast - by Sensor Type
- 11. Asia Pacific APAC Optical Sensors Industry Analysis, Insights and Forecast, 2020-2032
- 11.1. Market Analysis, Insights and Forecast - by Sensor Type
- 11.1.1. Fiber Optic Sensors
- 11.1.2. Image Sensors
- 11.1.3. Position Sensors
- 11.1.4. Ambient light
- 11.1.5. Proximity Sensors
- 11.1.6. Infrared Sensors
- 11.2. Market Analysis, Insights and Forecast - by Application
- 11.2.1. Industrial
- 11.2.2. Medical
- 11.2.3. Biometric
- 11.2.4. Automotive
- 11.2.5. Consumer Electronics
- 11.2.6. Other Applications
- 11.1. Market Analysis, Insights and Forecast - by Sensor Type
- 12. Competitive Analysis
- 12.1. Company Profiles
- 12.1.1 Honeywell International Inc
- 12.1.1.1. Company Overview
- 12.1.1.2. Products
- 12.1.1.3. Company Financials
- 12.1.1.4. SWOT Analysis
- 12.1.2 Keyence Corporation
- 12.1.2.1. Company Overview
- 12.1.2.2. Products
- 12.1.2.3. Company Financials
- 12.1.2.4. SWOT Analysis
- 12.1.3 SICK AG
- 12.1.3.1. Company Overview
- 12.1.3.2. Products
- 12.1.3.3. Company Financials
- 12.1.3.4. SWOT Analysis
- 12.1.4 STMicroelectronics NV
- 12.1.4.1. Company Overview
- 12.1.4.2. Products
- 12.1.4.3. Company Financials
- 12.1.4.4. SWOT Analysis
- 12.1.5 Shinkoh Electronics Co Ltd
- 12.1.5.1. Company Overview
- 12.1.5.2. Products
- 12.1.5.3. Company Financials
- 12.1.5.4. SWOT Analysis
- 12.1.6 Robert Bosch GmbH
- 12.1.6.1. Company Overview
- 12.1.6.2. Products
- 12.1.6.3. Company Financials
- 12.1.6.4. SWOT Analysis
- 12.1.7 Atmel Corporation
- 12.1.7.1. Company Overview
- 12.1.7.2. Products
- 12.1.7.3. Company Financials
- 12.1.7.4. SWOT Analysis
- 12.1.8 Rockwell Automation Inc
- 12.1.8.1. Company Overview
- 12.1.8.2. Products
- 12.1.8.3. Company Financials
- 12.1.8.4. SWOT Analysis
- 12.1.9 OZ Optics Ltd
- 12.1.9.1. Company Overview
- 12.1.9.2. Products
- 12.1.9.3. Company Financials
- 12.1.9.4. SWOT Analysis
- 12.1.10 Neubrex Co Ltd *List Not Exhaustive
- 12.1.10.1. Company Overview
- 12.1.10.2. Products
- 12.1.10.3. Company Financials
- 12.1.10.4. SWOT Analysis
- 12.1.1 Honeywell International Inc
- 12.2. Market Entropy
- 12.2.1 Company's Key Areas Served
- 12.2.2 Recent Developments
- 12.3. Company Market Share Analysis 2025
- 12.3.1 Top 5 Companies Market Share Analysis
- 12.3.2 Top 3 Companies Market Share Analysis
- 12.4. List of Potential Customers
- 13. Research Methodology
List of Figures
- Figure 1: Global APAC Optical Sensors Industry Revenue Breakdown (billion, %) by Region 2025 & 2033
- Figure 2: North America APAC Optical Sensors Industry Revenue (billion), by Sensor Type 2025 & 2033
- Figure 3: North America APAC Optical Sensors Industry Revenue Share (%), by Sensor Type 2025 & 2033
- Figure 4: North America APAC Optical Sensors Industry Revenue (billion), by Application 2025 & 2033
- Figure 5: North America APAC Optical Sensors Industry Revenue Share (%), by Application 2025 & 2033
- Figure 6: North America APAC Optical Sensors Industry Revenue (billion), by Country 2025 & 2033
- Figure 7: North America APAC Optical Sensors Industry Revenue Share (%), by Country 2025 & 2033
- Figure 8: South America APAC Optical Sensors Industry Revenue (billion), by Sensor Type 2025 & 2033
- Figure 9: South America APAC Optical Sensors Industry Revenue Share (%), by Sensor Type 2025 & 2033
- Figure 10: South America APAC Optical Sensors Industry Revenue (billion), by Application 2025 & 2033
- Figure 11: South America APAC Optical Sensors Industry Revenue Share (%), by Application 2025 & 2033
- Figure 12: South America APAC Optical Sensors Industry Revenue (billion), by Country 2025 & 2033
- Figure 13: South America APAC Optical Sensors Industry Revenue Share (%), by Country 2025 & 2033
- Figure 14: Europe APAC Optical Sensors Industry Revenue (billion), by Sensor Type 2025 & 2033
- Figure 15: Europe APAC Optical Sensors Industry Revenue Share (%), by Sensor Type 2025 & 2033
- Figure 16: Europe APAC Optical Sensors Industry Revenue (billion), by Application 2025 & 2033
- Figure 17: Europe APAC Optical Sensors Industry Revenue Share (%), by Application 2025 & 2033
- Figure 18: Europe APAC Optical Sensors Industry Revenue (billion), by Country 2025 & 2033
- Figure 19: Europe APAC Optical Sensors Industry Revenue Share (%), by Country 2025 & 2033
- Figure 20: Middle East & Africa APAC Optical Sensors Industry Revenue (billion), by Sensor Type 2025 & 2033
- Figure 21: Middle East & Africa APAC Optical Sensors Industry Revenue Share (%), by Sensor Type 2025 & 2033
- Figure 22: Middle East & Africa APAC Optical Sensors Industry Revenue (billion), by Application 2025 & 2033
- Figure 23: Middle East & Africa APAC Optical Sensors Industry Revenue Share (%), by Application 2025 & 2033
- Figure 24: Middle East & Africa APAC Optical Sensors Industry Revenue (billion), by Country 2025 & 2033
- Figure 25: Middle East & Africa APAC Optical Sensors Industry Revenue Share (%), by Country 2025 & 2033
- Figure 26: Asia Pacific APAC Optical Sensors Industry Revenue (billion), by Sensor Type 2025 & 2033
- Figure 27: Asia Pacific APAC Optical Sensors Industry Revenue Share (%), by Sensor Type 2025 & 2033
- Figure 28: Asia Pacific APAC Optical Sensors Industry Revenue (billion), by Application 2025 & 2033
- Figure 29: Asia Pacific APAC Optical Sensors Industry Revenue Share (%), by Application 2025 & 2033
- Figure 30: Asia Pacific APAC Optical Sensors Industry Revenue (billion), by Country 2025 & 2033
- Figure 31: Asia Pacific APAC Optical Sensors Industry Revenue Share (%), by Country 2025 & 2033
List of Tables
- Table 1: Global APAC Optical Sensors Industry Revenue billion Forecast, by Sensor Type 2020 & 2033
- Table 2: Global APAC Optical Sensors Industry Revenue billion Forecast, by Application 2020 & 2033
- Table 3: Global APAC Optical Sensors Industry Revenue billion Forecast, by Region 2020 & 2033
- Table 4: Global APAC Optical Sensors Industry Revenue billion Forecast, by Sensor Type 2020 & 2033
- Table 5: Global APAC Optical Sensors Industry Revenue billion Forecast, by Application 2020 & 2033
- Table 6: Global APAC Optical Sensors Industry Revenue billion Forecast, by Country 2020 & 2033
- Table 7: United States APAC Optical Sensors Industry Revenue (billion) Forecast, by Application 2020 & 2033
- Table 8: Canada APAC Optical Sensors Industry Revenue (billion) Forecast, by Application 2020 & 2033
- Table 9: Mexico APAC Optical Sensors Industry Revenue (billion) Forecast, by Application 2020 & 2033
- Table 10: Global APAC Optical Sensors Industry Revenue billion Forecast, by Sensor Type 2020 & 2033
- Table 11: Global APAC Optical Sensors Industry Revenue billion Forecast, by Application 2020 & 2033
- Table 12: Global APAC Optical Sensors Industry Revenue billion Forecast, by Country 2020 & 2033
- Table 13: Brazil APAC Optical Sensors Industry Revenue (billion) Forecast, by Application 2020 & 2033
- Table 14: Argentina APAC Optical Sensors Industry Revenue (billion) Forecast, by Application 2020 & 2033
- Table 15: Rest of South America APAC Optical Sensors Industry Revenue (billion) Forecast, by Application 2020 & 2033
- Table 16: Global APAC Optical Sensors Industry Revenue billion Forecast, by Sensor Type 2020 & 2033
- Table 17: Global APAC Optical Sensors Industry Revenue billion Forecast, by Application 2020 & 2033
- Table 18: Global APAC Optical Sensors Industry Revenue billion Forecast, by Country 2020 & 2033
- Table 19: United Kingdom APAC Optical Sensors Industry Revenue (billion) Forecast, by Application 2020 & 2033
- Table 20: Germany APAC Optical Sensors Industry Revenue (billion) Forecast, by Application 2020 & 2033
- Table 21: France APAC Optical Sensors Industry Revenue (billion) Forecast, by Application 2020 & 2033
- Table 22: Italy APAC Optical Sensors Industry Revenue (billion) Forecast, by Application 2020 & 2033
- Table 23: Spain APAC Optical Sensors Industry Revenue (billion) Forecast, by Application 2020 & 2033
- Table 24: Russia APAC Optical Sensors Industry Revenue (billion) Forecast, by Application 2020 & 2033
- Table 25: Benelux APAC Optical Sensors Industry Revenue (billion) Forecast, by Application 2020 & 2033
- Table 26: Nordics APAC Optical Sensors Industry Revenue (billion) Forecast, by Application 2020 & 2033
- Table 27: Rest of Europe APAC Optical Sensors Industry Revenue (billion) Forecast, by Application 2020 & 2033
- Table 28: Global APAC Optical Sensors Industry Revenue billion Forecast, by Sensor Type 2020 & 2033
- Table 29: Global APAC Optical Sensors Industry Revenue billion Forecast, by Application 2020 & 2033
- Table 30: Global APAC Optical Sensors Industry Revenue billion Forecast, by Country 2020 & 2033
- Table 31: Turkey APAC Optical Sensors Industry Revenue (billion) Forecast, by Application 2020 & 2033
- Table 32: Israel APAC Optical Sensors Industry Revenue (billion) Forecast, by Application 2020 & 2033
- Table 33: GCC APAC Optical Sensors Industry Revenue (billion) Forecast, by Application 2020 & 2033
- Table 34: North Africa APAC Optical Sensors Industry Revenue (billion) Forecast, by Application 2020 & 2033
- Table 35: South Africa APAC Optical Sensors Industry Revenue (billion) Forecast, by Application 2020 & 2033
- Table 36: Rest of Middle East & Africa APAC Optical Sensors Industry Revenue (billion) Forecast, by Application 2020 & 2033
- Table 37: Global APAC Optical Sensors Industry Revenue billion Forecast, by Sensor Type 2020 & 2033
- Table 38: Global APAC Optical Sensors Industry Revenue billion Forecast, by Application 2020 & 2033
- Table 39: Global APAC Optical Sensors Industry Revenue billion Forecast, by Country 2020 & 2033
- Table 40: China APAC Optical Sensors Industry Revenue (billion) Forecast, by Application 2020 & 2033
- Table 41: India APAC Optical Sensors Industry Revenue (billion) Forecast, by Application 2020 & 2033
- Table 42: Japan APAC Optical Sensors Industry Revenue (billion) Forecast, by Application 2020 & 2033
- Table 43: South Korea APAC Optical Sensors Industry Revenue (billion) Forecast, by Application 2020 & 2033
- Table 44: ASEAN APAC Optical Sensors Industry Revenue (billion) Forecast, by Application 2020 & 2033
- Table 45: Oceania APAC Optical Sensors Industry Revenue (billion) Forecast, by Application 2020 & 2033
- Table 46: Rest of Asia Pacific APAC Optical Sensors Industry Revenue (billion) Forecast, by Application 2020 & 2033
Frequently Asked Questions
1. What is the projected Compound Annual Growth Rate (CAGR) of the APAC Optical Sensors Industry?
The projected CAGR is approximately 8.3%.
2. Which companies are prominent players in the APAC Optical Sensors Industry?
Key companies in the market include Honeywell International Inc, Keyence Corporation, SICK AG, STMicroelectronics NV, Shinkoh Electronics Co Ltd, Robert Bosch GmbH, Atmel Corporation, Rockwell Automation Inc, OZ Optics Ltd, Neubrex Co Ltd *List Not Exhaustive.
3. What are the main segments of the APAC Optical Sensors Industry?
The market segments include Sensor Type, Application.
4. Can you provide details about the market size?
The market size is estimated to be USD 29.2 billion as of 2022.
5. What are some drivers contributing to market growth?
Increasing demand from consumer electronics; Rising adoption of IoT.
6. What are the notable trends driving market growth?
Growing consumer electronics demand will boost the market growth.
7. Are there any restraints impacting market growth?
Intense Competition in the Market.
8. Can you provide examples of recent developments in the market?
September 2022 - The Northeast Frontier Railway (NFR) announced rolling out an optical sensor technology to alert locomotive drivers about the presence of animals in the vicinity of trains. The development took place after the amplifying system imitating the buzz of a swarm of honey bees to keep wild jumbos away from rail tracks failed to give an ultimate solution to curb elephant deaths.
9. What pricing options are available for accessing the report?
Pricing options include single-user, multi-user, and enterprise licenses priced at USD 4750, USD 4950, and USD 6800 respectively.
10. Is the market size provided in terms of value or volume?
The market size is provided in terms of value, measured in billion.
11. Are there any specific market keywords associated with the report?
Yes, the market keyword associated with the report is "APAC Optical Sensors Industry," which aids in identifying and referencing the specific market segment covered.
12. How do I determine which pricing option suits my needs best?
The pricing options vary based on user requirements and access needs. Individual users may opt for single-user licenses, while businesses requiring broader access may choose multi-user or enterprise licenses for cost-effective access to the report.
13. Are there any additional resources or data provided in the APAC Optical Sensors Industry report?
While the report offers comprehensive insights, it's advisable to review the specific contents or supplementary materials provided to ascertain if additional resources or data are available.
14. How can I stay updated on further developments or reports in the APAC Optical Sensors Industry?
To stay informed about further developments, trends, and reports in the APAC Optical Sensors Industry, consider subscribing to industry newsletters, following relevant companies and organizations, or regularly checking reputable industry news sources and publications.
Methodology
Step 1 - Identification of Relevant Samples Size from Population Database


Step 2 - Approaches for Defining Global Market Size (Value, Volume* & Price*)

Note*: In applicable scenarios
Step 3 - Data Sources
Primary Research
- Web Analytics
- Survey Reports
- Research Institute
- Latest Research Reports
- Opinion Leaders
Secondary Research
- Annual Reports
- White Paper
- Latest Press Release
- Industry Association
- Paid Database
- Investor Presentations

Step 4 - Data Triangulation
Involves using different sources of information in order to increase the validity of a study
These sources are likely to be stakeholders in a program - participants, other researchers, program staff, other community members, and so on.
Then we put all data in single framework & apply various statistical tools to find out the dynamic on the market.
During the analysis stage, feedback from the stakeholder groups would be compared to determine areas of agreement as well as areas of divergence