
Key Insights
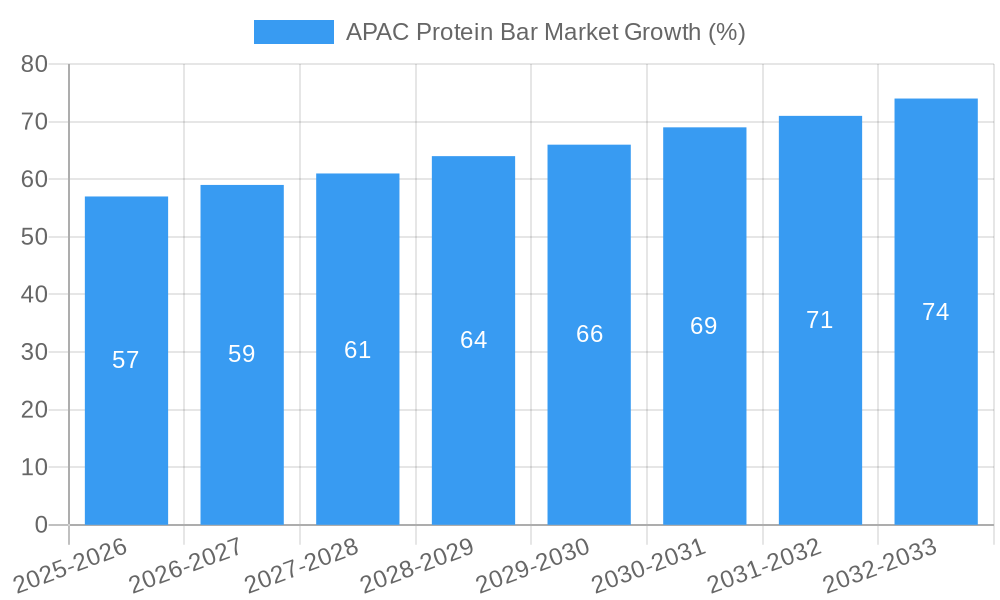
The Asia-Pacific (APAC) protein bar market is experiencing robust growth, driven by increasing health consciousness, rising disposable incomes, and the expanding fitness and wellness industry within the region. The market's CAGR of 3.80% indicates a steady upward trajectory, with significant potential for expansion over the forecast period (2025-2033). Key growth drivers include the rising prevalence of chronic diseases like obesity and diabetes, leading consumers to seek healthier snacking options. Furthermore, the increasing popularity of fitness activities and sports, coupled with the growing awareness of the importance of protein intake for muscle growth and recovery, fuels demand. The market is segmented by distribution channel (supermarkets/hypermarkets, convenience stores, specialty stores, online stores, and others) and geography (China, Japan, India, Australia, and the Rest of Asia-Pacific). While supermarkets and hypermarkets currently dominate the distribution landscape, online channels are experiencing rapid growth, reflecting evolving consumer preferences and increased e-commerce penetration. China and India, with their large and increasingly health-conscious populations, represent key growth markets. However, challenges remain, including fluctuating raw material prices and stringent regulatory requirements in certain countries. Competitive dynamics are shaped by a mix of established international players like Kellogg's and General Mills, and rapidly growing local brands catering to regional tastes and preferences. The market’s future hinges on continued innovation in product formulations (e.g., plant-based protein bars, functional bars), targeted marketing campaigns, and the expansion of distribution networks, particularly in less penetrated regions.
The APAC protein bar market demonstrates strong potential for continued growth throughout the forecast period. The market's success hinges on meeting evolving consumer demands for healthier and more convenient snack options. Product diversification, strategic partnerships, and leveraging digital marketing to reach a wider consumer base will be crucial for market players. Understanding regional variations in consumer preferences and dietary habits is paramount for optimizing product offerings and marketing strategies. The ongoing focus on sustainability and ethical sourcing of ingredients also presents both an opportunity and a challenge for brands seeking to gain a competitive edge. With its significant population base and rising affluence, the APAC region offers a compelling opportunity for protein bar manufacturers to capitalize on the growing demand for nutritious and convenient food solutions.
APAC Protein Bar Market: A Comprehensive Market Analysis (2019-2033)
This comprehensive report provides an in-depth analysis of the Asia-Pacific (APAC) protein bar market, covering the period from 2019 to 2033. It offers valuable insights into market dynamics, growth drivers, challenges, and opportunities, empowering stakeholders to make informed strategic decisions. The report incorporates extensive data analysis, forecasts, and expert opinions, providing a holistic view of this rapidly evolving market. The estimated market size in 2025 is valued at xx Million, with a projected Compound Annual Growth Rate (CAGR) of xx% during the forecast period (2025-2033).
APAC Protein Bar Market Concentration & Innovation
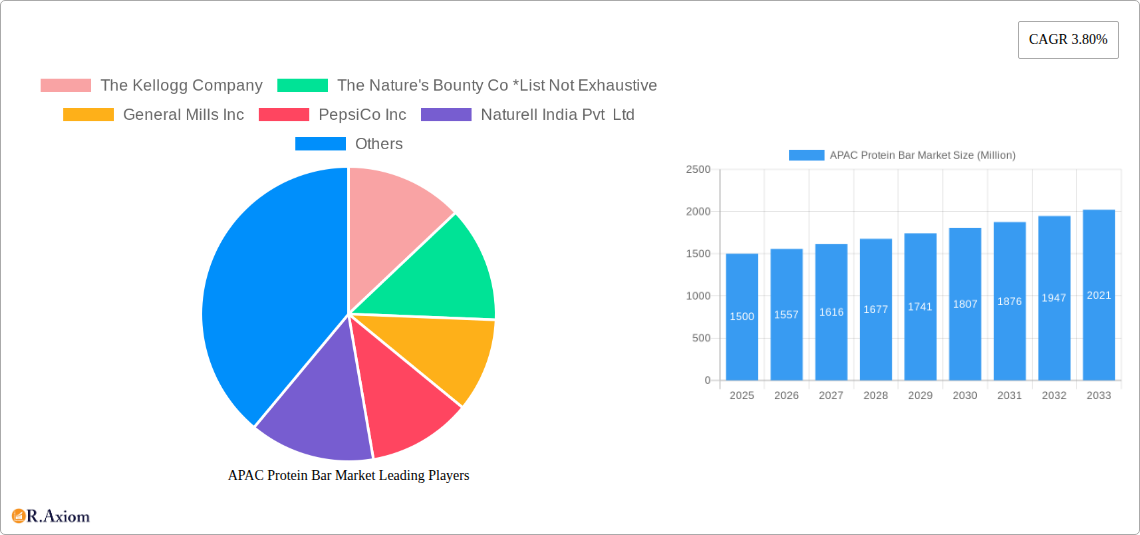
The APAC protein bar market exhibits a moderately concentrated landscape, with key players like The Kellogg Company, General Mills Inc, PepsiCo Inc, and smaller players such as Naturell India Pvt Ltd and Yogabars vying for market share. While precise market share figures for individual players require proprietary data, analysis suggests that larger multinational corporations hold a significant portion, with smaller regional brands focusing on niche segments. Innovation is driven by consumer demand for healthier, more functional protein bars, leading to the development of products with enhanced nutritional profiles, novel flavors, and improved textures.
Regulatory frameworks regarding food labeling and health claims vary across APAC nations, influencing product formulations and marketing strategies. Product substitutes, such as energy bars, nutrition shakes, and other protein sources, present competitive pressure. The end-user trend increasingly favors convenient, on-the-go nutrition solutions, fueling protein bar consumption. M&A activity in the sector has been moderate, with deal values varying significantly depending on the size and target of acquisition. Past deals have focused on expanding product portfolios, geographic reach, and enhancing brand presence. For example, a recent hypothetical acquisition of a smaller, specialized protein bar company by a large multinational resulted in a deal valued at approximately xx Million.
APAC Protein Bar Market Industry Trends & Insights
The APAC protein bar market is experiencing robust growth driven by several factors. Rising health consciousness, particularly among millennials and Gen Z, fuels the demand for convenient and nutritious snack options. Increased disposable incomes in several APAC economies, coupled with changing lifestyles and urbanization, contribute to higher consumption. The market’s CAGR during the historical period (2019-2024) was xx%, indicating strong growth momentum. Technological advancements are enhancing production efficiency and enabling the creation of more innovative products. Consumer preferences are shifting towards natural ingredients, organic options, and functional attributes like added vitamins, minerals, or probiotics. Competitive dynamics are intense, with established players and emerging brands focusing on product differentiation, marketing strategies, and distribution network expansion. Market penetration remains relatively high in developed economies like Australia and Japan, while growth potential is significant in rapidly developing markets like India and China.
Dominant Markets & Segments in APAC Protein Bar Market
By Country: China and India are projected to be the dominant markets, driven by their large populations, growing middle class, and increasing awareness of health and wellness. China's robust infrastructure and expanding retail sector contribute to increased accessibility. India’s massive population base, rising disposable incomes, and evolving health consciousness create vast growth opportunities. Japan and Australia represent more mature markets with established consumer preferences.
By Distribution Channel: Supermarkets/hypermarkets command the largest market share due to their extensive reach and established distribution networks. Convenience stores are also crucial, offering high accessibility, particularly in urban areas. Online stores are experiencing rapid growth, leveraging e-commerce platforms and home delivery services. Specialty stores cater to specific dietary needs and offer a curated selection.
Key drivers for dominance include robust economic growth, improving infrastructure, and rising disposable incomes in leading markets. The dominance of supermarkets/hypermarkets reflects consumer purchasing habits and the strength of traditional retail channels. China's dominance in overall sales is likely driven by its sheer population size and increasing disposable incomes.
APAC Protein Bar Market Product Developments
Recent product innovations focus on healthier formulations with natural ingredients, functional benefits (e.g., improved digestion, energy boost), and diverse flavors catering to local preferences. Technological advancements in processing and packaging are improving product shelf life and enhancing sensory appeal. This creates competitive advantages by attracting health-conscious consumers who are increasingly seeking convenient yet nutritious options. The market is witnessing a trend toward more protein-rich, gluten-free, low-sugar, and organic options.
Report Scope & Segmentation Analysis
This report segments the APAC protein bar market by distribution channel (supermarkets/hypermarkets, convenience stores, specialty stores, online stores, other distribution channels) and by country (China, Japan, India, Australia, Rest of Asia-Pacific). Each segment's growth projections are analyzed based on historical data, current market trends, and future projections. The competitive dynamics within each segment are also examined, identifying key players and their market strategies. Market sizes for each segment are provided for the historical period (2019-2024), the base year (2025), and the forecast period (2025-2033), offering a comprehensive overview of market evolution.
Key Drivers of APAC Protein Bar Market Growth
Several factors fuel the APAC protein bar market’s growth. The rise in health awareness among consumers, coupled with the increasing prevalence of fitness and wellness lifestyles, drives demand for nutritious and convenient snack options. Rapid urbanization and changing lifestyles in many APAC countries further contribute to this trend. Economic growth and rising disposable incomes, particularly in emerging economies like India and China, enhance purchasing power and increase consumer spending on health and wellness products. Government initiatives promoting healthy lifestyles and food safety regulations also indirectly support market expansion.
Challenges in the APAC Protein Bar Market Sector
The APAC protein bar market faces several challenges. Fluctuations in raw material prices can impact production costs and profit margins. Stringent regulatory requirements regarding food labeling and health claims present compliance challenges. Intense competition from both established multinational corporations and emerging local brands necessitates continuous innovation and strategic marketing to maintain market share. Supply chain disruptions and logistical complexities can affect product availability and distribution efficiency, limiting market reach. These challenges need to be effectively managed to maintain sustainable growth.
Emerging Opportunities in APAC Protein Bar Market
The APAC protein bar market presents several emerging opportunities. The growing demand for specialized protein bars catering to specific dietary needs (e.g., vegan, ketogenic, diabetic-friendly) presents a significant opportunity for innovation and product diversification. Expanding into less-penetrated markets within the APAC region, particularly rural areas with rising disposable incomes, offers vast potential for growth. The increasing popularity of online retail channels presents opportunities to enhance distribution reach and target specific consumer segments through digital marketing and e-commerce platforms. Innovative product formats and packaging solutions can further attract consumers and enhance market appeal.
Leading Players in the APAC Protein Bar Market Market
- The Kellogg Company
- The Nature's Bounty Co
- General Mills Inc
- PepsiCo Inc
- Naturell India Pvt Ltd
- Yogabars
- Clif Bar & Company
- MuscleBlaze
- Quest Nutrition LLC
Key Developments in APAC Protein Bar Market Industry
- January 2023: Launch of a new line of organic protein bars by a major player in the Australian market.
- June 2022: Acquisition of a smaller protein bar company by a larger multinational corporation in India.
- November 2021: Introduction of a new vegan protein bar by a leading brand in China.
Strategic Outlook for APAC Protein Bar Market Market
The APAC protein bar market is poised for continued growth, driven by strong consumer demand, evolving consumer preferences, and the expansion of the health and wellness sector. Opportunities exist in innovation, expansion into new markets, and leveraging online channels. Companies that strategically focus on product diversification, sustainable sourcing, and efficient distribution will be well-positioned to capture significant market share and capitalize on the considerable growth potential within this dynamic market. The market is anticipated to reach xx Million by 2033, signifying a substantial increase compared to its 2025 valuation.
APAC Protein Bar Market Segmentation
-
1. Distribution Channel
- 1.1. Supermarkets/Hypermarkets
- 1.2. Convenience Stores
- 1.3. Specialty Stores
- 1.4. Online Stores
- 1.5. Other Distribution Channels
APAC Protein Bar Market Segmentation By Geography
-
1. North America
- 1.1. United States
- 1.2. Canada
- 1.3. Mexico
-
2. South America
- 2.1. Brazil
- 2.2. Argentina
- 2.3. Rest of South America
-
3. Europe
- 3.1. United Kingdom
- 3.2. Germany
- 3.3. France
- 3.4. Italy
- 3.5. Spain
- 3.6. Russia
- 3.7. Benelux
- 3.8. Nordics
- 3.9. Rest of Europe
-
4. Middle East & Africa
- 4.1. Turkey
- 4.2. Israel
- 4.3. GCC
- 4.4. North Africa
- 4.5. South Africa
- 4.6. Rest of Middle East & Africa
-
5. Asia Pacific
- 5.1. China
- 5.2. India
- 5.3. Japan
- 5.4. South Korea
- 5.5. ASEAN
- 5.6. Oceania
- 5.7. Rest of Asia Pacific
APAC Protein Bar Market REPORT HIGHLIGHTS
| Aspects | Details |
|---|---|
| Study Period | 2019-2033 |
| Base Year | 2024 |
| Estimated Year | 2025 |
| Forecast Period | 2025-2033 |
| Historical Period | 2019-2024 |
| Growth Rate | CAGR of 3.80% from 2019-2033 |
| Segmentation |
|
Table of Contents
- 1. Introduction
- 1.1. Research Scope
- 1.2. Market Segmentation
- 1.3. Research Methodology
- 1.4. Definitions and Assumptions
- 2. Executive Summary
- 2.1. Introduction
- 3. Market Dynamics
- 3.1. Introduction
- 3.2. Market Drivers
- 3.2.1. Rising Demand for Convenient Foods Drives the Market; Growing Demand for Fortified Snack Food Supports the Market
- 3.3. Market Restrains
- 3.3.1 Unorganized Snack Sector
- 3.3.2 Coupled With Marketing And Distribution Challenges
- 3.4. Market Trends
- 3.4.1. Online Retail Stores to Drive the Regional Market Sales
- 4. Market Factor Analysis
- 4.1. Porters Five Forces
- 4.2. Supply/Value Chain
- 4.3. PESTEL analysis
- 4.4. Market Entropy
- 4.5. Patent/Trademark Analysis
- 5. Global APAC Protein Bar Market Analysis, Insights and Forecast, 2019-2031
- 5.1. Market Analysis, Insights and Forecast - by Distribution Channel
- 5.1.1. Supermarkets/Hypermarkets
- 5.1.2. Convenience Stores
- 5.1.3. Specialty Stores
- 5.1.4. Online Stores
- 5.1.5. Other Distribution Channels
- 5.2. Market Analysis, Insights and Forecast - by Region
- 5.2.1. North America
- 5.2.2. South America
- 5.2.3. Europe
- 5.2.4. Middle East & Africa
- 5.2.5. Asia Pacific
- 5.1. Market Analysis, Insights and Forecast - by Distribution Channel
- 6. North America APAC Protein Bar Market Analysis, Insights and Forecast, 2019-2031
- 6.1. Market Analysis, Insights and Forecast - by Distribution Channel
- 6.1.1. Supermarkets/Hypermarkets
- 6.1.2. Convenience Stores
- 6.1.3. Specialty Stores
- 6.1.4. Online Stores
- 6.1.5. Other Distribution Channels
- 6.1. Market Analysis, Insights and Forecast - by Distribution Channel
- 7. South America APAC Protein Bar Market Analysis, Insights and Forecast, 2019-2031
- 7.1. Market Analysis, Insights and Forecast - by Distribution Channel
- 7.1.1. Supermarkets/Hypermarkets
- 7.1.2. Convenience Stores
- 7.1.3. Specialty Stores
- 7.1.4. Online Stores
- 7.1.5. Other Distribution Channels
- 7.1. Market Analysis, Insights and Forecast - by Distribution Channel
- 8. Europe APAC Protein Bar Market Analysis, Insights and Forecast, 2019-2031
- 8.1. Market Analysis, Insights and Forecast - by Distribution Channel
- 8.1.1. Supermarkets/Hypermarkets
- 8.1.2. Convenience Stores
- 8.1.3. Specialty Stores
- 8.1.4. Online Stores
- 8.1.5. Other Distribution Channels
- 8.1. Market Analysis, Insights and Forecast - by Distribution Channel
- 9. Middle East & Africa APAC Protein Bar Market Analysis, Insights and Forecast, 2019-2031
- 9.1. Market Analysis, Insights and Forecast - by Distribution Channel
- 9.1.1. Supermarkets/Hypermarkets
- 9.1.2. Convenience Stores
- 9.1.3. Specialty Stores
- 9.1.4. Online Stores
- 9.1.5. Other Distribution Channels
- 9.1. Market Analysis, Insights and Forecast - by Distribution Channel
- 10. Asia Pacific APAC Protein Bar Market Analysis, Insights and Forecast, 2019-2031
- 10.1. Market Analysis, Insights and Forecast - by Distribution Channel
- 10.1.1. Supermarkets/Hypermarkets
- 10.1.2. Convenience Stores
- 10.1.3. Specialty Stores
- 10.1.4. Online Stores
- 10.1.5. Other Distribution Channels
- 10.1. Market Analysis, Insights and Forecast - by Distribution Channel
- 11. North America APAC Protein Bar Market Analysis, Insights and Forecast, 2019-2031
- 11.1. Market Analysis, Insights and Forecast - By Country/Sub-region
- 11.1.1 United States
- 11.1.2 Canada
- 11.1.3 Mexico
- 11.1.4 Rest of North America
- 12. Europe APAC Protein Bar Market Analysis, Insights and Forecast, 2019-2031
- 12.1. Market Analysis, Insights and Forecast - By Country/Sub-region
- 12.1.1 Spain
- 12.1.2 United Kingdom
- 12.1.3 Germany
- 12.1.4 France
- 12.1.5 Italy
- 12.1.6 Russia
- 12.1.7 Rest of Europe
- 13. Asia Pacific APAC Protein Bar Market Analysis, Insights and Forecast, 2019-2031
- 13.1. Market Analysis, Insights and Forecast - By Country/Sub-region
- 13.1.1 China
- 13.1.2 Japan
- 13.1.3 India
- 13.1.4 Australia
- 13.1.5 Rest of Asia Pacific
- 14. South America APAC Protein Bar Market Analysis, Insights and Forecast, 2019-2031
- 14.1. Market Analysis, Insights and Forecast - By Country/Sub-region
- 14.1.1 Brazil
- 14.1.2 Argentina
- 14.1.3 Rest of South America
- 15. Middle East and Africa APAC Protein Bar Market Analysis, Insights and Forecast, 2019-2031
- 15.1. Market Analysis, Insights and Forecast - By Country/Sub-region
- 15.1.1 South Africa
- 15.1.2 Saudi Arabia
- 15.1.3 Rest of Middle East and Africa
- 16. Competitive Analysis
- 16.1. Global Market Share Analysis 2024
- 16.2. Company Profiles
- 16.2.1 The Kellogg Company
- 16.2.1.1. Overview
- 16.2.1.2. Products
- 16.2.1.3. SWOT Analysis
- 16.2.1.4. Recent Developments
- 16.2.1.5. Financials (Based on Availability)
- 16.2.2 The Nature's Bounty Co *List Not Exhaustive
- 16.2.2.1. Overview
- 16.2.2.2. Products
- 16.2.2.3. SWOT Analysis
- 16.2.2.4. Recent Developments
- 16.2.2.5. Financials (Based on Availability)
- 16.2.3 General Mills Inc
- 16.2.3.1. Overview
- 16.2.3.2. Products
- 16.2.3.3. SWOT Analysis
- 16.2.3.4. Recent Developments
- 16.2.3.5. Financials (Based on Availability)
- 16.2.4 PepsiCo Inc
- 16.2.4.1. Overview
- 16.2.4.2. Products
- 16.2.4.3. SWOT Analysis
- 16.2.4.4. Recent Developments
- 16.2.4.5. Financials (Based on Availability)
- 16.2.5 Naturell India Pvt Ltd
- 16.2.5.1. Overview
- 16.2.5.2. Products
- 16.2.5.3. SWOT Analysis
- 16.2.5.4. Recent Developments
- 16.2.5.5. Financials (Based on Availability)
- 16.2.6 Yogabars
- 16.2.6.1. Overview
- 16.2.6.2. Products
- 16.2.6.3. SWOT Analysis
- 16.2.6.4. Recent Developments
- 16.2.6.5. Financials (Based on Availability)
- 16.2.7 Clif Bar & Company
- 16.2.7.1. Overview
- 16.2.7.2. Products
- 16.2.7.3. SWOT Analysis
- 16.2.7.4. Recent Developments
- 16.2.7.5. Financials (Based on Availability)
- 16.2.8 MuscleBlaze
- 16.2.8.1. Overview
- 16.2.8.2. Products
- 16.2.8.3. SWOT Analysis
- 16.2.8.4. Recent Developments
- 16.2.8.5. Financials (Based on Availability)
- 16.2.9 Quest Nutrition LLC
- 16.2.9.1. Overview
- 16.2.9.2. Products
- 16.2.9.3. SWOT Analysis
- 16.2.9.4. Recent Developments
- 16.2.9.5. Financials (Based on Availability)
- 16.2.1 The Kellogg Company
List of Figures
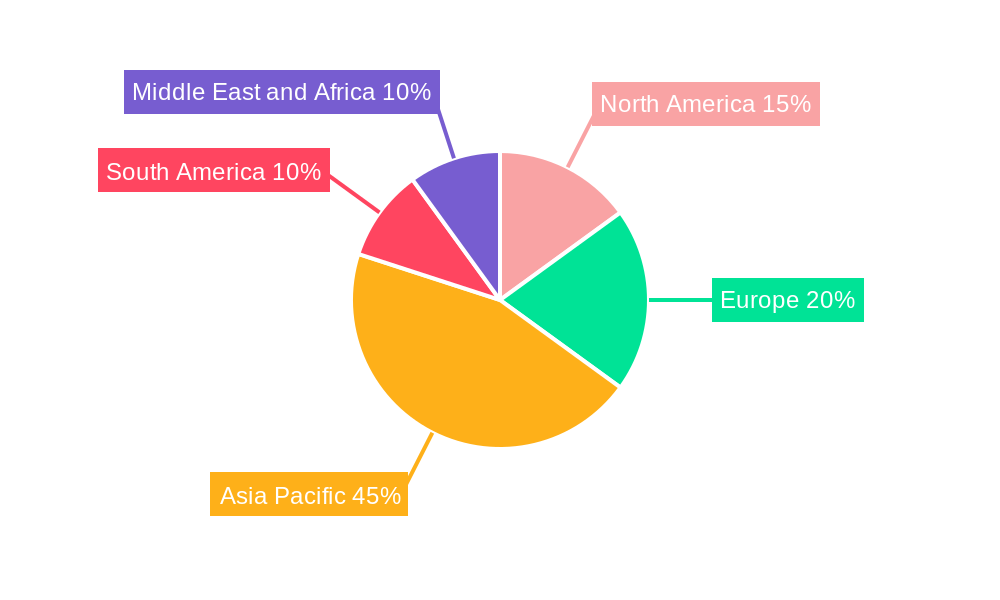
- Figure 1: Global APAC Protein Bar Market Revenue Breakdown (Million, %) by Region 2024 & 2032
- Figure 2: North America APAC Protein Bar Market Revenue (Million), by Country 2024 & 2032
- Figure 3: North America APAC Protein Bar Market Revenue Share (%), by Country 2024 & 2032
- Figure 4: Europe APAC Protein Bar Market Revenue (Million), by Country 2024 & 2032
- Figure 5: Europe APAC Protein Bar Market Revenue Share (%), by Country 2024 & 2032
- Figure 6: Asia Pacific APAC Protein Bar Market Revenue (Million), by Country 2024 & 2032
- Figure 7: Asia Pacific APAC Protein Bar Market Revenue Share (%), by Country 2024 & 2032
- Figure 8: South America APAC Protein Bar Market Revenue (Million), by Country 2024 & 2032
- Figure 9: South America APAC Protein Bar Market Revenue Share (%), by Country 2024 & 2032
- Figure 10: Middle East and Africa APAC Protein Bar Market Revenue (Million), by Country 2024 & 2032
- Figure 11: Middle East and Africa APAC Protein Bar Market Revenue Share (%), by Country 2024 & 2032
- Figure 12: North America APAC Protein Bar Market Revenue (Million), by Distribution Channel 2024 & 2032
- Figure 13: North America APAC Protein Bar Market Revenue Share (%), by Distribution Channel 2024 & 2032
- Figure 14: North America APAC Protein Bar Market Revenue (Million), by Country 2024 & 2032
- Figure 15: North America APAC Protein Bar Market Revenue Share (%), by Country 2024 & 2032
- Figure 16: South America APAC Protein Bar Market Revenue (Million), by Distribution Channel 2024 & 2032
- Figure 17: South America APAC Protein Bar Market Revenue Share (%), by Distribution Channel 2024 & 2032
- Figure 18: South America APAC Protein Bar Market Revenue (Million), by Country 2024 & 2032
- Figure 19: South America APAC Protein Bar Market Revenue Share (%), by Country 2024 & 2032
- Figure 20: Europe APAC Protein Bar Market Revenue (Million), by Distribution Channel 2024 & 2032
- Figure 21: Europe APAC Protein Bar Market Revenue Share (%), by Distribution Channel 2024 & 2032
- Figure 22: Europe APAC Protein Bar Market Revenue (Million), by Country 2024 & 2032
- Figure 23: Europe APAC Protein Bar Market Revenue Share (%), by Country 2024 & 2032
- Figure 24: Middle East & Africa APAC Protein Bar Market Revenue (Million), by Distribution Channel 2024 & 2032
- Figure 25: Middle East & Africa APAC Protein Bar Market Revenue Share (%), by Distribution Channel 2024 & 2032
- Figure 26: Middle East & Africa APAC Protein Bar Market Revenue (Million), by Country 2024 & 2032
- Figure 27: Middle East & Africa APAC Protein Bar Market Revenue Share (%), by Country 2024 & 2032
- Figure 28: Asia Pacific APAC Protein Bar Market Revenue (Million), by Distribution Channel 2024 & 2032
- Figure 29: Asia Pacific APAC Protein Bar Market Revenue Share (%), by Distribution Channel 2024 & 2032
- Figure 30: Asia Pacific APAC Protein Bar Market Revenue (Million), by Country 2024 & 2032
- Figure 31: Asia Pacific APAC Protein Bar Market Revenue Share (%), by Country 2024 & 2032
List of Tables
- Table 1: Global APAC Protein Bar Market Revenue Million Forecast, by Region 2019 & 2032
- Table 2: Global APAC Protein Bar Market Revenue Million Forecast, by Distribution Channel 2019 & 2032
- Table 3: Global APAC Protein Bar Market Revenue Million Forecast, by Region 2019 & 2032
- Table 4: Global APAC Protein Bar Market Revenue Million Forecast, by Country 2019 & 2032
- Table 5: United States APAC Protein Bar Market Revenue (Million) Forecast, by Application 2019 & 2032
- Table 6: Canada APAC Protein Bar Market Revenue (Million) Forecast, by Application 2019 & 2032
- Table 7: Mexico APAC Protein Bar Market Revenue (Million) Forecast, by Application 2019 & 2032
- Table 8: Rest of North America APAC Protein Bar Market Revenue (Million) Forecast, by Application 2019 & 2032
- Table 9: Global APAC Protein Bar Market Revenue Million Forecast, by Country 2019 & 2032
- Table 10: Spain APAC Protein Bar Market Revenue (Million) Forecast, by Application 2019 & 2032
- Table 11: United Kingdom APAC Protein Bar Market Revenue (Million) Forecast, by Application 2019 & 2032
- Table 12: Germany APAC Protein Bar Market Revenue (Million) Forecast, by Application 2019 & 2032
- Table 13: France APAC Protein Bar Market Revenue (Million) Forecast, by Application 2019 & 2032
- Table 14: Italy APAC Protein Bar Market Revenue (Million) Forecast, by Application 2019 & 2032
- Table 15: Russia APAC Protein Bar Market Revenue (Million) Forecast, by Application 2019 & 2032
- Table 16: Rest of Europe APAC Protein Bar Market Revenue (Million) Forecast, by Application 2019 & 2032
- Table 17: Global APAC Protein Bar Market Revenue Million Forecast, by Country 2019 & 2032
- Table 18: China APAC Protein Bar Market Revenue (Million) Forecast, by Application 2019 & 2032
- Table 19: Japan APAC Protein Bar Market Revenue (Million) Forecast, by Application 2019 & 2032
- Table 20: India APAC Protein Bar Market Revenue (Million) Forecast, by Application 2019 & 2032
- Table 21: Australia APAC Protein Bar Market Revenue (Million) Forecast, by Application 2019 & 2032
- Table 22: Rest of Asia Pacific APAC Protein Bar Market Revenue (Million) Forecast, by Application 2019 & 2032
- Table 23: Global APAC Protein Bar Market Revenue Million Forecast, by Country 2019 & 2032
- Table 24: Brazil APAC Protein Bar Market Revenue (Million) Forecast, by Application 2019 & 2032
- Table 25: Argentina APAC Protein Bar Market Revenue (Million) Forecast, by Application 2019 & 2032
- Table 26: Rest of South America APAC Protein Bar Market Revenue (Million) Forecast, by Application 2019 & 2032
- Table 27: Global APAC Protein Bar Market Revenue Million Forecast, by Country 2019 & 2032
- Table 28: South Africa APAC Protein Bar Market Revenue (Million) Forecast, by Application 2019 & 2032
- Table 29: Saudi Arabia APAC Protein Bar Market Revenue (Million) Forecast, by Application 2019 & 2032
- Table 30: Rest of Middle East and Africa APAC Protein Bar Market Revenue (Million) Forecast, by Application 2019 & 2032
- Table 31: Global APAC Protein Bar Market Revenue Million Forecast, by Distribution Channel 2019 & 2032
- Table 32: Global APAC Protein Bar Market Revenue Million Forecast, by Country 2019 & 2032
- Table 33: United States APAC Protein Bar Market Revenue (Million) Forecast, by Application 2019 & 2032
- Table 34: Canada APAC Protein Bar Market Revenue (Million) Forecast, by Application 2019 & 2032
- Table 35: Mexico APAC Protein Bar Market Revenue (Million) Forecast, by Application 2019 & 2032
- Table 36: Global APAC Protein Bar Market Revenue Million Forecast, by Distribution Channel 2019 & 2032
- Table 37: Global APAC Protein Bar Market Revenue Million Forecast, by Country 2019 & 2032
- Table 38: Brazil APAC Protein Bar Market Revenue (Million) Forecast, by Application 2019 & 2032
- Table 39: Argentina APAC Protein Bar Market Revenue (Million) Forecast, by Application 2019 & 2032
- Table 40: Rest of South America APAC Protein Bar Market Revenue (Million) Forecast, by Application 2019 & 2032
- Table 41: Global APAC Protein Bar Market Revenue Million Forecast, by Distribution Channel 2019 & 2032
- Table 42: Global APAC Protein Bar Market Revenue Million Forecast, by Country 2019 & 2032
- Table 43: United Kingdom APAC Protein Bar Market Revenue (Million) Forecast, by Application 2019 & 2032
- Table 44: Germany APAC Protein Bar Market Revenue (Million) Forecast, by Application 2019 & 2032
- Table 45: France APAC Protein Bar Market Revenue (Million) Forecast, by Application 2019 & 2032
- Table 46: Italy APAC Protein Bar Market Revenue (Million) Forecast, by Application 2019 & 2032
- Table 47: Spain APAC Protein Bar Market Revenue (Million) Forecast, by Application 2019 & 2032
- Table 48: Russia APAC Protein Bar Market Revenue (Million) Forecast, by Application 2019 & 2032
- Table 49: Benelux APAC Protein Bar Market Revenue (Million) Forecast, by Application 2019 & 2032
- Table 50: Nordics APAC Protein Bar Market Revenue (Million) Forecast, by Application 2019 & 2032
- Table 51: Rest of Europe APAC Protein Bar Market Revenue (Million) Forecast, by Application 2019 & 2032
- Table 52: Global APAC Protein Bar Market Revenue Million Forecast, by Distribution Channel 2019 & 2032
- Table 53: Global APAC Protein Bar Market Revenue Million Forecast, by Country 2019 & 2032
- Table 54: Turkey APAC Protein Bar Market Revenue (Million) Forecast, by Application 2019 & 2032
- Table 55: Israel APAC Protein Bar Market Revenue (Million) Forecast, by Application 2019 & 2032
- Table 56: GCC APAC Protein Bar Market Revenue (Million) Forecast, by Application 2019 & 2032
- Table 57: North Africa APAC Protein Bar Market Revenue (Million) Forecast, by Application 2019 & 2032
- Table 58: South Africa APAC Protein Bar Market Revenue (Million) Forecast, by Application 2019 & 2032
- Table 59: Rest of Middle East & Africa APAC Protein Bar Market Revenue (Million) Forecast, by Application 2019 & 2032
- Table 60: Global APAC Protein Bar Market Revenue Million Forecast, by Distribution Channel 2019 & 2032
- Table 61: Global APAC Protein Bar Market Revenue Million Forecast, by Country 2019 & 2032
- Table 62: China APAC Protein Bar Market Revenue (Million) Forecast, by Application 2019 & 2032
- Table 63: India APAC Protein Bar Market Revenue (Million) Forecast, by Application 2019 & 2032
- Table 64: Japan APAC Protein Bar Market Revenue (Million) Forecast, by Application 2019 & 2032
- Table 65: South Korea APAC Protein Bar Market Revenue (Million) Forecast, by Application 2019 & 2032
- Table 66: ASEAN APAC Protein Bar Market Revenue (Million) Forecast, by Application 2019 & 2032
- Table 67: Oceania APAC Protein Bar Market Revenue (Million) Forecast, by Application 2019 & 2032
- Table 68: Rest of Asia Pacific APAC Protein Bar Market Revenue (Million) Forecast, by Application 2019 & 2032
Frequently Asked Questions
1. What is the projected Compound Annual Growth Rate (CAGR) of the APAC Protein Bar Market?
The projected CAGR is approximately 3.80%.
2. Which companies are prominent players in the APAC Protein Bar Market?
Key companies in the market include The Kellogg Company, The Nature's Bounty Co *List Not Exhaustive, General Mills Inc, PepsiCo Inc, Naturell India Pvt Ltd, Yogabars, Clif Bar & Company, MuscleBlaze, Quest Nutrition LLC.
3. What are the main segments of the APAC Protein Bar Market?
The market segments include Distribution Channel.
4. Can you provide details about the market size?
The market size is estimated to be USD XX Million as of 2022.
5. What are some drivers contributing to market growth?
Rising Demand for Convenient Foods Drives the Market; Growing Demand for Fortified Snack Food Supports the Market.
6. What are the notable trends driving market growth?
Online Retail Stores to Drive the Regional Market Sales.
7. Are there any restraints impacting market growth?
Unorganized Snack Sector. Coupled With Marketing And Distribution Challenges.
8. Can you provide examples of recent developments in the market?
N/A
9. What pricing options are available for accessing the report?
Pricing options include single-user, multi-user, and enterprise licenses priced at USD 4750, USD 4950, and USD 6800 respectively.
10. Is the market size provided in terms of value or volume?
The market size is provided in terms of value, measured in Million.
11. Are there any specific market keywords associated with the report?
Yes, the market keyword associated with the report is "APAC Protein Bar Market," which aids in identifying and referencing the specific market segment covered.
12. How do I determine which pricing option suits my needs best?
The pricing options vary based on user requirements and access needs. Individual users may opt for single-user licenses, while businesses requiring broader access may choose multi-user or enterprise licenses for cost-effective access to the report.
13. Are there any additional resources or data provided in the APAC Protein Bar Market report?
While the report offers comprehensive insights, it's advisable to review the specific contents or supplementary materials provided to ascertain if additional resources or data are available.
14. How can I stay updated on further developments or reports in the APAC Protein Bar Market?
To stay informed about further developments, trends, and reports in the APAC Protein Bar Market, consider subscribing to industry newsletters, following relevant companies and organizations, or regularly checking reputable industry news sources and publications.
Methodology
Step 1 - Identification of Relevant Samples Size from Population Database


Step 2 - Approaches for Defining Global Market Size (Value, Volume* & Price*)

Note*: In applicable scenarios
Step 3 - Data Sources
Primary Research
- Web Analytics
- Survey Reports
- Research Institute
- Latest Research Reports
- Opinion Leaders
Secondary Research
- Annual Reports
- White Paper
- Latest Press Release
- Industry Association
- Paid Database
- Investor Presentations

Step 4 - Data Triangulation
Involves using different sources of information in order to increase the validity of a study
These sources are likely to be stakeholders in a program - participants, other researchers, program staff, other community members, and so on.
Then we put all data in single framework & apply various statistical tools to find out the dynamic on the market.
During the analysis stage, feedback from the stakeholder groups would be compared to determine areas of agreement as well as areas of divergence


