

Key Insights
The Asia-Pacific (APAC) sanitary ware market is poised for substantial expansion, driven by accelerating urbanization, escalating disposable incomes, and heightened awareness of hygiene and sanitation standards. The region's growing middle class is a primary catalyst, increasing demand for premium and aesthetically appealing bathroom fixtures. Government-led initiatives focused on affordable housing and infrastructure development across APAC further bolster market growth. The market was valued at approximately $32.47 billion in 2024, with a projected Compound Annual Growth Rate (CAGR) of 7.2% from 2025 to 2033.
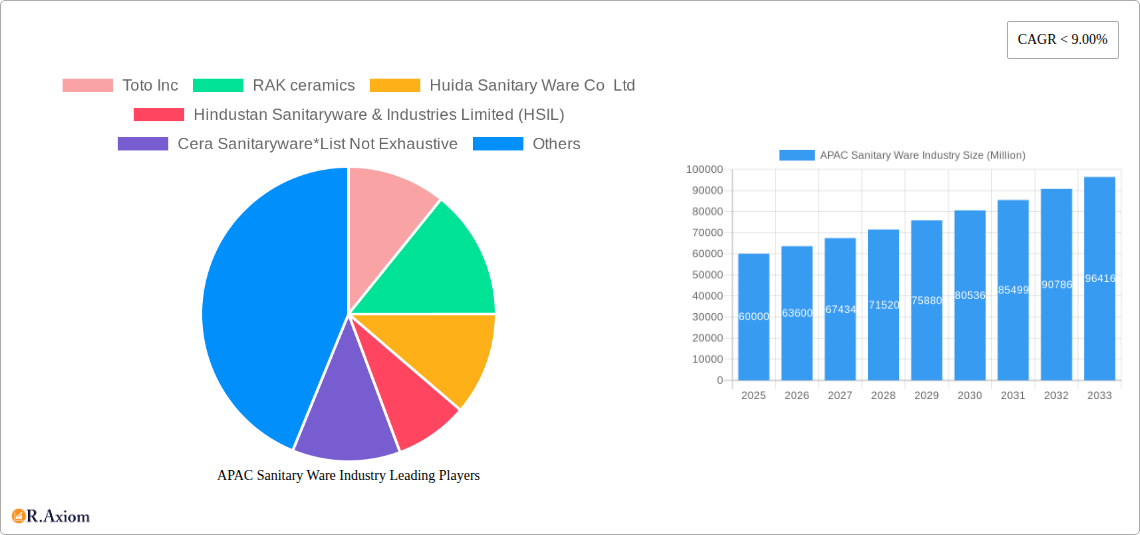
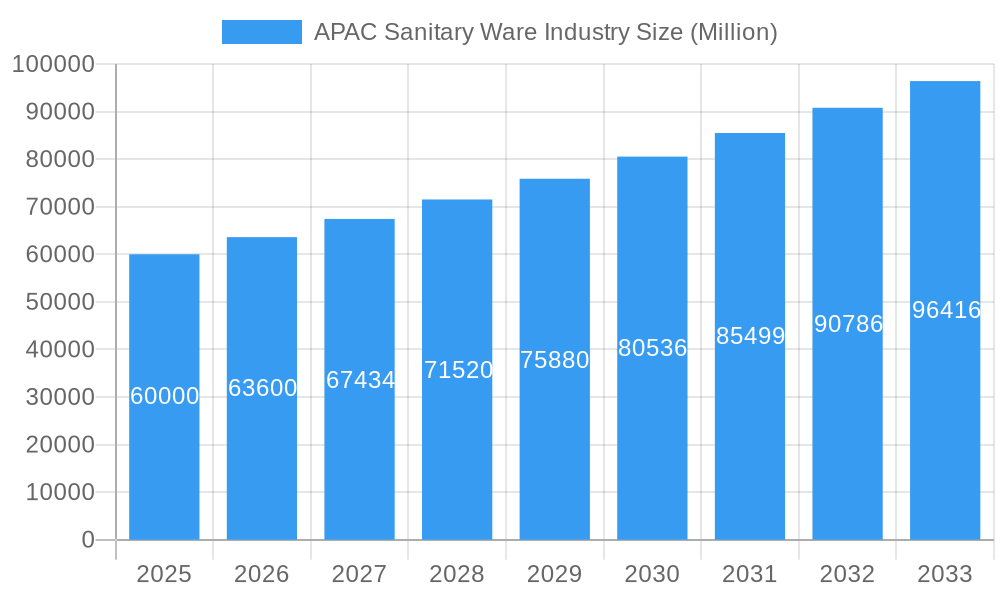
APAC Sanitary Ware Industry Market Size (In Billion)
The forecast period, 2025-2033, anticipates sustained growth fueled by ongoing economic development, technological innovations in sanitary ware (e.g., smart toilets, water-efficient designs), and a rising consumer preference for modern, sustainable solutions. The adoption of eco-friendly and water-saving technologies will be a pivotal driver for industry innovation. Increased competition from both established brands and emerging players will necessitate strategic investments in R&D, robust supply chains, and impactful marketing strategies. The market is granularly segmented by product type (toilets, sinks, faucets), material (ceramic, porcelain), and price tier, enabling precise market penetration and deeper consumer insights.
APAC Sanitary Ware Industry Company Market Share
APAC Sanitary Ware Industry: A Comprehensive Market Report (2019-2033)
This comprehensive report provides an in-depth analysis of the Asia-Pacific (APAC) sanitary ware industry, covering the period from 2019 to 2033. It offers valuable insights into market dynamics, growth drivers, challenges, and future opportunities, enabling stakeholders to make informed strategic decisions. The report meticulously segments the market by country (China, Japan, India, and Others), product type (Ceramic Wash Closets, Ceramic Wash Basins, Ceramic Cisterns, Urinals, and Others), technology (Slip Casting, Tape Casting, Pressure Casting, and Others), and end-user (Residential, Commercial). The analysis includes detailed profiles of key players like Toto Inc, RAK ceramics, Huida Sanitary Ware Co Ltd, Hindustan Sanitaryware & Industries Limited (HSIL), Cera Sanitaryware, Kerovit, Kajaria Ceramics Limited, Lixil, Villeroy Boch Group, Jaquar, Roca (China) Co Ltd, and Kohler (China) Investment Co Ltd, although the list is not exhaustive. The report uses 2025 as the base year and projects market trends up to 2033, offering crucial data for investment and growth strategies. The total market value is projected to reach xx Million by 2033.
APAC Sanitary Ware Industry Market Concentration & Innovation
This section analyzes the market concentration, identifying key players and their market share. We examine innovation drivers, regulatory landscapes, substitute products, end-user trends, and mergers & acquisitions (M&A) activity within the APAC sanitary ware market. The study period (2019-2024) reveals a highly competitive landscape with varying degrees of market concentration across different segments and countries.
- Market Concentration: China dominates the market, accounting for approximately xx% of the total revenue in 2024. The top five players, including Toto Inc, Lixil, and others, collectively hold an estimated xx% market share.
- Innovation Drivers: Sustainability concerns, technological advancements (smart toilets, water-saving technologies), and rising consumer demand for aesthetically pleasing and functional products are driving innovation.
- Regulatory Frameworks: Government regulations regarding water conservation and building codes significantly impact market dynamics. Variations in regulations across APAC countries create opportunities and challenges for manufacturers.
- Product Substitutes: The market faces competition from alternative materials and technologies, influencing pricing and product development strategies.
- End-User Trends: A shift towards premium and smart sanitary ware is observed, particularly in the residential segment. Commercial construction activity also significantly influences demand.
- M&A Activity: Significant M&A activity was recorded during the historical period (2019-2024), with deal values estimated at xx Million, primarily focused on expanding market reach and technological capabilities. Examples of deals include [Insert specific examples if available, otherwise use placeholder].
APAC Sanitary Ware Industry Industry Trends & Insights
This section delves into the key industry trends and insights shaping the APAC sanitary ware market. We analyze market growth drivers, technological disruptions, consumer preferences, and competitive dynamics, providing a comprehensive overview of the market's trajectory.
The APAC sanitary ware market experienced a CAGR of xx% during 2019-2024, driven by rapid urbanization, rising disposable incomes, and increasing awareness of hygiene. Technological advancements like smart toilets with integrated features are gaining traction, leading to premiumization of the market. Consumer preferences are shifting toward sustainable and water-efficient products, compelling manufacturers to adopt eco-friendly manufacturing practices. Intense competition among established players and new entrants is evident, leading to innovative product launches and strategic partnerships. Market penetration of smart sanitary ware remains relatively low but is projected to increase significantly during the forecast period (2025-2033). The rising adoption of online sales channels also significantly influences market dynamics.
Dominant Markets & Segments in APAC Sanitary Ware Industry
This section identifies the dominant regions, countries, and segments within the APAC sanitary ware market. We provide a detailed dominance analysis, highlighting key drivers of growth for each segment.
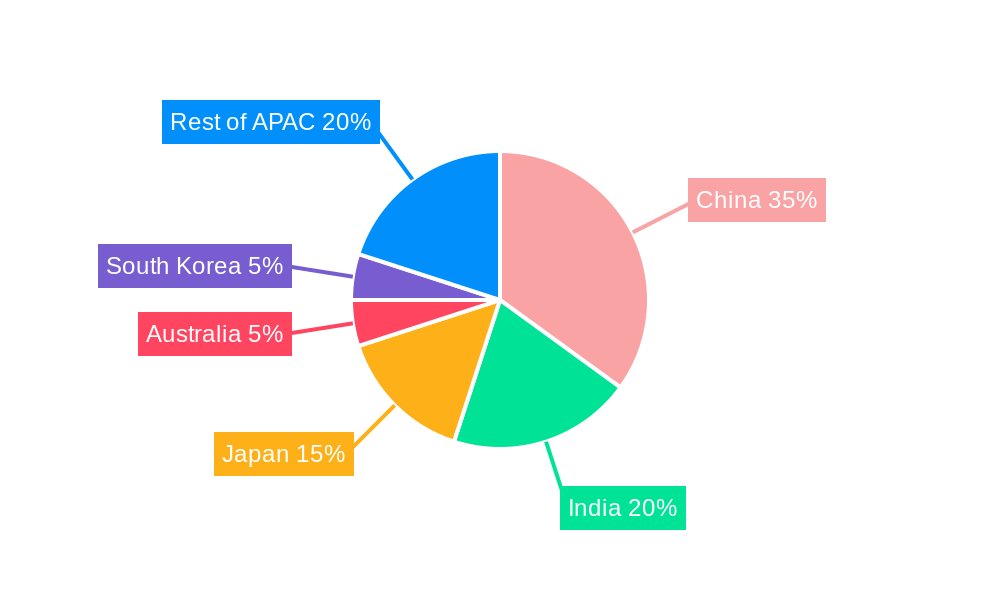
- By Country: China remains the dominant market, driven by robust construction activity and a large population. India is emerging as a significant market, fueled by increasing urbanization and rising middle-class incomes. Japan shows steady growth driven by renovations and technological advancements. Other APAC countries present opportunities for expansion.
- Key Drivers (By Country):
- China: Strong economic growth, large-scale infrastructure projects, and government initiatives promoting urbanization.
- India: Rapid urbanization, rising disposable incomes, and growing awareness of hygiene standards.
- Japan: High levels of disposable income, a focus on renovation projects, and a high adoption rate of advanced technologies.
- By Type: Ceramic wash closets constitute the largest segment, followed by ceramic wash basins. Demand for innovative designs and water-saving features is driving growth across all product types.
- By Technology: Slip casting remains the dominant manufacturing technology, but pressure casting is gaining traction due to its ability to produce complex designs.
- By End User: The residential segment is the largest consumer of sanitary ware, with the commercial sector showing strong growth potential driven by new construction and renovations.
APAC Sanitary Ware Industry Product Developments
The APAC sanitary ware industry is witnessing significant product innovation, focusing on water efficiency, smart features, and improved hygiene. Manufacturers are incorporating technologies such as sensor-based flushing mechanisms, automated cleaning systems, and integrated heating features. These innovations cater to growing consumer preferences for convenience and sustainability, enhancing product appeal and market competitiveness. The integration of smart home technologies is gaining significant momentum, enhancing the functionality and appeal of sanitary ware for both residential and commercial users.
Report Scope & Segmentation Analysis
This report offers a comprehensive market segmentation analysis, providing detailed insights into each segment's growth trajectory and competitive landscape. The market is segmented by country (China, Japan, India, Others), product type (Ceramic Wash Closets, Ceramic Wash Basins, Ceramic Cisterns, Urinals, Others), technology (Slip Casting, Tape Casting, Pressure Casting, Others), and end-user (Residential, Commercial). The analysis includes historical data (2019-2024), base year data (2025), estimated year data (2025), and forecasts for the future (2025-2033). Each segment shows specific growth projections, market size estimations, and analysis of competitive dynamics. For example, the ceramic wash closet segment is expected to exhibit robust growth due to increasing demand from both residential and commercial construction projects, while the smart toilet segment is anticipated to show significant growth, though from a smaller base, due to rising technological advancements and consumer preference shifts.
Key Drivers of APAC Sanitary Ware Industry Growth
Several factors drive the growth of the APAC sanitary ware industry. These include rapid urbanization and infrastructure development, leading to increased demand for new housing and commercial buildings. Rising disposable incomes and changing lifestyles are creating a demand for advanced, higher-quality sanitary ware. Government initiatives and regulations focused on water conservation are promoting the adoption of water-efficient products. Technological advancements continue to improve product features and efficiency, further fueling market growth.
Challenges in the APAC Sanitary Ware Industry Sector
The APAC sanitary ware industry faces certain challenges, including fluctuations in raw material prices, intense competition from both domestic and international players, stringent regulatory compliance requirements, and supply chain disruptions. These factors can impact profitability and overall market growth. For example, raw material price increases of xx% in 2022 impacted profit margins across the industry, with smaller manufacturers being more acutely affected.
Emerging Opportunities in APAP Sanitary Ware Industry
Despite challenges, the APAC sanitary ware industry presents significant growth opportunities. The rising adoption of smart home technologies presents an avenue for expansion, as does increased demand for sustainable and eco-friendly products. Expanding into rural markets and untapped segments offers significant growth potential. The increasing popularity of modular and prefabricated construction methods provides an opportunity to tailor products and services to this segment.
Leading Players in the APAC Sanitary Ware Industry Market
- Toto Inc
- RAK ceramics
- Huida Sanitary Ware Co Ltd
- Hindustan Sanitaryware & Industries Limited (HSIL)
- Cera Sanitaryware
- Kerovit
- Kajaria Ceramics Limited
- Lixil
- Villeroy Boch Group
- Jaquar
- Roca (China) Co Ltd
- Kohler (China) Investment Co Ltd
Key Developments in APAC Sanitary Ware Industry Industry
- 2022 Q4: Lixil launched a new line of water-efficient toilets in the Chinese market.
- 2023 Q1: Toto Inc announced a strategic partnership with a local manufacturer in India to expand its market reach.
- 2023 Q2: Increased investment in R&D by several companies, focusing on sustainable and smart technologies. [Add further developments with specific dates and details as available]
Strategic Outlook for APAC Sanitary Ware Industry Market
The APAC sanitary ware market is poised for significant growth over the forecast period (2025-2033). Continued urbanization, rising disposable incomes, and technological advancements will fuel demand for innovative and high-quality products. Companies focusing on sustainability, smart technologies, and efficient supply chain management are best positioned for success. The market's growth trajectory is projected to be particularly strong in India and other rapidly developing economies, making this a highly attractive investment opportunity.
APAC Sanitary Ware Industry Segmentation
- 1. Production Analysis
- 2. Consumption Analysis
- 3. Import Market Analysis (Value & Volume)
- 4. Export Market Analysis (Value & Volume)
- 5. Price Trend Analysis
APAC Sanitary Ware Industry Segmentation By Geography
-
1. North America
- 1.1. United States
- 1.2. Canada
- 1.3. Mexico
-
2. South America
- 2.1. Brazil
- 2.2. Argentina
- 2.3. Rest of South America
-
3. Europe
- 3.1. United Kingdom
- 3.2. Germany
- 3.3. France
- 3.4. Italy
- 3.5. Spain
- 3.6. Russia
- 3.7. Benelux
- 3.8. Nordics
- 3.9. Rest of Europe
-
4. Middle East & Africa
- 4.1. Turkey
- 4.2. Israel
- 4.3. GCC
- 4.4. North Africa
- 4.5. South Africa
- 4.6. Rest of Middle East & Africa
-
5. Asia Pacific
- 5.1. China
- 5.2. India
- 5.3. Japan
- 5.4. South Korea
- 5.5. ASEAN
- 5.6. Oceania
- 5.7. Rest of Asia Pacific
APAC Sanitary Ware Industry Regional Market Share
Geographic Coverage of APAC Sanitary Ware Industry
APAC Sanitary Ware Industry REPORT HIGHLIGHTS
| Aspects | Details |
|---|---|
| Study Period | 2020-2034 |
| Base Year | 2025 |
| Estimated Year | 2026 |
| Forecast Period | 2026-2034 |
| Historical Period | 2020-2025 |
| Growth Rate | CAGR of 7.2% from 2020-2034 |
| Segmentation |
|
Table of Contents
- 1. Introduction
- 1.1. Research Scope
- 1.2. Market Segmentation
- 1.3. Research Objective
- 1.4. Definitions and Assumptions
- 2. Executive Summary
- 2.1. Market Snapshot
- 3. Market Dynamics
- 3.1. Market Drivers
- 3.2. Market Restrains
- 3.3. Market Trends
- 3.4. Market Opportunities
- 4. Market Factor Analysis
- 4.1. Porters Five Forces
- 4.1.1. Bargaining Power of Suppliers
- 4.1.2. Bargaining Power of Buyers
- 4.1.3. Threat of New Entrants
- 4.1.4. Threat of Substitutes
- 4.1.5. Competitive Rivalry
- 4.2. PESTEL analysis
- 4.3. BCG Analysis
- 4.3.1. Stars (High Growth, High Market Share)
- 4.3.2. Cash Cows (Low Growth, High Market Share)
- 4.3.3. Question Mark (High Growth, Low Market Share)
- 4.3.4. Dogs (Low Growth, Low Market Share)
- 4.4. Ansoff Matrix Analysis
- 4.5. Supply Chain Analysis
- 4.6. Regulatory Landscape
- 4.7. Current Market Potential and Opportunity Assessment (TAM–SAM–SOM Framework)
- 4.8. RAX Analyst Note
- 4.1. Porters Five Forces
- 5. Market Analysis, Insights and Forecast 2021-2033
- 5.1. Market Analysis, Insights and Forecast - by Production Analysis
- 5.2. Market Analysis, Insights and Forecast - by Consumption Analysis
- 5.3. Market Analysis, Insights and Forecast - by Import Market Analysis (Value & Volume)
- 5.4. Market Analysis, Insights and Forecast - by Export Market Analysis (Value & Volume)
- 5.5. Market Analysis, Insights and Forecast - by Price Trend Analysis
- 5.6. Market Analysis, Insights and Forecast - by Region
- 5.6.1. North America
- 5.6.2. South America
- 5.6.3. Europe
- 5.6.4. Middle East & Africa
- 5.6.5. Asia Pacific
- 6. Global APAC Sanitary Ware Industry Analysis, Insights and Forecast, 2021-2033
- 6.1. Market Analysis, Insights and Forecast - by Production Analysis
- 6.2. Market Analysis, Insights and Forecast - by Consumption Analysis
- 6.3. Market Analysis, Insights and Forecast - by Import Market Analysis (Value & Volume)
- 6.4. Market Analysis, Insights and Forecast - by Export Market Analysis (Value & Volume)
- 6.5. Market Analysis, Insights and Forecast - by Price Trend Analysis
- 7. North America APAC Sanitary Ware Industry Analysis, Insights and Forecast, 2020-2032
- 7.1. Market Analysis, Insights and Forecast - by Production Analysis
- 7.2. Market Analysis, Insights and Forecast - by Consumption Analysis
- 7.3. Market Analysis, Insights and Forecast - by Import Market Analysis (Value & Volume)
- 7.4. Market Analysis, Insights and Forecast - by Export Market Analysis (Value & Volume)
- 7.5. Market Analysis, Insights and Forecast - by Price Trend Analysis
- 8. South America APAC Sanitary Ware Industry Analysis, Insights and Forecast, 2020-2032
- 8.1. Market Analysis, Insights and Forecast - by Production Analysis
- 8.2. Market Analysis, Insights and Forecast - by Consumption Analysis
- 8.3. Market Analysis, Insights and Forecast - by Import Market Analysis (Value & Volume)
- 8.4. Market Analysis, Insights and Forecast - by Export Market Analysis (Value & Volume)
- 8.5. Market Analysis, Insights and Forecast - by Price Trend Analysis
- 9. Europe APAC Sanitary Ware Industry Analysis, Insights and Forecast, 2020-2032
- 9.1. Market Analysis, Insights and Forecast - by Production Analysis
- 9.2. Market Analysis, Insights and Forecast - by Consumption Analysis
- 9.3. Market Analysis, Insights and Forecast - by Import Market Analysis (Value & Volume)
- 9.4. Market Analysis, Insights and Forecast - by Export Market Analysis (Value & Volume)
- 9.5. Market Analysis, Insights and Forecast - by Price Trend Analysis
- 10. Middle East & Africa APAC Sanitary Ware Industry Analysis, Insights and Forecast, 2020-2032
- 10.1. Market Analysis, Insights and Forecast - by Production Analysis
- 10.2. Market Analysis, Insights and Forecast - by Consumption Analysis
- 10.3. Market Analysis, Insights and Forecast - by Import Market Analysis (Value & Volume)
- 10.4. Market Analysis, Insights and Forecast - by Export Market Analysis (Value & Volume)
- 10.5. Market Analysis, Insights and Forecast - by Price Trend Analysis
- 11. Asia Pacific APAC Sanitary Ware Industry Analysis, Insights and Forecast, 2020-2032
- 11.1. Market Analysis, Insights and Forecast - by Production Analysis
- 11.2. Market Analysis, Insights and Forecast - by Consumption Analysis
- 11.3. Market Analysis, Insights and Forecast - by Import Market Analysis (Value & Volume)
- 11.4. Market Analysis, Insights and Forecast - by Export Market Analysis (Value & Volume)
- 11.5. Market Analysis, Insights and Forecast - by Price Trend Analysis
- 12. Competitive Analysis
- 12.1. Company Profiles
- 12.1.1 Toto Inc
- 12.1.1.1. Company Overview
- 12.1.1.2. Products
- 12.1.1.3. Company Financials
- 12.1.1.4. SWOT Analysis
- 12.1.2 RAK ceramics
- 12.1.2.1. Company Overview
- 12.1.2.2. Products
- 12.1.2.3. Company Financials
- 12.1.2.4. SWOT Analysis
- 12.1.3 Huida Sanitary Ware Co Ltd
- 12.1.3.1. Company Overview
- 12.1.3.2. Products
- 12.1.3.3. Company Financials
- 12.1.3.4. SWOT Analysis
- 12.1.4 Hindustan Sanitaryware & Industries Limited (HSIL)
- 12.1.4.1. Company Overview
- 12.1.4.2. Products
- 12.1.4.3. Company Financials
- 12.1.4.4. SWOT Analysis
- 12.1.5 Cera Sanitaryware*List Not Exhaustive
- 12.1.5.1. Company Overview
- 12.1.5.2. Products
- 12.1.5.3. Company Financials
- 12.1.5.4. SWOT Analysis
- 12.1.6 Kerovit
- 12.1.6.1. Company Overview
- 12.1.6.2. Products
- 12.1.6.3. Company Financials
- 12.1.6.4. SWOT Analysis
- 12.1.7 Kajaria Ceramics Limited
- 12.1.7.1. Company Overview
- 12.1.7.2. Products
- 12.1.7.3. Company Financials
- 12.1.7.4. SWOT Analysis
- 12.1.8 Lixil
- 12.1.8.1. Company Overview
- 12.1.8.2. Products
- 12.1.8.3. Company Financials
- 12.1.8.4. SWOT Analysis
- 12.1.9 Villeroy Boch Group
- 12.1.9.1. Company Overview
- 12.1.9.2. Products
- 12.1.9.3. Company Financials
- 12.1.9.4. SWOT Analysis
- 12.1.10 Jaquar
- 12.1.10.1. Company Overview
- 12.1.10.2. Products
- 12.1.10.3. Company Financials
- 12.1.10.4. SWOT Analysis
- 12.1.11 Roca (China) Co Ltd
- 12.1.11.1. Company Overview
- 12.1.11.2. Products
- 12.1.11.3. Company Financials
- 12.1.11.4. SWOT Analysis
- 12.1.12 Kohler (China) Investment Co Ltd
- 12.1.12.1. Company Overview
- 12.1.12.2. Products
- 12.1.12.3. Company Financials
- 12.1.12.4. SWOT Analysis
- 12.1.1 Toto Inc
- 12.2. Market Entropy
- 12.2.1 Company's Key Areas Served
- 12.2.2 Recent Developments
- 12.3. Company Market Share Analysis 2025
- 12.3.1 Top 5 Companies Market Share Analysis
- 12.3.2 Top 3 Companies Market Share Analysis
- 12.4. List of Potential Customers
- 13. Research Methodology
List of Figures
- Figure 1: Global APAC Sanitary Ware Industry Revenue Breakdown (billion, %) by Region 2025 & 2033
- Figure 2: North America APAC Sanitary Ware Industry Revenue (billion), by Production Analysis 2025 & 2033
- Figure 3: North America APAC Sanitary Ware Industry Revenue Share (%), by Production Analysis 2025 & 2033
- Figure 4: North America APAC Sanitary Ware Industry Revenue (billion), by Consumption Analysis 2025 & 2033
- Figure 5: North America APAC Sanitary Ware Industry Revenue Share (%), by Consumption Analysis 2025 & 2033
- Figure 6: North America APAC Sanitary Ware Industry Revenue (billion), by Import Market Analysis (Value & Volume) 2025 & 2033
- Figure 7: North America APAC Sanitary Ware Industry Revenue Share (%), by Import Market Analysis (Value & Volume) 2025 & 2033
- Figure 8: North America APAC Sanitary Ware Industry Revenue (billion), by Export Market Analysis (Value & Volume) 2025 & 2033
- Figure 9: North America APAC Sanitary Ware Industry Revenue Share (%), by Export Market Analysis (Value & Volume) 2025 & 2033
- Figure 10: North America APAC Sanitary Ware Industry Revenue (billion), by Price Trend Analysis 2025 & 2033
- Figure 11: North America APAC Sanitary Ware Industry Revenue Share (%), by Price Trend Analysis 2025 & 2033
- Figure 12: North America APAC Sanitary Ware Industry Revenue (billion), by Country 2025 & 2033
- Figure 13: North America APAC Sanitary Ware Industry Revenue Share (%), by Country 2025 & 2033
- Figure 14: South America APAC Sanitary Ware Industry Revenue (billion), by Production Analysis 2025 & 2033
- Figure 15: South America APAC Sanitary Ware Industry Revenue Share (%), by Production Analysis 2025 & 2033
- Figure 16: South America APAC Sanitary Ware Industry Revenue (billion), by Consumption Analysis 2025 & 2033
- Figure 17: South America APAC Sanitary Ware Industry Revenue Share (%), by Consumption Analysis 2025 & 2033
- Figure 18: South America APAC Sanitary Ware Industry Revenue (billion), by Import Market Analysis (Value & Volume) 2025 & 2033
- Figure 19: South America APAC Sanitary Ware Industry Revenue Share (%), by Import Market Analysis (Value & Volume) 2025 & 2033
- Figure 20: South America APAC Sanitary Ware Industry Revenue (billion), by Export Market Analysis (Value & Volume) 2025 & 2033
- Figure 21: South America APAC Sanitary Ware Industry Revenue Share (%), by Export Market Analysis (Value & Volume) 2025 & 2033
- Figure 22: South America APAC Sanitary Ware Industry Revenue (billion), by Price Trend Analysis 2025 & 2033
- Figure 23: South America APAC Sanitary Ware Industry Revenue Share (%), by Price Trend Analysis 2025 & 2033
- Figure 24: South America APAC Sanitary Ware Industry Revenue (billion), by Country 2025 & 2033
- Figure 25: South America APAC Sanitary Ware Industry Revenue Share (%), by Country 2025 & 2033
- Figure 26: Europe APAC Sanitary Ware Industry Revenue (billion), by Production Analysis 2025 & 2033
- Figure 27: Europe APAC Sanitary Ware Industry Revenue Share (%), by Production Analysis 2025 & 2033
- Figure 28: Europe APAC Sanitary Ware Industry Revenue (billion), by Consumption Analysis 2025 & 2033
- Figure 29: Europe APAC Sanitary Ware Industry Revenue Share (%), by Consumption Analysis 2025 & 2033
- Figure 30: Europe APAC Sanitary Ware Industry Revenue (billion), by Import Market Analysis (Value & Volume) 2025 & 2033
- Figure 31: Europe APAC Sanitary Ware Industry Revenue Share (%), by Import Market Analysis (Value & Volume) 2025 & 2033
- Figure 32: Europe APAC Sanitary Ware Industry Revenue (billion), by Export Market Analysis (Value & Volume) 2025 & 2033
- Figure 33: Europe APAC Sanitary Ware Industry Revenue Share (%), by Export Market Analysis (Value & Volume) 2025 & 2033
- Figure 34: Europe APAC Sanitary Ware Industry Revenue (billion), by Price Trend Analysis 2025 & 2033
- Figure 35: Europe APAC Sanitary Ware Industry Revenue Share (%), by Price Trend Analysis 2025 & 2033
- Figure 36: Europe APAC Sanitary Ware Industry Revenue (billion), by Country 2025 & 2033
- Figure 37: Europe APAC Sanitary Ware Industry Revenue Share (%), by Country 2025 & 2033
- Figure 38: Middle East & Africa APAC Sanitary Ware Industry Revenue (billion), by Production Analysis 2025 & 2033
- Figure 39: Middle East & Africa APAC Sanitary Ware Industry Revenue Share (%), by Production Analysis 2025 & 2033
- Figure 40: Middle East & Africa APAC Sanitary Ware Industry Revenue (billion), by Consumption Analysis 2025 & 2033
- Figure 41: Middle East & Africa APAC Sanitary Ware Industry Revenue Share (%), by Consumption Analysis 2025 & 2033
- Figure 42: Middle East & Africa APAC Sanitary Ware Industry Revenue (billion), by Import Market Analysis (Value & Volume) 2025 & 2033
- Figure 43: Middle East & Africa APAC Sanitary Ware Industry Revenue Share (%), by Import Market Analysis (Value & Volume) 2025 & 2033
- Figure 44: Middle East & Africa APAC Sanitary Ware Industry Revenue (billion), by Export Market Analysis (Value & Volume) 2025 & 2033
- Figure 45: Middle East & Africa APAC Sanitary Ware Industry Revenue Share (%), by Export Market Analysis (Value & Volume) 2025 & 2033
- Figure 46: Middle East & Africa APAC Sanitary Ware Industry Revenue (billion), by Price Trend Analysis 2025 & 2033
- Figure 47: Middle East & Africa APAC Sanitary Ware Industry Revenue Share (%), by Price Trend Analysis 2025 & 2033
- Figure 48: Middle East & Africa APAC Sanitary Ware Industry Revenue (billion), by Country 2025 & 2033
- Figure 49: Middle East & Africa APAC Sanitary Ware Industry Revenue Share (%), by Country 2025 & 2033
- Figure 50: Asia Pacific APAC Sanitary Ware Industry Revenue (billion), by Production Analysis 2025 & 2033
- Figure 51: Asia Pacific APAC Sanitary Ware Industry Revenue Share (%), by Production Analysis 2025 & 2033
- Figure 52: Asia Pacific APAC Sanitary Ware Industry Revenue (billion), by Consumption Analysis 2025 & 2033
- Figure 53: Asia Pacific APAC Sanitary Ware Industry Revenue Share (%), by Consumption Analysis 2025 & 2033
- Figure 54: Asia Pacific APAC Sanitary Ware Industry Revenue (billion), by Import Market Analysis (Value & Volume) 2025 & 2033
- Figure 55: Asia Pacific APAC Sanitary Ware Industry Revenue Share (%), by Import Market Analysis (Value & Volume) 2025 & 2033
- Figure 56: Asia Pacific APAC Sanitary Ware Industry Revenue (billion), by Export Market Analysis (Value & Volume) 2025 & 2033
- Figure 57: Asia Pacific APAC Sanitary Ware Industry Revenue Share (%), by Export Market Analysis (Value & Volume) 2025 & 2033
- Figure 58: Asia Pacific APAC Sanitary Ware Industry Revenue (billion), by Price Trend Analysis 2025 & 2033
- Figure 59: Asia Pacific APAC Sanitary Ware Industry Revenue Share (%), by Price Trend Analysis 2025 & 2033
- Figure 60: Asia Pacific APAC Sanitary Ware Industry Revenue (billion), by Country 2025 & 2033
- Figure 61: Asia Pacific APAC Sanitary Ware Industry Revenue Share (%), by Country 2025 & 2033
List of Tables
- Table 1: Global APAC Sanitary Ware Industry Revenue billion Forecast, by Production Analysis 2020 & 2033
- Table 2: Global APAC Sanitary Ware Industry Revenue billion Forecast, by Consumption Analysis 2020 & 2033
- Table 3: Global APAC Sanitary Ware Industry Revenue billion Forecast, by Import Market Analysis (Value & Volume) 2020 & 2033
- Table 4: Global APAC Sanitary Ware Industry Revenue billion Forecast, by Export Market Analysis (Value & Volume) 2020 & 2033
- Table 5: Global APAC Sanitary Ware Industry Revenue billion Forecast, by Price Trend Analysis 2020 & 2033
- Table 6: Global APAC Sanitary Ware Industry Revenue billion Forecast, by Region 2020 & 2033
- Table 7: Global APAC Sanitary Ware Industry Revenue billion Forecast, by Production Analysis 2020 & 2033
- Table 8: Global APAC Sanitary Ware Industry Revenue billion Forecast, by Consumption Analysis 2020 & 2033
- Table 9: Global APAC Sanitary Ware Industry Revenue billion Forecast, by Import Market Analysis (Value & Volume) 2020 & 2033
- Table 10: Global APAC Sanitary Ware Industry Revenue billion Forecast, by Export Market Analysis (Value & Volume) 2020 & 2033
- Table 11: Global APAC Sanitary Ware Industry Revenue billion Forecast, by Price Trend Analysis 2020 & 2033
- Table 12: Global APAC Sanitary Ware Industry Revenue billion Forecast, by Country 2020 & 2033
- Table 13: United States APAC Sanitary Ware Industry Revenue (billion) Forecast, by Application 2020 & 2033
- Table 14: Canada APAC Sanitary Ware Industry Revenue (billion) Forecast, by Application 2020 & 2033
- Table 15: Mexico APAC Sanitary Ware Industry Revenue (billion) Forecast, by Application 2020 & 2033
- Table 16: Global APAC Sanitary Ware Industry Revenue billion Forecast, by Production Analysis 2020 & 2033
- Table 17: Global APAC Sanitary Ware Industry Revenue billion Forecast, by Consumption Analysis 2020 & 2033
- Table 18: Global APAC Sanitary Ware Industry Revenue billion Forecast, by Import Market Analysis (Value & Volume) 2020 & 2033
- Table 19: Global APAC Sanitary Ware Industry Revenue billion Forecast, by Export Market Analysis (Value & Volume) 2020 & 2033
- Table 20: Global APAC Sanitary Ware Industry Revenue billion Forecast, by Price Trend Analysis 2020 & 2033
- Table 21: Global APAC Sanitary Ware Industry Revenue billion Forecast, by Country 2020 & 2033
- Table 22: Brazil APAC Sanitary Ware Industry Revenue (billion) Forecast, by Application 2020 & 2033
- Table 23: Argentina APAC Sanitary Ware Industry Revenue (billion) Forecast, by Application 2020 & 2033
- Table 24: Rest of South America APAC Sanitary Ware Industry Revenue (billion) Forecast, by Application 2020 & 2033
- Table 25: Global APAC Sanitary Ware Industry Revenue billion Forecast, by Production Analysis 2020 & 2033
- Table 26: Global APAC Sanitary Ware Industry Revenue billion Forecast, by Consumption Analysis 2020 & 2033
- Table 27: Global APAC Sanitary Ware Industry Revenue billion Forecast, by Import Market Analysis (Value & Volume) 2020 & 2033
- Table 28: Global APAC Sanitary Ware Industry Revenue billion Forecast, by Export Market Analysis (Value & Volume) 2020 & 2033
- Table 29: Global APAC Sanitary Ware Industry Revenue billion Forecast, by Price Trend Analysis 2020 & 2033
- Table 30: Global APAC Sanitary Ware Industry Revenue billion Forecast, by Country 2020 & 2033
- Table 31: United Kingdom APAC Sanitary Ware Industry Revenue (billion) Forecast, by Application 2020 & 2033
- Table 32: Germany APAC Sanitary Ware Industry Revenue (billion) Forecast, by Application 2020 & 2033
- Table 33: France APAC Sanitary Ware Industry Revenue (billion) Forecast, by Application 2020 & 2033
- Table 34: Italy APAC Sanitary Ware Industry Revenue (billion) Forecast, by Application 2020 & 2033
- Table 35: Spain APAC Sanitary Ware Industry Revenue (billion) Forecast, by Application 2020 & 2033
- Table 36: Russia APAC Sanitary Ware Industry Revenue (billion) Forecast, by Application 2020 & 2033
- Table 37: Benelux APAC Sanitary Ware Industry Revenue (billion) Forecast, by Application 2020 & 2033
- Table 38: Nordics APAC Sanitary Ware Industry Revenue (billion) Forecast, by Application 2020 & 2033
- Table 39: Rest of Europe APAC Sanitary Ware Industry Revenue (billion) Forecast, by Application 2020 & 2033
- Table 40: Global APAC Sanitary Ware Industry Revenue billion Forecast, by Production Analysis 2020 & 2033
- Table 41: Global APAC Sanitary Ware Industry Revenue billion Forecast, by Consumption Analysis 2020 & 2033
- Table 42: Global APAC Sanitary Ware Industry Revenue billion Forecast, by Import Market Analysis (Value & Volume) 2020 & 2033
- Table 43: Global APAC Sanitary Ware Industry Revenue billion Forecast, by Export Market Analysis (Value & Volume) 2020 & 2033
- Table 44: Global APAC Sanitary Ware Industry Revenue billion Forecast, by Price Trend Analysis 2020 & 2033
- Table 45: Global APAC Sanitary Ware Industry Revenue billion Forecast, by Country 2020 & 2033
- Table 46: Turkey APAC Sanitary Ware Industry Revenue (billion) Forecast, by Application 2020 & 2033
- Table 47: Israel APAC Sanitary Ware Industry Revenue (billion) Forecast, by Application 2020 & 2033
- Table 48: GCC APAC Sanitary Ware Industry Revenue (billion) Forecast, by Application 2020 & 2033
- Table 49: North Africa APAC Sanitary Ware Industry Revenue (billion) Forecast, by Application 2020 & 2033
- Table 50: South Africa APAC Sanitary Ware Industry Revenue (billion) Forecast, by Application 2020 & 2033
- Table 51: Rest of Middle East & Africa APAC Sanitary Ware Industry Revenue (billion) Forecast, by Application 2020 & 2033
- Table 52: Global APAC Sanitary Ware Industry Revenue billion Forecast, by Production Analysis 2020 & 2033
- Table 53: Global APAC Sanitary Ware Industry Revenue billion Forecast, by Consumption Analysis 2020 & 2033
- Table 54: Global APAC Sanitary Ware Industry Revenue billion Forecast, by Import Market Analysis (Value & Volume) 2020 & 2033
- Table 55: Global APAC Sanitary Ware Industry Revenue billion Forecast, by Export Market Analysis (Value & Volume) 2020 & 2033
- Table 56: Global APAC Sanitary Ware Industry Revenue billion Forecast, by Price Trend Analysis 2020 & 2033
- Table 57: Global APAC Sanitary Ware Industry Revenue billion Forecast, by Country 2020 & 2033
- Table 58: China APAC Sanitary Ware Industry Revenue (billion) Forecast, by Application 2020 & 2033
- Table 59: India APAC Sanitary Ware Industry Revenue (billion) Forecast, by Application 2020 & 2033
- Table 60: Japan APAC Sanitary Ware Industry Revenue (billion) Forecast, by Application 2020 & 2033
- Table 61: South Korea APAC Sanitary Ware Industry Revenue (billion) Forecast, by Application 2020 & 2033
- Table 62: ASEAN APAC Sanitary Ware Industry Revenue (billion) Forecast, by Application 2020 & 2033
- Table 63: Oceania APAC Sanitary Ware Industry Revenue (billion) Forecast, by Application 2020 & 2033
- Table 64: Rest of Asia Pacific APAC Sanitary Ware Industry Revenue (billion) Forecast, by Application 2020 & 2033
Frequently Asked Questions
1. What is the projected Compound Annual Growth Rate (CAGR) of the APAC Sanitary Ware Industry?
The projected CAGR is approximately 7.2%.
2. Which companies are prominent players in the APAC Sanitary Ware Industry?
Key companies in the market include Toto Inc, RAK ceramics, Huida Sanitary Ware Co Ltd, Hindustan Sanitaryware & Industries Limited (HSIL), Cera Sanitaryware*List Not Exhaustive, Kerovit, Kajaria Ceramics Limited, Lixil, Villeroy Boch Group, Jaquar, Roca (China) Co Ltd, Kohler (China) Investment Co Ltd.
3. What are the main segments of the APAC Sanitary Ware Industry?
The market segments include Production Analysis, Consumption Analysis, Import Market Analysis (Value & Volume), Export Market Analysis (Value & Volume), Price Trend Analysis.
4. Can you provide details about the market size?
The market size is estimated to be USD 32.47 billion as of 2022.
5. What are some drivers contributing to market growth?
Rising Urbanization and Population Growth.
6. What are the notable trends driving market growth?
Ceramic Wash Closets Are Witnessing Increased Demand.
7. Are there any restraints impacting market growth?
Economic Uncertainty.
8. Can you provide examples of recent developments in the market?
N/A
9. What pricing options are available for accessing the report?
Pricing options include single-user, multi-user, and enterprise licenses priced at USD 3800, USD 4500, and USD 5800 respectively.
10. Is the market size provided in terms of value or volume?
The market size is provided in terms of value, measured in billion.
11. Are there any specific market keywords associated with the report?
Yes, the market keyword associated with the report is "APAC Sanitary Ware Industry," which aids in identifying and referencing the specific market segment covered.
12. How do I determine which pricing option suits my needs best?
The pricing options vary based on user requirements and access needs. Individual users may opt for single-user licenses, while businesses requiring broader access may choose multi-user or enterprise licenses for cost-effective access to the report.
13. Are there any additional resources or data provided in the APAC Sanitary Ware Industry report?
While the report offers comprehensive insights, it's advisable to review the specific contents or supplementary materials provided to ascertain if additional resources or data are available.
14. How can I stay updated on further developments or reports in the APAC Sanitary Ware Industry?
To stay informed about further developments, trends, and reports in the APAC Sanitary Ware Industry, consider subscribing to industry newsletters, following relevant companies and organizations, or regularly checking reputable industry news sources and publications.
Methodology
Step 1 - Identification of Relevant Samples Size from Population Database


Step 2 - Approaches for Defining Global Market Size (Value, Volume* & Price*)

Note*: In applicable scenarios
Step 3 - Data Sources
Primary Research
- Web Analytics
- Survey Reports
- Research Institute
- Latest Research Reports
- Opinion Leaders
Secondary Research
- Annual Reports
- White Paper
- Latest Press Release
- Industry Association
- Paid Database
- Investor Presentations

Step 4 - Data Triangulation
Involves using different sources of information in order to increase the validity of a study
These sources are likely to be stakeholders in a program - participants, other researchers, program staff, other community members, and so on.
Then we put all data in single framework & apply various statistical tools to find out the dynamic on the market.
During the analysis stage, feedback from the stakeholder groups would be compared to determine areas of agreement as well as areas of divergence