
Key Insights
The Asia-Pacific (APAC) sports nutrition market, encompassing sports food, drinks, and supplements, is experiencing robust growth, driven by rising health consciousness, increasing disposable incomes, and a surge in participation in fitness activities across the region. Significant growth is observed in countries like India, China, and South Korea, fueled by a burgeoning middle class with greater spending power and a growing awareness of the benefits of nutritional supplementation for athletic performance and overall well-being. The convenience store and online channels are particularly dynamic, reflecting changing consumer preferences for ease of access and a broader range of product choices. While the overall market is fragmented, major players are increasingly focusing on product innovation, strategic partnerships, and targeted marketing campaigns to capture market share. The expansion of e-commerce platforms and the rising popularity of online fitness communities further accelerate market expansion. Specific product segments like protein powders and energy drinks witness particularly strong demand, reflecting the fitness-focused lifestyles of consumers. However, challenges remain, including the need to address consumer concerns about product safety and authenticity, and navigating varying regulatory landscapes across different APAC countries. This requires companies to prioritize transparency and build strong brand trust.
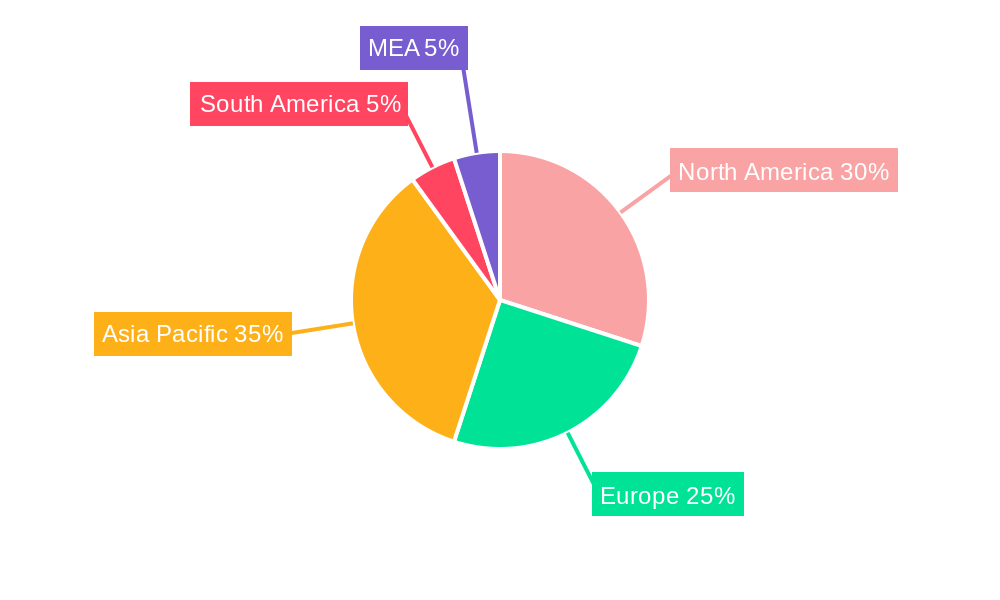
The APAC region's diverse demographics and varying levels of economic development present both opportunities and complexities for sports nutrition companies. The significant growth potential in emerging markets requires localized strategies, tailored product offerings to cater to specific dietary preferences and cultural nuances, and robust distribution networks. While North America and Europe currently hold larger market shares, the APAC market's high growth trajectory suggests a significant shift in market dynamics in the coming years. Successful companies will be those that can effectively leverage digital marketing to reach consumers, build strong relationships with local distributors, and invest in research and development to create innovative and culturally relevant products that meet the diverse needs of the APAC consumer base. The long-term outlook for the APAC sports nutrition market remains extremely positive, with continued expansion driven by a confluence of favorable economic, social, and technological trends.
This comprehensive report provides an in-depth analysis of the Asia-Pacific (APAC) sports nutrition industry, covering the period from 2019 to 2033. It offers valuable insights into market trends, key players, growth drivers, and challenges, equipping stakeholders with actionable intelligence for strategic decision-making. The report utilizes data from the historical period (2019-2024), with the base year set at 2025 and the forecast period spanning 2025-2033. The estimated market size for 2025 is xx Million.
APAC Sports Nutrition Industry Market Concentration & Innovation
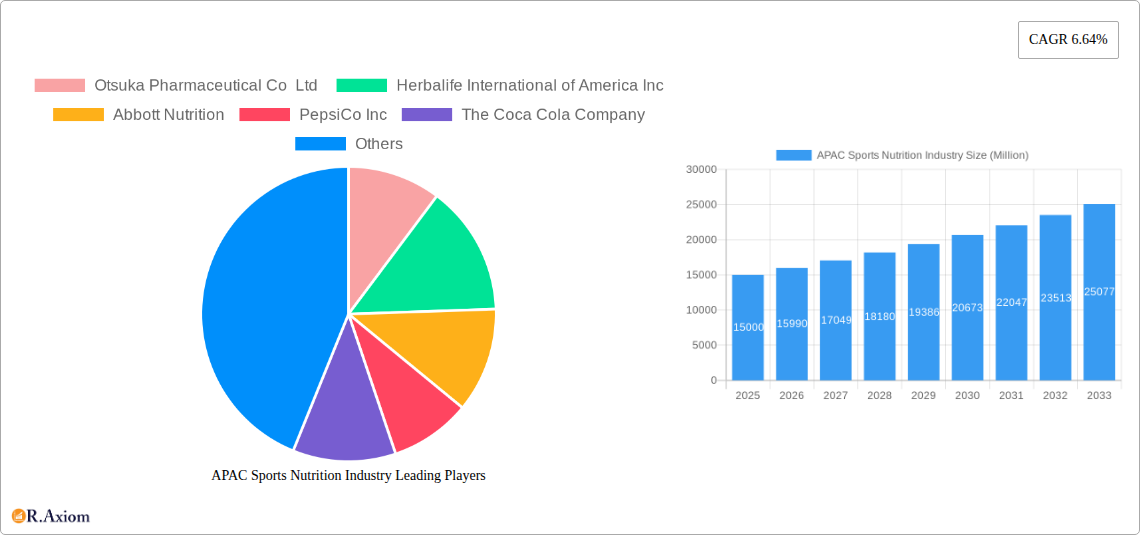
The APAC sports nutrition market exhibits a moderately concentrated landscape, with a few multinational giants and several regional players vying for market share. Otsuka Pharmaceutical Co Ltd, Herbalife International of America Inc, and Abbott Nutrition hold significant positions, although precise market share data is proprietary. However, the market is witnessing increased dynamism due to the entry of numerous smaller, specialized brands, fueled by consumer demand for niche products and innovative formulations.
- Market Concentration: The top 5 players account for approximately xx% of the market in 2025 (estimated).
- Innovation Drivers: Rising health consciousness, increasing disposable incomes, and the growing popularity of fitness activities are driving innovation in product formulations, packaging, and distribution channels.
- Regulatory Frameworks: Varying regulatory frameworks across APAC nations impact product approvals and labeling requirements, creating both challenges and opportunities for players.
- Product Substitutes: Traditional food and beverage options pose a degree of substitution threat, while the emergence of alternative health and wellness products introduces competitive pressure.
- End-User Trends: Increasing demand for functional foods, personalized nutrition solutions, and products catering to specific sports and fitness activities are reshaping market dynamics.
- M&A Activities: The past five years have seen a moderate level of M&A activity, with deal values ranging from xx Million to xx Million. These transactions often focus on expanding product portfolios, geographical reach, and technological capabilities.
APAC Sports Nutrition Industry Industry Trends & Insights
The APAC sports nutrition market is experiencing robust growth, driven by several key factors. The CAGR for the period 2025-2033 is estimated to be xx%, fueled by rising health awareness, increasing urbanization, and a burgeoning fitness culture. Market penetration for sports nutrition products remains relatively low in certain segments, presenting significant growth potential. Technological advancements, such as personalized nutrition recommendations based on genetic data, are transforming consumer experience and product development. Furthermore, evolving consumer preferences toward clean label products and sustainable packaging are influencing brand strategies. Competitive dynamics are intensified by both established players expanding their product lines and the emergence of nimble start-ups offering innovative solutions.
Dominant Markets & Segments in APAC Sports Nutrition Industry
Within APAC, China and India represent the most dominant markets due to their large populations, rising middle classes, and increasing adoption of fitness and sports activities. Other key markets include Australia, South Korea, and Japan.
- Dominant Product Type: Sports supplements, particularly protein powders, command the largest market share, driven by the high demand among fitness enthusiasts and athletes.
- Dominant Distribution Channel: Supermarkets/Hypermarkets currently hold the largest share, followed by online stores, which are rapidly gaining traction.
- Key Drivers for Dominance in China and India:
- Rapid economic growth and rising disposable incomes.
- Increasing health awareness and focus on wellness.
- Expanding fitness infrastructure and participation in sports.
- Favorable government policies promoting health and wellness.
APAC Sports Nutrition Industry Product Developments
Product innovation is a key battleground in the APAC sports nutrition market. We are seeing the rise of plant-based protein options, functional beverages with added benefits (e.g., immunity boost), and personalized nutrition solutions tailored to individual needs and genetic profiles. The incorporation of natural and organic ingredients is also gaining traction, driven by consumer demand for cleaner and healthier products. These developments reflect the market's focus on delivering better health outcomes and enhanced athletic performance.
Report Scope & Segmentation Analysis
This report segments the APAC sports nutrition market based on product type (Sports Food, Sports Drinks, Sports Supplements) and distribution channel (Supermarkets/Hypermarkets, Convenience Stores, Specialty Stores, Online Stores, Other Distribution Channels). Each segment’s growth projection, market size, and competitive dynamics are analyzed separately. For example, the sports supplements segment is projected to witness strong growth driven by increasing demand for protein powders and other performance-enhancing products. The online distribution channel demonstrates high growth potential due to the expansion of e-commerce and the increasing preference for convenient purchasing options.
Key Drivers of APAC Sports Nutrition Industry Growth
The APAC sports nutrition market is experiencing robust growth fueled by several factors: a rising middle class with increased disposable income, a growing health and wellness consciousness, the increasing popularity of fitness and sports activities, and the rapid expansion of e-commerce platforms. Government initiatives to promote health and wellness also contribute to this growth.
Challenges in the APAC Sports Nutrition Industry Sector
Despite the positive growth outlook, the APAC sports nutrition industry faces challenges. These include varying regulatory landscapes across the region, increasing raw material costs, stiff competition from established and emerging players, and the potential for counterfeiting and substandard products. These factors can negatively impact profitability and market stability.
Emerging Opportunities in APAC Sports Nutrition Industry
Significant growth opportunities exist in the APAC sports nutrition market. These include tapping into emerging markets with high growth potential, focusing on product innovation that caters to specific health and fitness needs, and leveraging technological advancements like personalized nutrition recommendations. The rise of e-commerce presents a major opportunity for expansion.
Leading Players in the APAC Sports Nutrition Industry Market
- Otsuka Pharmaceutical Co Ltd
- Herbalife International of America Inc
- Abbott Nutrition
- PepsiCo Inc
- The Coca Cola Company
- Glanbia PLC
- Cliff Bar & Company
- Zywie Ventures Pvt Ltd
- Muscleblaze
- Healthkart
- General Nutrition Centers Inc
Key Developments in APAC Sports Nutrition Industry Industry
- August 2022: The Coca-Cola Company launched Limca Sportz, a glucose+electrolyte sports drink. This broadened Coca-Cola's presence in the sports nutrition sector.
- September 2022: HRX and OZiva partnered to create HRX Agame, a new sports and performance nutrition brand in India, indicating a growing interest in collaborations and market expansion.
- April 2023: Genetic Nutrition, a UK brand, entered the Indian market with its high-quality sports nutrition supplements, highlighting the growing attractiveness of the Indian market for international players.
Strategic Outlook for APAC Sports Nutrition Industry Market
The APAC sports nutrition market exhibits significant long-term growth potential driven by multiple factors outlined in this report. The focus on product innovation, strategic partnerships, and leveraging digital channels will be crucial for success in this dynamic market. Companies that successfully adapt to evolving consumer preferences and navigate regulatory complexities are well-positioned to capture a significant share of this expanding market.
APAC Sports Nutrition Industry Segmentation
-
1. Product Type
- 1.1. Sports Food
- 1.2. Sports Drinks
- 1.3. Sports Supplements
-
2. Distribution Channel
- 2.1. Supermarkets/Hypermarkets
- 2.2. Convenience Stores
- 2.3. Specialty Stores
- 2.4. Online Stores
- 2.5. Other Distribution Channels
-
3. Geography
- 3.1. China
- 3.2. Japan
- 3.3. India
- 3.4. Australia
- 3.5. Rest of Asia-Pacific
APAC Sports Nutrition Industry Segmentation By Geography
- 1. China
- 2. Japan
- 3. India
- 4. Australia
- 5. Rest of Asia Pacific
APAC Sports Nutrition Industry REPORT HIGHLIGHTS
| Aspects | Details |
|---|---|
| Study Period | 2019-2033 |
| Base Year | 2024 |
| Estimated Year | 2025 |
| Forecast Period | 2025-2033 |
| Historical Period | 2019-2024 |
| Growth Rate | CAGR of 6.64% from 2019-2033 |
| Segmentation |
|
Table of Contents
- 1. Introduction
- 1.1. Research Scope
- 1.2. Market Segmentation
- 1.3. Research Methodology
- 1.4. Definitions and Assumptions
- 2. Executive Summary
- 2.1. Introduction
- 3. Market Dynamics
- 3.1. Introduction
- 3.2. Market Drivers
- 3.2.1. Increasing Sports Participation; Increasing Awareness about Health and Fitness
- 3.3. Market Restrains
- 3.3.1. Adverse Effects of Overconsumption of Products
- 3.4. Market Trends
- 3.4.1. Increasing Sports Participation to Boost Market Growth
- 4. Market Factor Analysis
- 4.1. Porters Five Forces
- 4.2. Supply/Value Chain
- 4.3. PESTEL analysis
- 4.4. Market Entropy
- 4.5. Patent/Trademark Analysis
- 5. Global APAC Sports Nutrition Industry Analysis, Insights and Forecast, 2019-2031
- 5.1. Market Analysis, Insights and Forecast - by Product Type
- 5.1.1. Sports Food
- 5.1.2. Sports Drinks
- 5.1.3. Sports Supplements
- 5.2. Market Analysis, Insights and Forecast - by Distribution Channel
- 5.2.1. Supermarkets/Hypermarkets
- 5.2.2. Convenience Stores
- 5.2.3. Specialty Stores
- 5.2.4. Online Stores
- 5.2.5. Other Distribution Channels
- 5.3. Market Analysis, Insights and Forecast - by Geography
- 5.3.1. China
- 5.3.2. Japan
- 5.3.3. India
- 5.3.4. Australia
- 5.3.5. Rest of Asia-Pacific
- 5.4. Market Analysis, Insights and Forecast - by Region
- 5.4.1. China
- 5.4.2. Japan
- 5.4.3. India
- 5.4.4. Australia
- 5.4.5. Rest of Asia Pacific
- 5.1. Market Analysis, Insights and Forecast - by Product Type
- 6. China APAC Sports Nutrition Industry Analysis, Insights and Forecast, 2019-2031
- 6.1. Market Analysis, Insights and Forecast - by Product Type
- 6.1.1. Sports Food
- 6.1.2. Sports Drinks
- 6.1.3. Sports Supplements
- 6.2. Market Analysis, Insights and Forecast - by Distribution Channel
- 6.2.1. Supermarkets/Hypermarkets
- 6.2.2. Convenience Stores
- 6.2.3. Specialty Stores
- 6.2.4. Online Stores
- 6.2.5. Other Distribution Channels
- 6.3. Market Analysis, Insights and Forecast - by Geography
- 6.3.1. China
- 6.3.2. Japan
- 6.3.3. India
- 6.3.4. Australia
- 6.3.5. Rest of Asia-Pacific
- 6.1. Market Analysis, Insights and Forecast - by Product Type
- 7. Japan APAC Sports Nutrition Industry Analysis, Insights and Forecast, 2019-2031
- 7.1. Market Analysis, Insights and Forecast - by Product Type
- 7.1.1. Sports Food
- 7.1.2. Sports Drinks
- 7.1.3. Sports Supplements
- 7.2. Market Analysis, Insights and Forecast - by Distribution Channel
- 7.2.1. Supermarkets/Hypermarkets
- 7.2.2. Convenience Stores
- 7.2.3. Specialty Stores
- 7.2.4. Online Stores
- 7.2.5. Other Distribution Channels
- 7.3. Market Analysis, Insights and Forecast - by Geography
- 7.3.1. China
- 7.3.2. Japan
- 7.3.3. India
- 7.3.4. Australia
- 7.3.5. Rest of Asia-Pacific
- 7.1. Market Analysis, Insights and Forecast - by Product Type
- 8. India APAC Sports Nutrition Industry Analysis, Insights and Forecast, 2019-2031
- 8.1. Market Analysis, Insights and Forecast - by Product Type
- 8.1.1. Sports Food
- 8.1.2. Sports Drinks
- 8.1.3. Sports Supplements
- 8.2. Market Analysis, Insights and Forecast - by Distribution Channel
- 8.2.1. Supermarkets/Hypermarkets
- 8.2.2. Convenience Stores
- 8.2.3. Specialty Stores
- 8.2.4. Online Stores
- 8.2.5. Other Distribution Channels
- 8.3. Market Analysis, Insights and Forecast - by Geography
- 8.3.1. China
- 8.3.2. Japan
- 8.3.3. India
- 8.3.4. Australia
- 8.3.5. Rest of Asia-Pacific
- 8.1. Market Analysis, Insights and Forecast - by Product Type
- 9. Australia APAC Sports Nutrition Industry Analysis, Insights and Forecast, 2019-2031
- 9.1. Market Analysis, Insights and Forecast - by Product Type
- 9.1.1. Sports Food
- 9.1.2. Sports Drinks
- 9.1.3. Sports Supplements
- 9.2. Market Analysis, Insights and Forecast - by Distribution Channel
- 9.2.1. Supermarkets/Hypermarkets
- 9.2.2. Convenience Stores
- 9.2.3. Specialty Stores
- 9.2.4. Online Stores
- 9.2.5. Other Distribution Channels
- 9.3. Market Analysis, Insights and Forecast - by Geography
- 9.3.1. China
- 9.3.2. Japan
- 9.3.3. India
- 9.3.4. Australia
- 9.3.5. Rest of Asia-Pacific
- 9.1. Market Analysis, Insights and Forecast - by Product Type
- 10. Rest of Asia Pacific APAC Sports Nutrition Industry Analysis, Insights and Forecast, 2019-2031
- 10.1. Market Analysis, Insights and Forecast - by Product Type
- 10.1.1. Sports Food
- 10.1.2. Sports Drinks
- 10.1.3. Sports Supplements
- 10.2. Market Analysis, Insights and Forecast - by Distribution Channel
- 10.2.1. Supermarkets/Hypermarkets
- 10.2.2. Convenience Stores
- 10.2.3. Specialty Stores
- 10.2.4. Online Stores
- 10.2.5. Other Distribution Channels
- 10.3. Market Analysis, Insights and Forecast - by Geography
- 10.3.1. China
- 10.3.2. Japan
- 10.3.3. India
- 10.3.4. Australia
- 10.3.5. Rest of Asia-Pacific
- 10.1. Market Analysis, Insights and Forecast - by Product Type
- 11. North America APAC Sports Nutrition Industry Analysis, Insights and Forecast, 2019-2031
- 11.1. Market Analysis, Insights and Forecast - By Country/Sub-region
- 11.1.1 United States
- 11.1.2 Canada
- 11.1.3 Mexico
- 12. Europe APAC Sports Nutrition Industry Analysis, Insights and Forecast, 2019-2031
- 12.1. Market Analysis, Insights and Forecast - By Country/Sub-region
- 12.1.1 Germany
- 12.1.2 United Kingdom
- 12.1.3 France
- 12.1.4 Spain
- 12.1.5 Italy
- 12.1.6 Spain
- 12.1.7 Belgium
- 12.1.8 Netherland
- 12.1.9 Nordics
- 12.1.10 Rest of Europe
- 13. Asia Pacific APAC Sports Nutrition Industry Analysis, Insights and Forecast, 2019-2031
- 13.1. Market Analysis, Insights and Forecast - By Country/Sub-region
- 13.1.1 China
- 13.1.2 Japan
- 13.1.3 India
- 13.1.4 South Korea
- 13.1.5 Southeast Asia
- 13.1.6 Australia
- 13.1.7 Indonesia
- 13.1.8 Phillipes
- 13.1.9 Singapore
- 13.1.10 Thailandc
- 13.1.11 Rest of Asia Pacific
- 14. South America APAC Sports Nutrition Industry Analysis, Insights and Forecast, 2019-2031
- 14.1. Market Analysis, Insights and Forecast - By Country/Sub-region
- 14.1.1 Brazil
- 14.1.2 Argentina
- 14.1.3 Peru
- 14.1.4 Chile
- 14.1.5 Colombia
- 14.1.6 Ecuador
- 14.1.7 Venezuela
- 14.1.8 Rest of South America
- 15. North America APAC Sports Nutrition Industry Analysis, Insights and Forecast, 2019-2031
- 15.1. Market Analysis, Insights and Forecast - By Country/Sub-region
- 15.1.1 United States
- 15.1.2 Canada
- 15.1.3 Mexico
- 16. MEA APAC Sports Nutrition Industry Analysis, Insights and Forecast, 2019-2031
- 16.1. Market Analysis, Insights and Forecast - By Country/Sub-region
- 16.1.1 United Arab Emirates
- 16.1.2 Saudi Arabia
- 16.1.3 South Africa
- 16.1.4 Rest of Middle East and Africa
- 17. Competitive Analysis
- 17.1. Global Market Share Analysis 2024
- 17.2. Company Profiles
- 17.2.1 Otsuka Pharmaceutical Co Ltd
- 17.2.1.1. Overview
- 17.2.1.2. Products
- 17.2.1.3. SWOT Analysis
- 17.2.1.4. Recent Developments
- 17.2.1.5. Financials (Based on Availability)
- 17.2.2 Herbalife International of America Inc
- 17.2.2.1. Overview
- 17.2.2.2. Products
- 17.2.2.3. SWOT Analysis
- 17.2.2.4. Recent Developments
- 17.2.2.5. Financials (Based on Availability)
- 17.2.3 Abbott Nutrition
- 17.2.3.1. Overview
- 17.2.3.2. Products
- 17.2.3.3. SWOT Analysis
- 17.2.3.4. Recent Developments
- 17.2.3.5. Financials (Based on Availability)
- 17.2.4 PepsiCo Inc
- 17.2.4.1. Overview
- 17.2.4.2. Products
- 17.2.4.3. SWOT Analysis
- 17.2.4.4. Recent Developments
- 17.2.4.5. Financials (Based on Availability)
- 17.2.5 The Coca Cola Company
- 17.2.5.1. Overview
- 17.2.5.2. Products
- 17.2.5.3. SWOT Analysis
- 17.2.5.4. Recent Developments
- 17.2.5.5. Financials (Based on Availability)
- 17.2.6 Glanbia PLC
- 17.2.6.1. Overview
- 17.2.6.2. Products
- 17.2.6.3. SWOT Analysis
- 17.2.6.4. Recent Developments
- 17.2.6.5. Financials (Based on Availability)
- 17.2.7 Cliff Bar & Company
- 17.2.7.1. Overview
- 17.2.7.2. Products
- 17.2.7.3. SWOT Analysis
- 17.2.7.4. Recent Developments
- 17.2.7.5. Financials (Based on Availability)
- 17.2.8 Zywie Ventures Pvt Ltd
- 17.2.8.1. Overview
- 17.2.8.2. Products
- 17.2.8.3. SWOT Analysis
- 17.2.8.4. Recent Developments
- 17.2.8.5. Financials (Based on Availability)
- 17.2.9 Muscleblaze
- 17.2.9.1. Overview
- 17.2.9.2. Products
- 17.2.9.3. SWOT Analysis
- 17.2.9.4. Recent Developments
- 17.2.9.5. Financials (Based on Availability)
- 17.2.10 Healthkart
- 17.2.10.1. Overview
- 17.2.10.2. Products
- 17.2.10.3. SWOT Analysis
- 17.2.10.4. Recent Developments
- 17.2.10.5. Financials (Based on Availability)
- 17.2.11 General Nutrition Centers Inc
- 17.2.11.1. Overview
- 17.2.11.2. Products
- 17.2.11.3. SWOT Analysis
- 17.2.11.4. Recent Developments
- 17.2.11.5. Financials (Based on Availability)
- 17.2.1 Otsuka Pharmaceutical Co Ltd
List of Figures
- Figure 1: Global APAC Sports Nutrition Industry Revenue Breakdown (Million, %) by Region 2024 & 2032
- Figure 2: North America APAC Sports Nutrition Industry Revenue (Million), by Country 2024 & 2032
- Figure 3: North America APAC Sports Nutrition Industry Revenue Share (%), by Country 2024 & 2032
- Figure 4: Europe APAC Sports Nutrition Industry Revenue (Million), by Country 2024 & 2032
- Figure 5: Europe APAC Sports Nutrition Industry Revenue Share (%), by Country 2024 & 2032
- Figure 6: Asia Pacific APAC Sports Nutrition Industry Revenue (Million), by Country 2024 & 2032
- Figure 7: Asia Pacific APAC Sports Nutrition Industry Revenue Share (%), by Country 2024 & 2032
- Figure 8: South America APAC Sports Nutrition Industry Revenue (Million), by Country 2024 & 2032
- Figure 9: South America APAC Sports Nutrition Industry Revenue Share (%), by Country 2024 & 2032
- Figure 10: North America APAC Sports Nutrition Industry Revenue (Million), by Country 2024 & 2032
- Figure 11: North America APAC Sports Nutrition Industry Revenue Share (%), by Country 2024 & 2032
- Figure 12: MEA APAC Sports Nutrition Industry Revenue (Million), by Country 2024 & 2032
- Figure 13: MEA APAC Sports Nutrition Industry Revenue Share (%), by Country 2024 & 2032
- Figure 14: China APAC Sports Nutrition Industry Revenue (Million), by Product Type 2024 & 2032
- Figure 15: China APAC Sports Nutrition Industry Revenue Share (%), by Product Type 2024 & 2032
- Figure 16: China APAC Sports Nutrition Industry Revenue (Million), by Distribution Channel 2024 & 2032
- Figure 17: China APAC Sports Nutrition Industry Revenue Share (%), by Distribution Channel 2024 & 2032
- Figure 18: China APAC Sports Nutrition Industry Revenue (Million), by Geography 2024 & 2032
- Figure 19: China APAC Sports Nutrition Industry Revenue Share (%), by Geography 2024 & 2032
- Figure 20: China APAC Sports Nutrition Industry Revenue (Million), by Country 2024 & 2032
- Figure 21: China APAC Sports Nutrition Industry Revenue Share (%), by Country 2024 & 2032
- Figure 22: Japan APAC Sports Nutrition Industry Revenue (Million), by Product Type 2024 & 2032
- Figure 23: Japan APAC Sports Nutrition Industry Revenue Share (%), by Product Type 2024 & 2032
- Figure 24: Japan APAC Sports Nutrition Industry Revenue (Million), by Distribution Channel 2024 & 2032
- Figure 25: Japan APAC Sports Nutrition Industry Revenue Share (%), by Distribution Channel 2024 & 2032
- Figure 26: Japan APAC Sports Nutrition Industry Revenue (Million), by Geography 2024 & 2032
- Figure 27: Japan APAC Sports Nutrition Industry Revenue Share (%), by Geography 2024 & 2032
- Figure 28: Japan APAC Sports Nutrition Industry Revenue (Million), by Country 2024 & 2032
- Figure 29: Japan APAC Sports Nutrition Industry Revenue Share (%), by Country 2024 & 2032
- Figure 30: India APAC Sports Nutrition Industry Revenue (Million), by Product Type 2024 & 2032
- Figure 31: India APAC Sports Nutrition Industry Revenue Share (%), by Product Type 2024 & 2032
- Figure 32: India APAC Sports Nutrition Industry Revenue (Million), by Distribution Channel 2024 & 2032
- Figure 33: India APAC Sports Nutrition Industry Revenue Share (%), by Distribution Channel 2024 & 2032
- Figure 34: India APAC Sports Nutrition Industry Revenue (Million), by Geography 2024 & 2032
- Figure 35: India APAC Sports Nutrition Industry Revenue Share (%), by Geography 2024 & 2032
- Figure 36: India APAC Sports Nutrition Industry Revenue (Million), by Country 2024 & 2032
- Figure 37: India APAC Sports Nutrition Industry Revenue Share (%), by Country 2024 & 2032
- Figure 38: Australia APAC Sports Nutrition Industry Revenue (Million), by Product Type 2024 & 2032
- Figure 39: Australia APAC Sports Nutrition Industry Revenue Share (%), by Product Type 2024 & 2032
- Figure 40: Australia APAC Sports Nutrition Industry Revenue (Million), by Distribution Channel 2024 & 2032
- Figure 41: Australia APAC Sports Nutrition Industry Revenue Share (%), by Distribution Channel 2024 & 2032
- Figure 42: Australia APAC Sports Nutrition Industry Revenue (Million), by Geography 2024 & 2032
- Figure 43: Australia APAC Sports Nutrition Industry Revenue Share (%), by Geography 2024 & 2032
- Figure 44: Australia APAC Sports Nutrition Industry Revenue (Million), by Country 2024 & 2032
- Figure 45: Australia APAC Sports Nutrition Industry Revenue Share (%), by Country 2024 & 2032
- Figure 46: Rest of Asia Pacific APAC Sports Nutrition Industry Revenue (Million), by Product Type 2024 & 2032
- Figure 47: Rest of Asia Pacific APAC Sports Nutrition Industry Revenue Share (%), by Product Type 2024 & 2032
- Figure 48: Rest of Asia Pacific APAC Sports Nutrition Industry Revenue (Million), by Distribution Channel 2024 & 2032
- Figure 49: Rest of Asia Pacific APAC Sports Nutrition Industry Revenue Share (%), by Distribution Channel 2024 & 2032
- Figure 50: Rest of Asia Pacific APAC Sports Nutrition Industry Revenue (Million), by Geography 2024 & 2032
- Figure 51: Rest of Asia Pacific APAC Sports Nutrition Industry Revenue Share (%), by Geography 2024 & 2032
- Figure 52: Rest of Asia Pacific APAC Sports Nutrition Industry Revenue (Million), by Country 2024 & 2032
- Figure 53: Rest of Asia Pacific APAC Sports Nutrition Industry Revenue Share (%), by Country 2024 & 2032
List of Tables
- Table 1: Global APAC Sports Nutrition Industry Revenue Million Forecast, by Region 2019 & 2032
- Table 2: Global APAC Sports Nutrition Industry Revenue Million Forecast, by Product Type 2019 & 2032
- Table 3: Global APAC Sports Nutrition Industry Revenue Million Forecast, by Distribution Channel 2019 & 2032
- Table 4: Global APAC Sports Nutrition Industry Revenue Million Forecast, by Geography 2019 & 2032
- Table 5: Global APAC Sports Nutrition Industry Revenue Million Forecast, by Region 2019 & 2032
- Table 6: Global APAC Sports Nutrition Industry Revenue Million Forecast, by Country 2019 & 2032
- Table 7: United States APAC Sports Nutrition Industry Revenue (Million) Forecast, by Application 2019 & 2032
- Table 8: Canada APAC Sports Nutrition Industry Revenue (Million) Forecast, by Application 2019 & 2032
- Table 9: Mexico APAC Sports Nutrition Industry Revenue (Million) Forecast, by Application 2019 & 2032
- Table 10: Global APAC Sports Nutrition Industry Revenue Million Forecast, by Country 2019 & 2032
- Table 11: Germany APAC Sports Nutrition Industry Revenue (Million) Forecast, by Application 2019 & 2032
- Table 12: United Kingdom APAC Sports Nutrition Industry Revenue (Million) Forecast, by Application 2019 & 2032
- Table 13: France APAC Sports Nutrition Industry Revenue (Million) Forecast, by Application 2019 & 2032
- Table 14: Spain APAC Sports Nutrition Industry Revenue (Million) Forecast, by Application 2019 & 2032
- Table 15: Italy APAC Sports Nutrition Industry Revenue (Million) Forecast, by Application 2019 & 2032
- Table 16: Spain APAC Sports Nutrition Industry Revenue (Million) Forecast, by Application 2019 & 2032
- Table 17: Belgium APAC Sports Nutrition Industry Revenue (Million) Forecast, by Application 2019 & 2032
- Table 18: Netherland APAC Sports Nutrition Industry Revenue (Million) Forecast, by Application 2019 & 2032
- Table 19: Nordics APAC Sports Nutrition Industry Revenue (Million) Forecast, by Application 2019 & 2032
- Table 20: Rest of Europe APAC Sports Nutrition Industry Revenue (Million) Forecast, by Application 2019 & 2032
- Table 21: Global APAC Sports Nutrition Industry Revenue Million Forecast, by Country 2019 & 2032
- Table 22: China APAC Sports Nutrition Industry Revenue (Million) Forecast, by Application 2019 & 2032
- Table 23: Japan APAC Sports Nutrition Industry Revenue (Million) Forecast, by Application 2019 & 2032
- Table 24: India APAC Sports Nutrition Industry Revenue (Million) Forecast, by Application 2019 & 2032
- Table 25: South Korea APAC Sports Nutrition Industry Revenue (Million) Forecast, by Application 2019 & 2032
- Table 26: Southeast Asia APAC Sports Nutrition Industry Revenue (Million) Forecast, by Application 2019 & 2032
- Table 27: Australia APAC Sports Nutrition Industry Revenue (Million) Forecast, by Application 2019 & 2032
- Table 28: Indonesia APAC Sports Nutrition Industry Revenue (Million) Forecast, by Application 2019 & 2032
- Table 29: Phillipes APAC Sports Nutrition Industry Revenue (Million) Forecast, by Application 2019 & 2032
- Table 30: Singapore APAC Sports Nutrition Industry Revenue (Million) Forecast, by Application 2019 & 2032
- Table 31: Thailandc APAC Sports Nutrition Industry Revenue (Million) Forecast, by Application 2019 & 2032
- Table 32: Rest of Asia Pacific APAC Sports Nutrition Industry Revenue (Million) Forecast, by Application 2019 & 2032
- Table 33: Global APAC Sports Nutrition Industry Revenue Million Forecast, by Country 2019 & 2032
- Table 34: Brazil APAC Sports Nutrition Industry Revenue (Million) Forecast, by Application 2019 & 2032
- Table 35: Argentina APAC Sports Nutrition Industry Revenue (Million) Forecast, by Application 2019 & 2032
- Table 36: Peru APAC Sports Nutrition Industry Revenue (Million) Forecast, by Application 2019 & 2032
- Table 37: Chile APAC Sports Nutrition Industry Revenue (Million) Forecast, by Application 2019 & 2032
- Table 38: Colombia APAC Sports Nutrition Industry Revenue (Million) Forecast, by Application 2019 & 2032
- Table 39: Ecuador APAC Sports Nutrition Industry Revenue (Million) Forecast, by Application 2019 & 2032
- Table 40: Venezuela APAC Sports Nutrition Industry Revenue (Million) Forecast, by Application 2019 & 2032
- Table 41: Rest of South America APAC Sports Nutrition Industry Revenue (Million) Forecast, by Application 2019 & 2032
- Table 42: Global APAC Sports Nutrition Industry Revenue Million Forecast, by Country 2019 & 2032
- Table 43: United States APAC Sports Nutrition Industry Revenue (Million) Forecast, by Application 2019 & 2032
- Table 44: Canada APAC Sports Nutrition Industry Revenue (Million) Forecast, by Application 2019 & 2032
- Table 45: Mexico APAC Sports Nutrition Industry Revenue (Million) Forecast, by Application 2019 & 2032
- Table 46: Global APAC Sports Nutrition Industry Revenue Million Forecast, by Country 2019 & 2032
- Table 47: United Arab Emirates APAC Sports Nutrition Industry Revenue (Million) Forecast, by Application 2019 & 2032
- Table 48: Saudi Arabia APAC Sports Nutrition Industry Revenue (Million) Forecast, by Application 2019 & 2032
- Table 49: South Africa APAC Sports Nutrition Industry Revenue (Million) Forecast, by Application 2019 & 2032
- Table 50: Rest of Middle East and Africa APAC Sports Nutrition Industry Revenue (Million) Forecast, by Application 2019 & 2032
- Table 51: Global APAC Sports Nutrition Industry Revenue Million Forecast, by Product Type 2019 & 2032
- Table 52: Global APAC Sports Nutrition Industry Revenue Million Forecast, by Distribution Channel 2019 & 2032
- Table 53: Global APAC Sports Nutrition Industry Revenue Million Forecast, by Geography 2019 & 2032
- Table 54: Global APAC Sports Nutrition Industry Revenue Million Forecast, by Country 2019 & 2032
- Table 55: Global APAC Sports Nutrition Industry Revenue Million Forecast, by Product Type 2019 & 2032
- Table 56: Global APAC Sports Nutrition Industry Revenue Million Forecast, by Distribution Channel 2019 & 2032
- Table 57: Global APAC Sports Nutrition Industry Revenue Million Forecast, by Geography 2019 & 2032
- Table 58: Global APAC Sports Nutrition Industry Revenue Million Forecast, by Country 2019 & 2032
- Table 59: Global APAC Sports Nutrition Industry Revenue Million Forecast, by Product Type 2019 & 2032
- Table 60: Global APAC Sports Nutrition Industry Revenue Million Forecast, by Distribution Channel 2019 & 2032
- Table 61: Global APAC Sports Nutrition Industry Revenue Million Forecast, by Geography 2019 & 2032
- Table 62: Global APAC Sports Nutrition Industry Revenue Million Forecast, by Country 2019 & 2032
- Table 63: Global APAC Sports Nutrition Industry Revenue Million Forecast, by Product Type 2019 & 2032
- Table 64: Global APAC Sports Nutrition Industry Revenue Million Forecast, by Distribution Channel 2019 & 2032
- Table 65: Global APAC Sports Nutrition Industry Revenue Million Forecast, by Geography 2019 & 2032
- Table 66: Global APAC Sports Nutrition Industry Revenue Million Forecast, by Country 2019 & 2032
- Table 67: Global APAC Sports Nutrition Industry Revenue Million Forecast, by Product Type 2019 & 2032
- Table 68: Global APAC Sports Nutrition Industry Revenue Million Forecast, by Distribution Channel 2019 & 2032
- Table 69: Global APAC Sports Nutrition Industry Revenue Million Forecast, by Geography 2019 & 2032
- Table 70: Global APAC Sports Nutrition Industry Revenue Million Forecast, by Country 2019 & 2032
Frequently Asked Questions
1. What is the projected Compound Annual Growth Rate (CAGR) of the APAC Sports Nutrition Industry?
The projected CAGR is approximately 6.64%.
2. Which companies are prominent players in the APAC Sports Nutrition Industry?
Key companies in the market include Otsuka Pharmaceutical Co Ltd , Herbalife International of America Inc, Abbott Nutrition, PepsiCo Inc, The Coca Cola Company, Glanbia PLC, Cliff Bar & Company, Zywie Ventures Pvt Ltd, Muscleblaze, Healthkart, General Nutrition Centers Inc.
3. What are the main segments of the APAC Sports Nutrition Industry?
The market segments include Product Type, Distribution Channel, Geography.
4. Can you provide details about the market size?
The market size is estimated to be USD XX Million as of 2022.
5. What are some drivers contributing to market growth?
Increasing Sports Participation; Increasing Awareness about Health and Fitness.
6. What are the notable trends driving market growth?
Increasing Sports Participation to Boost Market Growth.
7. Are there any restraints impacting market growth?
Adverse Effects of Overconsumption of Products.
8. Can you provide examples of recent developments in the market?
April 2023: UK sports nutrition brand Genetic Nutrition launched its high-quality sports nutrition supplements in India. The brand's range of supplements includes protein powders, amino acids, and vitamins formulated using best-in-class ingredients for maximum effectiveness.
9. What pricing options are available for accessing the report?
Pricing options include single-user, multi-user, and enterprise licenses priced at USD 4750, USD 5250, and USD 8750 respectively.
10. Is the market size provided in terms of value or volume?
The market size is provided in terms of value, measured in Million.
11. Are there any specific market keywords associated with the report?
Yes, the market keyword associated with the report is "APAC Sports Nutrition Industry," which aids in identifying and referencing the specific market segment covered.
12. How do I determine which pricing option suits my needs best?
The pricing options vary based on user requirements and access needs. Individual users may opt for single-user licenses, while businesses requiring broader access may choose multi-user or enterprise licenses for cost-effective access to the report.
13. Are there any additional resources or data provided in the APAC Sports Nutrition Industry report?
While the report offers comprehensive insights, it's advisable to review the specific contents or supplementary materials provided to ascertain if additional resources or data are available.
14. How can I stay updated on further developments or reports in the APAC Sports Nutrition Industry?
To stay informed about further developments, trends, and reports in the APAC Sports Nutrition Industry, consider subscribing to industry newsletters, following relevant companies and organizations, or regularly checking reputable industry news sources and publications.
Methodology
Step 1 - Identification of Relevant Samples Size from Population Database


Step 2 - Approaches for Defining Global Market Size (Value, Volume* & Price*)

Note*: In applicable scenarios
Step 3 - Data Sources
Primary Research
- Web Analytics
- Survey Reports
- Research Institute
- Latest Research Reports
- Opinion Leaders
Secondary Research
- Annual Reports
- White Paper
- Latest Press Release
- Industry Association
- Paid Database
- Investor Presentations

Step 4 - Data Triangulation
Involves using different sources of information in order to increase the validity of a study
These sources are likely to be stakeholders in a program - participants, other researchers, program staff, other community members, and so on.
Then we put all data in single framework & apply various statistical tools to find out the dynamic on the market.
During the analysis stage, feedback from the stakeholder groups would be compared to determine areas of agreement as well as areas of divergence


