
Key Insights
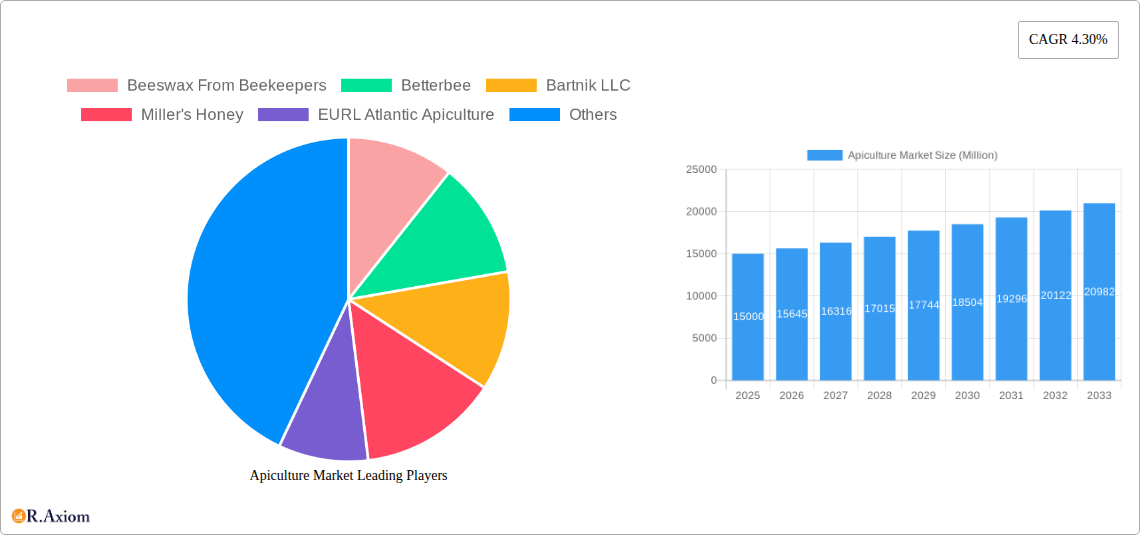
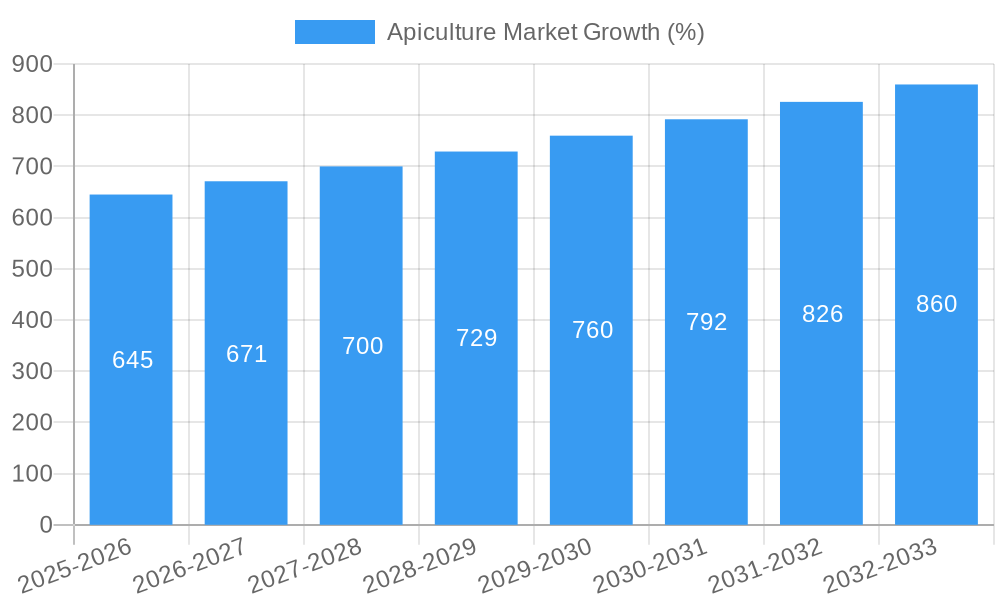
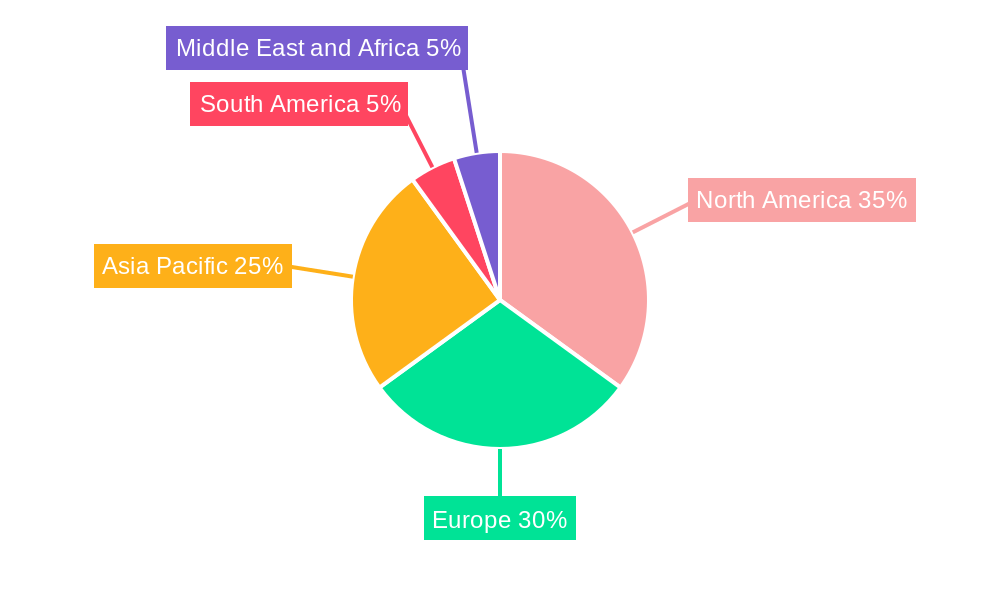
The global apiculture market, encompassing honey, beeswax, live bees, and other products, is experiencing steady growth, projected at a compound annual growth rate (CAGR) of 4.30% from 2025 to 2033. This expansion is fueled by several key drivers. Increasing consumer demand for natural and organic products, particularly in the food and beverage and cosmetics sectors, significantly boosts honey and beeswax sales. The rising awareness of the health benefits associated with honey and bee products, such as antioxidant and antimicrobial properties, further fuels market growth. Moreover, the growing popularity of beekeeping as a hobby and for sustainable agricultural practices contributes to the market's expansion. However, factors such as the decline in bee populations due to habitat loss, pesticide use, and climate change pose significant restraints on market growth. The market is segmented by product type (honey, beeswax, live bees, others) and application (medical, food & beverages, cosmetics, others). While honey dominates the product segment, the demand for beeswax in cosmetics and other industries is steadily increasing. Geographically, North America and Europe currently hold significant market share, but the Asia-Pacific region is expected to witness substantial growth in the coming years due to rising disposable incomes and changing consumer preferences. Major players in the market include established honey and beeswax producers, beekeeping equipment suppliers, and companies specializing in bee-derived products for various applications. Competition is expected to intensify as new entrants explore innovative products and sustainable beekeeping practices.
The forecast for 2025-2033 indicates a continuous, albeit moderate, expansion of the apiculture market. This growth will likely be driven by continued demand for natural products and ongoing innovation within the industry. The market will likely see further consolidation as larger companies acquire smaller players, leading to increased market concentration. Furthermore, advancements in beekeeping technology and sustainable farming practices are anticipated to play a crucial role in mitigating the negative impacts of environmental factors on bee populations and thereby contribute positively to long-term market growth. Regional variations in growth will persist, reflecting differing consumer preferences, economic conditions, and environmental challenges. A strategic focus on addressing the challenges posed by bee population decline and promoting sustainable beekeeping practices is crucial for the long-term health and growth of the apiculture market.
Apiculture Market: A Comprehensive Report (2019-2033)
This detailed report provides a comprehensive analysis of the global apiculture market, encompassing market size, growth projections, key segments, leading players, and emerging trends from 2019 to 2033. The study period covers the historical period (2019-2024), the base year (2025), and the forecast period (2025-2033), with an estimated year of 2025. The report is designed to provide actionable insights for industry stakeholders, investors, and businesses operating within the apiculture sector. The market is segmented by product type (Honey, Beeswax, Live Bees, Others) and application (Medical, Food & Beverages, Cosmetics, Others). The total market value is projected to reach xx Million by 2033.
Apiculture Market Market Concentration & Innovation
The apiculture market exhibits a moderately concentrated structure, with a few large players holding significant market share, alongside numerous smaller, regional operators. Market share data for 2024 indicates that the top five companies collectively hold approximately xx% of the global market. However, the market is also characterized by a high degree of fragmentation, particularly in the live bee segment.
Innovation is a key driver within the apiculture market, fueled by advancements in beekeeping techniques, honey processing, and the development of value-added products. Key innovations include:
- Sustainable beekeeping practices that focus on enhancing bee health and environmental protection.
- Technological advancements in hive monitoring and management, such as smart hive technologies.
- Development of novel bee products and applications in areas like cosmetics and pharmaceuticals.
Regulatory frameworks play a significant role, impacting product safety, labeling, and trade. The presence of substitute products, such as artificial sweeteners and other natural alternatives, poses a competitive challenge. End-user trends, such as growing health consciousness and demand for natural products, are positively influencing market growth. M&A activities, such as the Nature Nate's merger with Sweet Harvest Foods in January 2022 (Deal Value: xx Million), demonstrate consolidation trends within the sector. Further M&A activities are anticipated to reshape the market landscape in the coming years.
Apiculture Market Industry Trends & Insights
The global apiculture market is experiencing robust growth, driven by several factors. The rising consumer preference for natural and organic products is a key driver, particularly in the food and beverage sector. The growing awareness of honey's health benefits, coupled with the increasing popularity of bee-derived products like propolis and beeswax in cosmetics and pharmaceuticals, is significantly contributing to the market expansion. The estimated CAGR for the period 2025-2033 is projected at xx%, indicating substantial market expansion.
Technological advancements, including improved beekeeping techniques and hive monitoring systems, enhance productivity and efficiency. However, disruptions such as climate change and bee colony collapse disorder (CCD) pose significant challenges. Competitive dynamics are intense, with established players focusing on product diversification and innovation to maintain their market positions. The market penetration of organic and sustainably sourced honey and bee products is increasing rapidly, reflecting changing consumer preferences. The market is witnessing a shift towards traceability and transparency in the supply chain, with certifications like the True Source Honey Certification Program gaining traction.
Dominant Markets & Segments in Apiculture Market
The apiculture market is geographically diverse, with significant variations in production and consumption patterns across regions. Currently, xx is the leading region in the global apiculture market, driven by factors such as favorable climatic conditions, a large beekeeping population, and robust government support. Within this region, xx emerges as a dominant country.
- Key Drivers in xx:
- Supportive government policies promoting apiculture development.
- Well-established infrastructure for honey production and processing.
- High per capita consumption of honey and bee products.
Product Type Dominance: Honey dominates the apiculture market by volume and value, owing to its widespread consumption as a food and beverage product. However, the beeswax segment is exhibiting strong growth potential driven by its applications in cosmetics and other industries. The live bee segment is also expanding owing to the increased demand for pollination services, particularly in agricultural sector.
Application Dominance: The food and beverage sector dominates the applications of apiculture products, followed by the cosmetics sector, which is witnessing significant growth due to the increasing demand for natural and organic beauty products. The medical application segment is also showing significant growth potential.
Apiculture Market Product Developments
Recent product innovations focus on value-added honey products, such as specialized honey blends, honey-infused beverages, and honey-based skincare products. Beeswax finds increasing applications in cosmetics, candles, and other industrial uses. Technological trends include the development of smart hive technology for improved monitoring and management of bee colonies. These innovations cater to evolving consumer preferences for natural, healthy, and sustainably sourced products, enhancing their market fit and competitive advantage.
Report Scope & Segmentation Analysis
This report segments the apiculture market based on product type (Honey, Beeswax, Live Bees, Others) and application (Medical, Food & Beverages, Cosmetics, Others).
Product Type: The honey segment is projected to dominate, exhibiting a steady growth rate. Beeswax is anticipated to show robust growth due to diverse applications, while live bees see consistent demand but with potential regional variations. The "Others" category includes propolis, royal jelly, and other bee products, showing promising growth.
Application: Food and beverages will remain the dominant application, with growth driven by increasing demand for natural sweeteners. Cosmetics and medical applications showcase high growth potential, fueled by increasing awareness of bee products' therapeutic and cosmetic properties.
Key Drivers of Apiculture Market Growth
Several factors drive apiculture market growth: rising consumer demand for natural and organic products, increasing awareness of honey's health benefits, expanding applications in various industries (cosmetics, pharmaceuticals), and technological advancements in beekeeping and honey processing. Government support in some regions, coupled with growing demand for pollination services, further fuels market expansion.
Challenges in the Apiculture Market Sector
The apiculture market faces challenges such as climate change negatively impacting bee populations, disease outbreaks affecting bee colonies, and fluctuating honey prices due to seasonality and production variations. Supply chain disruptions and increasing competition from substitute products also hinder market growth. The high initial investment required to establish a successful apiculture operation serves as a barrier to entry for some potential market participants. Regulations concerning honey purity and labeling pose additional obstacles for some businesses.
Emerging Opportunities in Apiculture Market
Emerging opportunities include the development of new bee products, such as functional honey and propolis-based supplements, expansion into new markets with high growth potential, and harnessing technological advancements for improved beekeeping practices. The increasing demand for sustainable and ethically sourced bee products presents a significant opportunity for businesses adopting such practices. Moreover, the expansion of apiculture into urban areas offers untapped potential.
Leading Players in the Apiculture Market Market
- Beeswax From Beekeepers
- Betterbee
- Bartnik LLC
- Miller's Honey
- EURL Atlantic Apiculture
- Arnold honey bee services
- Clearskys
- PhytoPharma International Ltd (Bee-Fuse Technology)
- Beehive Botanicals
- Pastili Limited
Key Developments in Apiculture Market Industry
- April 2021: Billy Bee and Doyon (McCormick & Company Inc.) announced 100% Canadian honey sourcing, emphasizing ethical and legal sourcing.
- March 2021: Comvita opened a state-of-the-art Wellness Lab, showcasing its commitment to apiculture-based products.
- January 2022: Nature Nate's merged with Sweet Harvest Foods, a significant consolidation within the supply chain.
Strategic Outlook for Apiculture Market Market
The apiculture market is poised for continued growth, driven by sustained consumer demand, innovation in product development, and expansion into new applications. Opportunities exist in value-added product development, sustainable beekeeping practices, and technological advancements. Focusing on traceability and transparency in the supply chain will be crucial for success. The market's future growth hinges on addressing challenges related to bee health, climate change, and ensuring ethical and sustainable practices.
Apiculture Market Segmentation
-
1. Product Type
- 1.1. Honey
- 1.2. Beeswax
- 1.3. Live-bees
- 1.4. Others
-
2. Application
- 2.1. Medical
- 2.2. Food Beverages
- 2.3. Cosmetics
- 2.4. Others
Apiculture Market Segmentation By Geography
-
1. North America
- 1.1. United States
- 1.2. Canada
- 1.3. Mexico
- 1.4. Rest of North America
-
2. Europe
- 2.1. Germany
- 2.2. United Kingdom
- 2.3. France
- 2.4. Russia
- 2.5. Spain
- 2.6. Rest of Europe
-
3. Asia Pacific
- 3.1. China
- 3.2. Japan
- 3.3. India
- 3.4. South Korea
- 3.5. Rest of Asia Pacific
-
4. South America
- 4.1. Brazil
- 4.2. Argentina
- 4.3. Rest of South America
-
5. Middle East and Africa
- 5.1. United Arab Emirates
- 5.2. South Africa
- 5.3. Rest of Middle East and Africa
Apiculture Market REPORT HIGHLIGHTS
| Aspects | Details |
|---|---|
| Study Period | 2019-2033 |
| Base Year | 2024 |
| Estimated Year | 2025 |
| Forecast Period | 2025-2033 |
| Historical Period | 2019-2024 |
| Growth Rate | CAGR of 4.30% from 2019-2033 |
| Segmentation |
|
Table of Contents
- 1. Introduction
- 1.1. Research Scope
- 1.2. Market Segmentation
- 1.3. Research Methodology
- 1.4. Definitions and Assumptions
- 2. Executive Summary
- 2.1. Introduction
- 3. Market Dynamics
- 3.1. Introduction
- 3.2. Market Drivers
- 3.2.1. Rising Trend of Ingestible Beauty Products; Growing demand for Nutrient-Enriched Cosmetic Products
- 3.3. Market Restrains
- 3.3.1. Availability of Counterfeit Beauty Supplements Products
- 3.4. Market Trends
- 3.4.1. Honey Emerges As a Functional Sweetener
- 4. Market Factor Analysis
- 4.1. Porters Five Forces
- 4.2. Supply/Value Chain
- 4.3. PESTEL analysis
- 4.4. Market Entropy
- 4.5. Patent/Trademark Analysis
- 5. Global Apiculture Market Analysis, Insights and Forecast, 2019-2031
- 5.1. Market Analysis, Insights and Forecast - by Product Type
- 5.1.1. Honey
- 5.1.2. Beeswax
- 5.1.3. Live-bees
- 5.1.4. Others
- 5.2. Market Analysis, Insights and Forecast - by Application
- 5.2.1. Medical
- 5.2.2. Food Beverages
- 5.2.3. Cosmetics
- 5.2.4. Others
- 5.3. Market Analysis, Insights and Forecast - by Region
- 5.3.1. North America
- 5.3.2. Europe
- 5.3.3. Asia Pacific
- 5.3.4. South America
- 5.3.5. Middle East and Africa
- 5.1. Market Analysis, Insights and Forecast - by Product Type
- 6. North America Apiculture Market Analysis, Insights and Forecast, 2019-2031
- 6.1. Market Analysis, Insights and Forecast - by Product Type
- 6.1.1. Honey
- 6.1.2. Beeswax
- 6.1.3. Live-bees
- 6.1.4. Others
- 6.2. Market Analysis, Insights and Forecast - by Application
- 6.2.1. Medical
- 6.2.2. Food Beverages
- 6.2.3. Cosmetics
- 6.2.4. Others
- 6.1. Market Analysis, Insights and Forecast - by Product Type
- 7. Europe Apiculture Market Analysis, Insights and Forecast, 2019-2031
- 7.1. Market Analysis, Insights and Forecast - by Product Type
- 7.1.1. Honey
- 7.1.2. Beeswax
- 7.1.3. Live-bees
- 7.1.4. Others
- 7.2. Market Analysis, Insights and Forecast - by Application
- 7.2.1. Medical
- 7.2.2. Food Beverages
- 7.2.3. Cosmetics
- 7.2.4. Others
- 7.1. Market Analysis, Insights and Forecast - by Product Type
- 8. Asia Pacific Apiculture Market Analysis, Insights and Forecast, 2019-2031
- 8.1. Market Analysis, Insights and Forecast - by Product Type
- 8.1.1. Honey
- 8.1.2. Beeswax
- 8.1.3. Live-bees
- 8.1.4. Others
- 8.2. Market Analysis, Insights and Forecast - by Application
- 8.2.1. Medical
- 8.2.2. Food Beverages
- 8.2.3. Cosmetics
- 8.2.4. Others
- 8.1. Market Analysis, Insights and Forecast - by Product Type
- 9. South America Apiculture Market Analysis, Insights and Forecast, 2019-2031
- 9.1. Market Analysis, Insights and Forecast - by Product Type
- 9.1.1. Honey
- 9.1.2. Beeswax
- 9.1.3. Live-bees
- 9.1.4. Others
- 9.2. Market Analysis, Insights and Forecast - by Application
- 9.2.1. Medical
- 9.2.2. Food Beverages
- 9.2.3. Cosmetics
- 9.2.4. Others
- 9.1. Market Analysis, Insights and Forecast - by Product Type
- 10. Middle East and Africa Apiculture Market Analysis, Insights and Forecast, 2019-2031
- 10.1. Market Analysis, Insights and Forecast - by Product Type
- 10.1.1. Honey
- 10.1.2. Beeswax
- 10.1.3. Live-bees
- 10.1.4. Others
- 10.2. Market Analysis, Insights and Forecast - by Application
- 10.2.1. Medical
- 10.2.2. Food Beverages
- 10.2.3. Cosmetics
- 10.2.4. Others
- 10.1. Market Analysis, Insights and Forecast - by Product Type
- 11. North America Apiculture Market Analysis, Insights and Forecast, 2019-2031
- 11.1. Market Analysis, Insights and Forecast - By Country/Sub-region
- 11.1.1 United States
- 11.1.2 Canada
- 11.1.3 Mexico
- 11.1.4 Rest of North America
- 12. Europe Apiculture Market Analysis, Insights and Forecast, 2019-2031
- 12.1. Market Analysis, Insights and Forecast - By Country/Sub-region
- 12.1.1 Germany
- 12.1.2 United Kingdom
- 12.1.3 France
- 12.1.4 Russia
- 12.1.5 Spain
- 12.1.6 Rest of Europe
- 13. Asia Pacific Apiculture Market Analysis, Insights and Forecast, 2019-2031
- 13.1. Market Analysis, Insights and Forecast - By Country/Sub-region
- 13.1.1 China
- 13.1.2 Japan
- 13.1.3 India
- 13.1.4 South Korea
- 13.1.5 Rest of Asia Pacific
- 14. South America Apiculture Market Analysis, Insights and Forecast, 2019-2031
- 14.1. Market Analysis, Insights and Forecast - By Country/Sub-region
- 14.1.1 Brazil
- 14.1.2 Argentina
- 14.1.3 Rest of South America
- 15. Middle East and Africa Apiculture Market Analysis, Insights and Forecast, 2019-2031
- 15.1. Market Analysis, Insights and Forecast - By Country/Sub-region
- 15.1.1 United Arab Emirates
- 15.1.2 South Africa
- 15.1.3 Rest of Middle East and Africa
- 16. Competitive Analysis
- 16.1. Global Market Share Analysis 2024
- 16.2. Company Profiles
- 16.2.1 Beeswax From Beekeepers
- 16.2.1.1. Overview
- 16.2.1.2. Products
- 16.2.1.3. SWOT Analysis
- 16.2.1.4. Recent Developments
- 16.2.1.5. Financials (Based on Availability)
- 16.2.2 Betterbee
- 16.2.2.1. Overview
- 16.2.2.2. Products
- 16.2.2.3. SWOT Analysis
- 16.2.2.4. Recent Developments
- 16.2.2.5. Financials (Based on Availability)
- 16.2.3 Bartnik LLC
- 16.2.3.1. Overview
- 16.2.3.2. Products
- 16.2.3.3. SWOT Analysis
- 16.2.3.4. Recent Developments
- 16.2.3.5. Financials (Based on Availability)
- 16.2.4 Miller's Honey
- 16.2.4.1. Overview
- 16.2.4.2. Products
- 16.2.4.3. SWOT Analysis
- 16.2.4.4. Recent Developments
- 16.2.4.5. Financials (Based on Availability)
- 16.2.5 EURL Atlantic Apiculture
- 16.2.5.1. Overview
- 16.2.5.2. Products
- 16.2.5.3. SWOT Analysis
- 16.2.5.4. Recent Developments
- 16.2.5.5. Financials (Based on Availability)
- 16.2.6 Arnold honey bee services
- 16.2.6.1. Overview
- 16.2.6.2. Products
- 16.2.6.3. SWOT Analysis
- 16.2.6.4. Recent Developments
- 16.2.6.5. Financials (Based on Availability)
- 16.2.7 Clearskys
- 16.2.7.1. Overview
- 16.2.7.2. Products
- 16.2.7.3. SWOT Analysis
- 16.2.7.4. Recent Developments
- 16.2.7.5. Financials (Based on Availability)
- 16.2.8 PhytoPharma International Ltd (Bee-Fuse Technology)*List Not Exhaustive
- 16.2.8.1. Overview
- 16.2.8.2. Products
- 16.2.8.3. SWOT Analysis
- 16.2.8.4. Recent Developments
- 16.2.8.5. Financials (Based on Availability)
- 16.2.9 Beehive Botanicals
- 16.2.9.1. Overview
- 16.2.9.2. Products
- 16.2.9.3. SWOT Analysis
- 16.2.9.4. Recent Developments
- 16.2.9.5. Financials (Based on Availability)
- 16.2.10 Pastili Limited
- 16.2.10.1. Overview
- 16.2.10.2. Products
- 16.2.10.3. SWOT Analysis
- 16.2.10.4. Recent Developments
- 16.2.10.5. Financials (Based on Availability)
- 16.2.1 Beeswax From Beekeepers
List of Figures
- Figure 1: Global Apiculture Market Revenue Breakdown (Million, %) by Region 2024 & 2032
- Figure 2: North America Apiculture Market Revenue (Million), by Country 2024 & 2032
- Figure 3: North America Apiculture Market Revenue Share (%), by Country 2024 & 2032
- Figure 4: Europe Apiculture Market Revenue (Million), by Country 2024 & 2032
- Figure 5: Europe Apiculture Market Revenue Share (%), by Country 2024 & 2032
- Figure 6: Asia Pacific Apiculture Market Revenue (Million), by Country 2024 & 2032
- Figure 7: Asia Pacific Apiculture Market Revenue Share (%), by Country 2024 & 2032
- Figure 8: South America Apiculture Market Revenue (Million), by Country 2024 & 2032
- Figure 9: South America Apiculture Market Revenue Share (%), by Country 2024 & 2032
- Figure 10: Middle East and Africa Apiculture Market Revenue (Million), by Country 2024 & 2032
- Figure 11: Middle East and Africa Apiculture Market Revenue Share (%), by Country 2024 & 2032
- Figure 12: North America Apiculture Market Revenue (Million), by Product Type 2024 & 2032
- Figure 13: North America Apiculture Market Revenue Share (%), by Product Type 2024 & 2032
- Figure 14: North America Apiculture Market Revenue (Million), by Application 2024 & 2032
- Figure 15: North America Apiculture Market Revenue Share (%), by Application 2024 & 2032
- Figure 16: North America Apiculture Market Revenue (Million), by Country 2024 & 2032
- Figure 17: North America Apiculture Market Revenue Share (%), by Country 2024 & 2032
- Figure 18: Europe Apiculture Market Revenue (Million), by Product Type 2024 & 2032
- Figure 19: Europe Apiculture Market Revenue Share (%), by Product Type 2024 & 2032
- Figure 20: Europe Apiculture Market Revenue (Million), by Application 2024 & 2032
- Figure 21: Europe Apiculture Market Revenue Share (%), by Application 2024 & 2032
- Figure 22: Europe Apiculture Market Revenue (Million), by Country 2024 & 2032
- Figure 23: Europe Apiculture Market Revenue Share (%), by Country 2024 & 2032
- Figure 24: Asia Pacific Apiculture Market Revenue (Million), by Product Type 2024 & 2032
- Figure 25: Asia Pacific Apiculture Market Revenue Share (%), by Product Type 2024 & 2032
- Figure 26: Asia Pacific Apiculture Market Revenue (Million), by Application 2024 & 2032
- Figure 27: Asia Pacific Apiculture Market Revenue Share (%), by Application 2024 & 2032
- Figure 28: Asia Pacific Apiculture Market Revenue (Million), by Country 2024 & 2032
- Figure 29: Asia Pacific Apiculture Market Revenue Share (%), by Country 2024 & 2032
- Figure 30: South America Apiculture Market Revenue (Million), by Product Type 2024 & 2032
- Figure 31: South America Apiculture Market Revenue Share (%), by Product Type 2024 & 2032
- Figure 32: South America Apiculture Market Revenue (Million), by Application 2024 & 2032
- Figure 33: South America Apiculture Market Revenue Share (%), by Application 2024 & 2032
- Figure 34: South America Apiculture Market Revenue (Million), by Country 2024 & 2032
- Figure 35: South America Apiculture Market Revenue Share (%), by Country 2024 & 2032
- Figure 36: Middle East and Africa Apiculture Market Revenue (Million), by Product Type 2024 & 2032
- Figure 37: Middle East and Africa Apiculture Market Revenue Share (%), by Product Type 2024 & 2032
- Figure 38: Middle East and Africa Apiculture Market Revenue (Million), by Application 2024 & 2032
- Figure 39: Middle East and Africa Apiculture Market Revenue Share (%), by Application 2024 & 2032
- Figure 40: Middle East and Africa Apiculture Market Revenue (Million), by Country 2024 & 2032
- Figure 41: Middle East and Africa Apiculture Market Revenue Share (%), by Country 2024 & 2032
List of Tables
- Table 1: Global Apiculture Market Revenue Million Forecast, by Region 2019 & 2032
- Table 2: Global Apiculture Market Revenue Million Forecast, by Product Type 2019 & 2032
- Table 3: Global Apiculture Market Revenue Million Forecast, by Application 2019 & 2032
- Table 4: Global Apiculture Market Revenue Million Forecast, by Region 2019 & 2032
- Table 5: Global Apiculture Market Revenue Million Forecast, by Country 2019 & 2032
- Table 6: United States Apiculture Market Revenue (Million) Forecast, by Application 2019 & 2032
- Table 7: Canada Apiculture Market Revenue (Million) Forecast, by Application 2019 & 2032
- Table 8: Mexico Apiculture Market Revenue (Million) Forecast, by Application 2019 & 2032
- Table 9: Rest of North America Apiculture Market Revenue (Million) Forecast, by Application 2019 & 2032
- Table 10: Global Apiculture Market Revenue Million Forecast, by Country 2019 & 2032
- Table 11: Germany Apiculture Market Revenue (Million) Forecast, by Application 2019 & 2032
- Table 12: United Kingdom Apiculture Market Revenue (Million) Forecast, by Application 2019 & 2032
- Table 13: France Apiculture Market Revenue (Million) Forecast, by Application 2019 & 2032
- Table 14: Russia Apiculture Market Revenue (Million) Forecast, by Application 2019 & 2032
- Table 15: Spain Apiculture Market Revenue (Million) Forecast, by Application 2019 & 2032
- Table 16: Rest of Europe Apiculture Market Revenue (Million) Forecast, by Application 2019 & 2032
- Table 17: Global Apiculture Market Revenue Million Forecast, by Country 2019 & 2032
- Table 18: China Apiculture Market Revenue (Million) Forecast, by Application 2019 & 2032
- Table 19: Japan Apiculture Market Revenue (Million) Forecast, by Application 2019 & 2032
- Table 20: India Apiculture Market Revenue (Million) Forecast, by Application 2019 & 2032
- Table 21: South Korea Apiculture Market Revenue (Million) Forecast, by Application 2019 & 2032
- Table 22: Rest of Asia Pacific Apiculture Market Revenue (Million) Forecast, by Application 2019 & 2032
- Table 23: Global Apiculture Market Revenue Million Forecast, by Country 2019 & 2032
- Table 24: Brazil Apiculture Market Revenue (Million) Forecast, by Application 2019 & 2032
- Table 25: Argentina Apiculture Market Revenue (Million) Forecast, by Application 2019 & 2032
- Table 26: Rest of South America Apiculture Market Revenue (Million) Forecast, by Application 2019 & 2032
- Table 27: Global Apiculture Market Revenue Million Forecast, by Country 2019 & 2032
- Table 28: United Arab Emirates Apiculture Market Revenue (Million) Forecast, by Application 2019 & 2032
- Table 29: South Africa Apiculture Market Revenue (Million) Forecast, by Application 2019 & 2032
- Table 30: Rest of Middle East and Africa Apiculture Market Revenue (Million) Forecast, by Application 2019 & 2032
- Table 31: Global Apiculture Market Revenue Million Forecast, by Product Type 2019 & 2032
- Table 32: Global Apiculture Market Revenue Million Forecast, by Application 2019 & 2032
- Table 33: Global Apiculture Market Revenue Million Forecast, by Country 2019 & 2032
- Table 34: United States Apiculture Market Revenue (Million) Forecast, by Application 2019 & 2032
- Table 35: Canada Apiculture Market Revenue (Million) Forecast, by Application 2019 & 2032
- Table 36: Mexico Apiculture Market Revenue (Million) Forecast, by Application 2019 & 2032
- Table 37: Rest of North America Apiculture Market Revenue (Million) Forecast, by Application 2019 & 2032
- Table 38: Global Apiculture Market Revenue Million Forecast, by Product Type 2019 & 2032
- Table 39: Global Apiculture Market Revenue Million Forecast, by Application 2019 & 2032
- Table 40: Global Apiculture Market Revenue Million Forecast, by Country 2019 & 2032
- Table 41: Germany Apiculture Market Revenue (Million) Forecast, by Application 2019 & 2032
- Table 42: United Kingdom Apiculture Market Revenue (Million) Forecast, by Application 2019 & 2032
- Table 43: France Apiculture Market Revenue (Million) Forecast, by Application 2019 & 2032
- Table 44: Russia Apiculture Market Revenue (Million) Forecast, by Application 2019 & 2032
- Table 45: Spain Apiculture Market Revenue (Million) Forecast, by Application 2019 & 2032
- Table 46: Rest of Europe Apiculture Market Revenue (Million) Forecast, by Application 2019 & 2032
- Table 47: Global Apiculture Market Revenue Million Forecast, by Product Type 2019 & 2032
- Table 48: Global Apiculture Market Revenue Million Forecast, by Application 2019 & 2032
- Table 49: Global Apiculture Market Revenue Million Forecast, by Country 2019 & 2032
- Table 50: China Apiculture Market Revenue (Million) Forecast, by Application 2019 & 2032
- Table 51: Japan Apiculture Market Revenue (Million) Forecast, by Application 2019 & 2032
- Table 52: India Apiculture Market Revenue (Million) Forecast, by Application 2019 & 2032
- Table 53: South Korea Apiculture Market Revenue (Million) Forecast, by Application 2019 & 2032
- Table 54: Rest of Asia Pacific Apiculture Market Revenue (Million) Forecast, by Application 2019 & 2032
- Table 55: Global Apiculture Market Revenue Million Forecast, by Product Type 2019 & 2032
- Table 56: Global Apiculture Market Revenue Million Forecast, by Application 2019 & 2032
- Table 57: Global Apiculture Market Revenue Million Forecast, by Country 2019 & 2032
- Table 58: Brazil Apiculture Market Revenue (Million) Forecast, by Application 2019 & 2032
- Table 59: Argentina Apiculture Market Revenue (Million) Forecast, by Application 2019 & 2032
- Table 60: Rest of South America Apiculture Market Revenue (Million) Forecast, by Application 2019 & 2032
- Table 61: Global Apiculture Market Revenue Million Forecast, by Product Type 2019 & 2032
- Table 62: Global Apiculture Market Revenue Million Forecast, by Application 2019 & 2032
- Table 63: Global Apiculture Market Revenue Million Forecast, by Country 2019 & 2032
- Table 64: United Arab Emirates Apiculture Market Revenue (Million) Forecast, by Application 2019 & 2032
- Table 65: South Africa Apiculture Market Revenue (Million) Forecast, by Application 2019 & 2032
- Table 66: Rest of Middle East and Africa Apiculture Market Revenue (Million) Forecast, by Application 2019 & 2032
Frequently Asked Questions
1. What is the projected Compound Annual Growth Rate (CAGR) of the Apiculture Market?
The projected CAGR is approximately 4.30%.
2. Which companies are prominent players in the Apiculture Market?
Key companies in the market include Beeswax From Beekeepers, Betterbee, Bartnik LLC, Miller's Honey, EURL Atlantic Apiculture, Arnold honey bee services, Clearskys, PhytoPharma International Ltd (Bee-Fuse Technology)*List Not Exhaustive, Beehive Botanicals, Pastili Limited.
3. What are the main segments of the Apiculture Market?
The market segments include Product Type, Application.
4. Can you provide details about the market size?
The market size is estimated to be USD XX Million as of 2022.
5. What are some drivers contributing to market growth?
Rising Trend of Ingestible Beauty Products; Growing demand for Nutrient-Enriched Cosmetic Products.
6. What are the notable trends driving market growth?
Honey Emerges As a Functional Sweetener.
7. Are there any restraints impacting market growth?
Availability of Counterfeit Beauty Supplements Products.
8. Can you provide examples of recent developments in the market?
January 2022: Nature Nate's merged with Cannon Falls, Minnesota-based Sweet Harvest Foods, an independent private equity business that invests in supply chain and agricultural production enterprises on a controlling basis.
9. What pricing options are available for accessing the report?
Pricing options include single-user, multi-user, and enterprise licenses priced at USD 4750, USD 5250, and USD 8750 respectively.
10. Is the market size provided in terms of value or volume?
The market size is provided in terms of value, measured in Million.
11. Are there any specific market keywords associated with the report?
Yes, the market keyword associated with the report is "Apiculture Market," which aids in identifying and referencing the specific market segment covered.
12. How do I determine which pricing option suits my needs best?
The pricing options vary based on user requirements and access needs. Individual users may opt for single-user licenses, while businesses requiring broader access may choose multi-user or enterprise licenses for cost-effective access to the report.
13. Are there any additional resources or data provided in the Apiculture Market report?
While the report offers comprehensive insights, it's advisable to review the specific contents or supplementary materials provided to ascertain if additional resources or data are available.
14. How can I stay updated on further developments or reports in the Apiculture Market?
To stay informed about further developments, trends, and reports in the Apiculture Market, consider subscribing to industry newsletters, following relevant companies and organizations, or regularly checking reputable industry news sources and publications.
Methodology
Step 1 - Identification of Relevant Samples Size from Population Database


Step 2 - Approaches for Defining Global Market Size (Value, Volume* & Price*)

Note*: In applicable scenarios
Step 3 - Data Sources
Primary Research
- Web Analytics
- Survey Reports
- Research Institute
- Latest Research Reports
- Opinion Leaders
Secondary Research
- Annual Reports
- White Paper
- Latest Press Release
- Industry Association
- Paid Database
- Investor Presentations

Step 4 - Data Triangulation
Involves using different sources of information in order to increase the validity of a study
These sources are likely to be stakeholders in a program - participants, other researchers, program staff, other community members, and so on.
Then we put all data in single framework & apply various statistical tools to find out the dynamic on the market.
During the analysis stage, feedback from the stakeholder groups would be compared to determine areas of agreement as well as areas of divergence


