
Key Insights
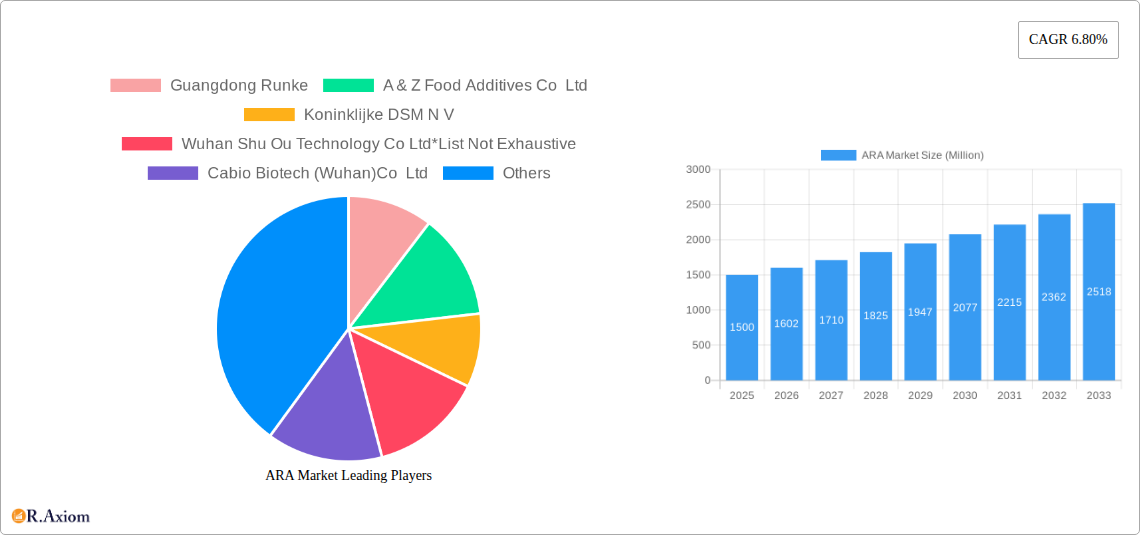
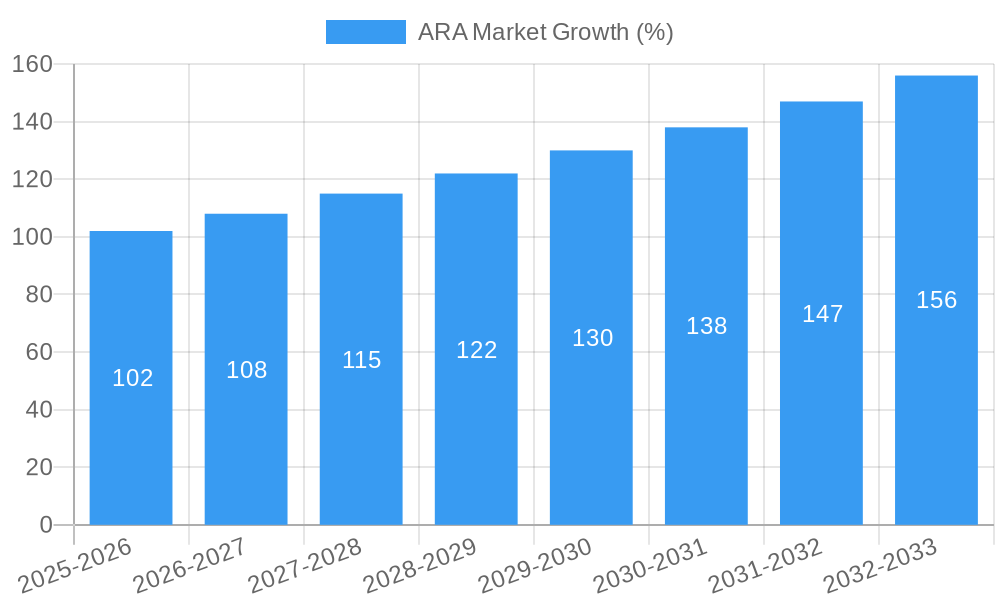
The global market for Arachidonic Acid (ARA) is experiencing robust growth, projected to reach a significant value over the forecast period (2025-2033). A Compound Annual Growth Rate (CAGR) of 6.80% indicates a consistently expanding market driven by several key factors. The increasing demand for ARA in food and beverage products, particularly infant formulas enriched with this essential fatty acid, is a major contributor to this growth. The rising awareness of ARA's crucial role in brain development and cognitive function, particularly in infants and young children, fuels the demand in dietary supplements and pharmaceutical applications. Furthermore, the expanding nutraceutical market, alongside the increasing prevalence of chronic diseases linked to fatty acid deficiencies, further propels market expansion. The dry form of ARA currently dominates the market, owing to its ease of handling and storage, although the liquid form is gaining traction due to improved bioavailability and incorporation into diverse applications. Key players like Guangdong Runke, DSM, and Cargill are strategically positioning themselves within this expanding market, driving innovation and product diversification. Regional growth varies, with North America and Asia Pacific anticipated to lead due to high consumer awareness, robust healthcare infrastructure, and growing disposable incomes. However, stringent regulatory frameworks and concerns about potential side effects might present challenges in certain regions.
The segmentation of the ARA market into animal and plant sources reflects evolving consumer preferences and sustainability concerns. While animal-derived ARA historically held a larger share, plant-based alternatives are experiencing significant growth due to the increasing demand for vegan and vegetarian products. This shift necessitates further research and development to enhance the efficiency and cost-effectiveness of plant-based ARA extraction and production. The geographical distribution of the market showcases opportunities across diverse regions, with developing economies exhibiting higher potential for future expansion driven by increasing awareness of health and wellness. Competitive pressures necessitate continuous innovation in production techniques and delivery methods to maintain market share, further solidifying the need for strategic partnerships and acquisitions within the industry.
ARA Market: A Comprehensive Report (2019-2033)
This in-depth report provides a comprehensive analysis of the global ARA (Arachidonic Acid) market, offering invaluable insights for industry stakeholders, investors, and strategic decision-makers. The report covers the period 2019-2033, with a focus on the forecast period 2025-2033, utilizing 2025 as the base and estimated year. The market size is projected in Millions across various segments.
ARA Market Concentration & Innovation
The global ARA market exhibits a moderately concentrated landscape, with a few key players commanding significant market share. Guangdong Runke, A & Z Food Additives Co Ltd, Koninklijke DSM N.V., and Cargill Inc. are among the prominent companies shaping market dynamics. However, the presence of numerous smaller players and emerging companies indicates a competitive environment. Market share data for 2024 suggests that the top 5 players collectively hold approximately xx% of the market, while the remaining share is distributed amongst numerous smaller participants.
Innovation within the ARA market is driven by advancements in extraction technologies, ensuring higher purity and yield. The development of novel formulations and applications, particularly in pharmaceuticals and dietary supplements, is a significant growth driver. Regulatory frameworks, particularly concerning food safety and labeling, significantly influence market dynamics. The presence of substitute products, such as other omega-6 fatty acids, creates competitive pressure. End-user trends, such as increasing health consciousness and demand for functional foods, fuel market growth. Mergers and acquisitions (M&A) activity within the sector has been moderate, with deal values averaging approximately $xx Million in recent years. Significant M&A activity is expected in the next few years, primarily driven by larger players seeking to expand their market share and product portfolios.
- Market Concentration: Top 5 players hold xx% market share (2024).
- Innovation Drivers: Advanced extraction technologies, novel formulations, expanding applications.
- Regulatory Landscape: Stringent food safety and labeling regulations.
- M&A Activity: Average deal value approximately $xx Million (2019-2024).
ARA Market Industry Trends & Insights
The global ARA market is experiencing robust growth, driven by several key factors. The increasing prevalence of chronic diseases, coupled with rising consumer awareness of the health benefits of ARA, is a primary driver. The expanding applications of ARA in pharmaceuticals, particularly in the treatment of inflammatory conditions, fuels market expansion. Technological advancements in extraction and purification methods are enhancing the efficiency and cost-effectiveness of ARA production. Consumer preferences for natural and functional food ingredients are also contributing to growth. However, competitive dynamics, including price fluctuations and the presence of substitute products, present challenges to market expansion. The CAGR for the ARA market is projected to be xx% during the forecast period (2025-2033). Market penetration remains relatively low, particularly in developing economies, presenting significant growth opportunities.
Dominant Markets & Segments in ARA Market
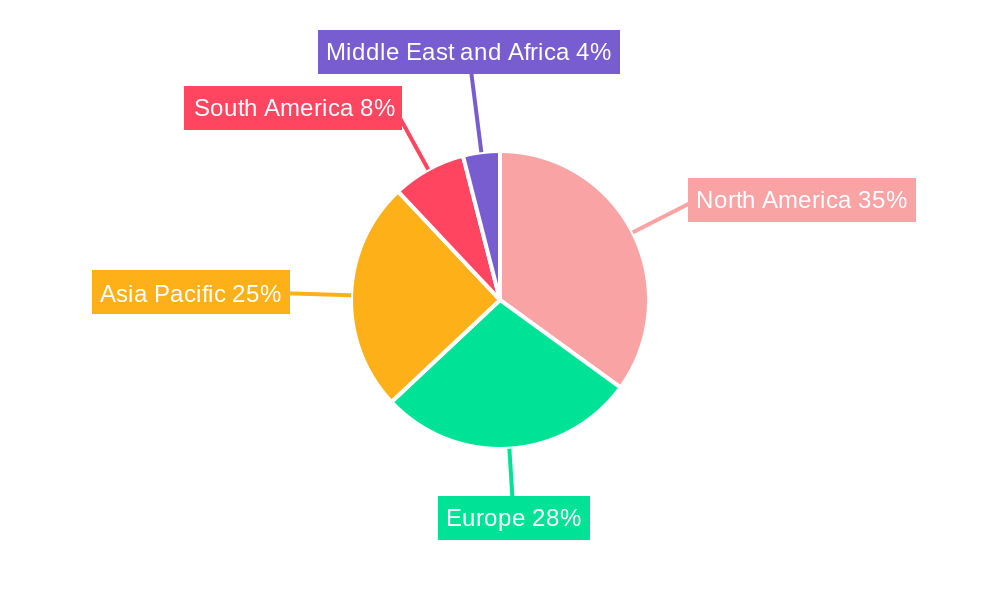
The North American region currently holds the dominant position in the global ARA market, driven by high consumer demand for dietary supplements and functional foods. Within this region, the United States accounts for the largest share. Key drivers include strong economic conditions, well-established healthcare infrastructure, and high consumer spending on health and wellness products.
- Leading Region: North America (United States dominant)
- Key Drivers (North America): Strong economy, advanced healthcare infrastructure, high consumer spending on health and wellness.
- Source: The Plant-sourced ARA segment is currently experiencing faster growth compared to Animal-sourced ARA due to increased consumer preference for plant-based alternatives.
- Form: The Dry form of ARA holds a larger market share due to its ease of handling, storage, and incorporation into various products.
- Application: The Food and Beverage segment currently commands the largest market share, however, the Pharmaceuticals segment is anticipated to showcase the highest growth rate driven by increased research and development in therapeutic applications of ARA.
ARA Market Product Developments
Recent product developments in the ARA market have focused on enhancing purity, improving stability, and developing novel delivery systems. Technological advancements in extraction and purification techniques have resulted in higher-quality ARA products with improved efficacy. The development of microencapsulated and liposomal formulations is enhancing the bioavailability and stability of ARA, expanding its applications in various industries. These developments cater to the growing demand for improved functional food ingredients and specialized pharmaceutical formulations.
Report Scope & Segmentation Analysis
This report provides a comprehensive segmentation analysis of the ARA market based on source (Animal, Plant), form (Dry, Liquid), and application (Food and Beverage, Dietary Supplements, Pharmaceuticals). Each segment is analyzed in detail, providing market size, growth projections, and competitive dynamics for the historical period (2019-2024) and the forecast period (2025-2033). The Plant-based segment is projected to exhibit faster growth due to increasing demand for natural and sustainable products. Dry form is expected to maintain dominance due to its convenience. The pharmaceutical application is projected to achieve the highest growth rate due to expanding clinical applications.
Key Drivers of ARA Market Growth
Several factors contribute to the growth of the ARA market:
- Rising health consciousness: Growing consumer awareness of the health benefits of ARA.
- Expanding applications: Increased use of ARA in various industries, especially in pharmaceuticals and functional foods.
- Technological advancements: Improved extraction and purification technologies leading to better product quality and cost reduction.
- Favorable regulatory environment: Supportive regulations promoting the use of ARA in food and pharmaceutical products (varies by region).
Challenges in the ARA Market Sector
The ARA market faces certain challenges including:
- Price volatility: Fluctuations in raw material prices affect profitability.
- Competition from substitutes: Other omega-6 fatty acids and alternative ingredients create competitive pressure.
- Regulatory hurdles: Varying regulatory frameworks across different regions pose challenges for market expansion.
- Supply chain disruptions: Potential disruptions in the supply chain can impact product availability and pricing.
Emerging Opportunities in ARA Market
The ARA market presents several promising opportunities:
- Expanding into new markets: Untapped potential in developing economies with rising disposable incomes.
- Developing novel applications: Exploration of new applications in cosmetics, nutraceuticals, and other sectors.
- Innovation in delivery systems: Development of improved delivery systems enhancing bioavailability and efficacy.
- Sustainable sourcing practices: Growing demand for sustainably sourced ARA will drive innovation and market growth.
Leading Players in the ARA Market Market
- Koninklijke DSM N.V.
- Cargill Inc.
- Merck Group
- Guangdong Runke
- A & Z Food Additives Co Ltd
- Wuhan Shu Ou Technology Co Ltd
- Cabio Biotech (Wuhan)Co Ltd
- Cayman Chemicals
Key Developments in ARA Market Industry
- 2023: Koninklijke DSM N.V. launched a new high-purity ARA product line.
- 2022: Cargill Inc. expanded its production capacity to meet rising demand.
- 2021: A & Z Food Additives Co Ltd secured a major contract for ARA supply to a leading pharmaceutical company. (Specific details are limited due to confidentiality)
Strategic Outlook for ARA Market Market
The ARA market is poised for significant growth in the coming years, driven by the factors discussed above. Continued innovation in product development, expansion into new applications, and the increasing health consciousness of consumers will all contribute to market expansion. Companies that effectively navigate the challenges, leverage emerging opportunities, and adopt sustainable practices are expected to gain a competitive advantage in this dynamic market. The market is projected to reach $xx Million by 2033, representing considerable growth potential for investors and industry participants.
ARA Market Segmentation
-
1. Source
- 1.1. Animal
- 1.2. Plant
-
2. Form
- 2.1. Dry
- 2.2. Liquid
-
3. Application
-
3.1. Food and Beverage
- 3.1.1. Infant Formula
- 3.1.2. Dietary Supplements
- 3.2. Pharmaceuticals
-
3.1. Food and Beverage
ARA Market Segmentation By Geography
-
1. North America
- 1.1. United States
- 1.2. Canada
- 1.3. Mexico
- 1.4. Rest of North America
-
2. Europe
- 2.1. Germany
- 2.2. United Kingdom
- 2.3. Italy
- 2.4. France
- 2.5. Russia
- 2.6. Spain
- 2.7. Rest of Europe
-
3. Asia Pacific
- 3.1. India
- 3.2. China
- 3.3. Australia
- 3.4. Japan
- 3.5. Rest of Asia Pacific
-
4. South America
- 4.1. Brazil
- 4.2. Argentina
- 4.3. Rest of South America
-
5. Middle East and Africa
- 5.1. South Africa
- 5.2. Saudi Arabia
- 5.3. Rest of Middle East and Africa
ARA Market REPORT HIGHLIGHTS
| Aspects | Details |
|---|---|
| Study Period | 2019-2033 |
| Base Year | 2024 |
| Estimated Year | 2025 |
| Forecast Period | 2025-2033 |
| Historical Period | 2019-2024 |
| Growth Rate | CAGR of 6.80% from 2019-2033 |
| Segmentation |
|
Table of Contents
- 1. Introduction
- 1.1. Research Scope
- 1.2. Market Segmentation
- 1.3. Research Methodology
- 1.4. Definitions and Assumptions
- 2. Executive Summary
- 2.1. Introduction
- 3. Market Dynamics
- 3.1. Introduction
- 3.2. Market Drivers
- 3.2.1. Increasing Demand for Low-Fat and Low-Calorie Food; Increasing Product Innovation
- 3.3. Market Restrains
- 3.3.1. ; Threat of New Entrants; Bargaining Power of Buyers/Consumers; Bargaining Power of Suppliers; Threat of Substitute Products; Degree Of Competition
- 3.4. Market Trends
- 3.4.1. Application of ARA in Infant Formula Increases
- 4. Market Factor Analysis
- 4.1. Porters Five Forces
- 4.2. Supply/Value Chain
- 4.3. PESTEL analysis
- 4.4. Market Entropy
- 4.5. Patent/Trademark Analysis
- 5. Global ARA Market Analysis, Insights and Forecast, 2019-2031
- 5.1. Market Analysis, Insights and Forecast - by Source
- 5.1.1. Animal
- 5.1.2. Plant
- 5.2. Market Analysis, Insights and Forecast - by Form
- 5.2.1. Dry
- 5.2.2. Liquid
- 5.3. Market Analysis, Insights and Forecast - by Application
- 5.3.1. Food and Beverage
- 5.3.1.1. Infant Formula
- 5.3.1.2. Dietary Supplements
- 5.3.2. Pharmaceuticals
- 5.3.1. Food and Beverage
- 5.4. Market Analysis, Insights and Forecast - by Region
- 5.4.1. North America
- 5.4.2. Europe
- 5.4.3. Asia Pacific
- 5.4.4. South America
- 5.4.5. Middle East and Africa
- 5.1. Market Analysis, Insights and Forecast - by Source
- 6. North America ARA Market Analysis, Insights and Forecast, 2019-2031
- 6.1. Market Analysis, Insights and Forecast - by Source
- 6.1.1. Animal
- 6.1.2. Plant
- 6.2. Market Analysis, Insights and Forecast - by Form
- 6.2.1. Dry
- 6.2.2. Liquid
- 6.3. Market Analysis, Insights and Forecast - by Application
- 6.3.1. Food and Beverage
- 6.3.1.1. Infant Formula
- 6.3.1.2. Dietary Supplements
- 6.3.2. Pharmaceuticals
- 6.3.1. Food and Beverage
- 6.1. Market Analysis, Insights and Forecast - by Source
- 7. Europe ARA Market Analysis, Insights and Forecast, 2019-2031
- 7.1. Market Analysis, Insights and Forecast - by Source
- 7.1.1. Animal
- 7.1.2. Plant
- 7.2. Market Analysis, Insights and Forecast - by Form
- 7.2.1. Dry
- 7.2.2. Liquid
- 7.3. Market Analysis, Insights and Forecast - by Application
- 7.3.1. Food and Beverage
- 7.3.1.1. Infant Formula
- 7.3.1.2. Dietary Supplements
- 7.3.2. Pharmaceuticals
- 7.3.1. Food and Beverage
- 7.1. Market Analysis, Insights and Forecast - by Source
- 8. Asia Pacific ARA Market Analysis, Insights and Forecast, 2019-2031
- 8.1. Market Analysis, Insights and Forecast - by Source
- 8.1.1. Animal
- 8.1.2. Plant
- 8.2. Market Analysis, Insights and Forecast - by Form
- 8.2.1. Dry
- 8.2.2. Liquid
- 8.3. Market Analysis, Insights and Forecast - by Application
- 8.3.1. Food and Beverage
- 8.3.1.1. Infant Formula
- 8.3.1.2. Dietary Supplements
- 8.3.2. Pharmaceuticals
- 8.3.1. Food and Beverage
- 8.1. Market Analysis, Insights and Forecast - by Source
- 9. South America ARA Market Analysis, Insights and Forecast, 2019-2031
- 9.1. Market Analysis, Insights and Forecast - by Source
- 9.1.1. Animal
- 9.1.2. Plant
- 9.2. Market Analysis, Insights and Forecast - by Form
- 9.2.1. Dry
- 9.2.2. Liquid
- 9.3. Market Analysis, Insights and Forecast - by Application
- 9.3.1. Food and Beverage
- 9.3.1.1. Infant Formula
- 9.3.1.2. Dietary Supplements
- 9.3.2. Pharmaceuticals
- 9.3.1. Food and Beverage
- 9.1. Market Analysis, Insights and Forecast - by Source
- 10. Middle East and Africa ARA Market Analysis, Insights and Forecast, 2019-2031
- 10.1. Market Analysis, Insights and Forecast - by Source
- 10.1.1. Animal
- 10.1.2. Plant
- 10.2. Market Analysis, Insights and Forecast - by Form
- 10.2.1. Dry
- 10.2.2. Liquid
- 10.3. Market Analysis, Insights and Forecast - by Application
- 10.3.1. Food and Beverage
- 10.3.1.1. Infant Formula
- 10.3.1.2. Dietary Supplements
- 10.3.2. Pharmaceuticals
- 10.3.1. Food and Beverage
- 10.1. Market Analysis, Insights and Forecast - by Source
- 11. North America ARA Market Analysis, Insights and Forecast, 2019-2031
- 11.1. Market Analysis, Insights and Forecast - By Country/Sub-region
- 11.1.1 United States
- 11.1.2 Canada
- 11.1.3 Mexico
- 11.1.4 Rest of North America
- 12. Europe ARA Market Analysis, Insights and Forecast, 2019-2031
- 12.1. Market Analysis, Insights and Forecast - By Country/Sub-region
- 12.1.1 Germany
- 12.1.2 United Kingdom
- 12.1.3 Italy
- 12.1.4 France
- 12.1.5 Russia
- 12.1.6 Spain
- 12.1.7 Rest of Europe
- 13. Asia Pacific ARA Market Analysis, Insights and Forecast, 2019-2031
- 13.1. Market Analysis, Insights and Forecast - By Country/Sub-region
- 13.1.1 India
- 13.1.2 China
- 13.1.3 Australia
- 13.1.4 Japan
- 13.1.5 Rest of Asia Pacific
- 14. South America ARA Market Analysis, Insights and Forecast, 2019-2031
- 14.1. Market Analysis, Insights and Forecast - By Country/Sub-region
- 14.1.1 Brazil
- 14.1.2 Argentina
- 14.1.3 Rest of South America
- 15. Middle East and Africa ARA Market Analysis, Insights and Forecast, 2019-2031
- 15.1. Market Analysis, Insights and Forecast - By Country/Sub-region
- 15.1.1 South Africa
- 15.1.2 Saudi Arabia
- 15.1.3 Rest of Middle East and Africa
- 16. Competitive Analysis
- 16.1. Global Market Share Analysis 2024
- 16.2. Company Profiles
- 16.2.1 Guangdong Runke
- 16.2.1.1. Overview
- 16.2.1.2. Products
- 16.2.1.3. SWOT Analysis
- 16.2.1.4. Recent Developments
- 16.2.1.5. Financials (Based on Availability)
- 16.2.2 A & Z Food Additives Co Ltd
- 16.2.2.1. Overview
- 16.2.2.2. Products
- 16.2.2.3. SWOT Analysis
- 16.2.2.4. Recent Developments
- 16.2.2.5. Financials (Based on Availability)
- 16.2.3 Koninklijke DSM N V
- 16.2.3.1. Overview
- 16.2.3.2. Products
- 16.2.3.3. SWOT Analysis
- 16.2.3.4. Recent Developments
- 16.2.3.5. Financials (Based on Availability)
- 16.2.4 Wuhan Shu Ou Technology Co Ltd*List Not Exhaustive
- 16.2.4.1. Overview
- 16.2.4.2. Products
- 16.2.4.3. SWOT Analysis
- 16.2.4.4. Recent Developments
- 16.2.4.5. Financials (Based on Availability)
- 16.2.5 Cabio Biotech (Wuhan)Co Ltd
- 16.2.5.1. Overview
- 16.2.5.2. Products
- 16.2.5.3. SWOT Analysis
- 16.2.5.4. Recent Developments
- 16.2.5.5. Financials (Based on Availability)
- 16.2.6 Cargill Inc
- 16.2.6.1. Overview
- 16.2.6.2. Products
- 16.2.6.3. SWOT Analysis
- 16.2.6.4. Recent Developments
- 16.2.6.5. Financials (Based on Availability)
- 16.2.7 Cayman Chemicals
- 16.2.7.1. Overview
- 16.2.7.2. Products
- 16.2.7.3. SWOT Analysis
- 16.2.7.4. Recent Developments
- 16.2.7.5. Financials (Based on Availability)
- 16.2.8 Merck Group
- 16.2.8.1. Overview
- 16.2.8.2. Products
- 16.2.8.3. SWOT Analysis
- 16.2.8.4. Recent Developments
- 16.2.8.5. Financials (Based on Availability)
- 16.2.1 Guangdong Runke
List of Figures
- Figure 1: Global ARA Market Revenue Breakdown (Million, %) by Region 2024 & 2032
- Figure 2: North America ARA Market Revenue (Million), by Country 2024 & 2032
- Figure 3: North America ARA Market Revenue Share (%), by Country 2024 & 2032
- Figure 4: Europe ARA Market Revenue (Million), by Country 2024 & 2032
- Figure 5: Europe ARA Market Revenue Share (%), by Country 2024 & 2032
- Figure 6: Asia Pacific ARA Market Revenue (Million), by Country 2024 & 2032
- Figure 7: Asia Pacific ARA Market Revenue Share (%), by Country 2024 & 2032
- Figure 8: South America ARA Market Revenue (Million), by Country 2024 & 2032
- Figure 9: South America ARA Market Revenue Share (%), by Country 2024 & 2032
- Figure 10: Middle East and Africa ARA Market Revenue (Million), by Country 2024 & 2032
- Figure 11: Middle East and Africa ARA Market Revenue Share (%), by Country 2024 & 2032
- Figure 12: North America ARA Market Revenue (Million), by Source 2024 & 2032
- Figure 13: North America ARA Market Revenue Share (%), by Source 2024 & 2032
- Figure 14: North America ARA Market Revenue (Million), by Form 2024 & 2032
- Figure 15: North America ARA Market Revenue Share (%), by Form 2024 & 2032
- Figure 16: North America ARA Market Revenue (Million), by Application 2024 & 2032
- Figure 17: North America ARA Market Revenue Share (%), by Application 2024 & 2032
- Figure 18: North America ARA Market Revenue (Million), by Country 2024 & 2032
- Figure 19: North America ARA Market Revenue Share (%), by Country 2024 & 2032
- Figure 20: Europe ARA Market Revenue (Million), by Source 2024 & 2032
- Figure 21: Europe ARA Market Revenue Share (%), by Source 2024 & 2032
- Figure 22: Europe ARA Market Revenue (Million), by Form 2024 & 2032
- Figure 23: Europe ARA Market Revenue Share (%), by Form 2024 & 2032
- Figure 24: Europe ARA Market Revenue (Million), by Application 2024 & 2032
- Figure 25: Europe ARA Market Revenue Share (%), by Application 2024 & 2032
- Figure 26: Europe ARA Market Revenue (Million), by Country 2024 & 2032
- Figure 27: Europe ARA Market Revenue Share (%), by Country 2024 & 2032
- Figure 28: Asia Pacific ARA Market Revenue (Million), by Source 2024 & 2032
- Figure 29: Asia Pacific ARA Market Revenue Share (%), by Source 2024 & 2032
- Figure 30: Asia Pacific ARA Market Revenue (Million), by Form 2024 & 2032
- Figure 31: Asia Pacific ARA Market Revenue Share (%), by Form 2024 & 2032
- Figure 32: Asia Pacific ARA Market Revenue (Million), by Application 2024 & 2032
- Figure 33: Asia Pacific ARA Market Revenue Share (%), by Application 2024 & 2032
- Figure 34: Asia Pacific ARA Market Revenue (Million), by Country 2024 & 2032
- Figure 35: Asia Pacific ARA Market Revenue Share (%), by Country 2024 & 2032
- Figure 36: South America ARA Market Revenue (Million), by Source 2024 & 2032
- Figure 37: South America ARA Market Revenue Share (%), by Source 2024 & 2032
- Figure 38: South America ARA Market Revenue (Million), by Form 2024 & 2032
- Figure 39: South America ARA Market Revenue Share (%), by Form 2024 & 2032
- Figure 40: South America ARA Market Revenue (Million), by Application 2024 & 2032
- Figure 41: South America ARA Market Revenue Share (%), by Application 2024 & 2032
- Figure 42: South America ARA Market Revenue (Million), by Country 2024 & 2032
- Figure 43: South America ARA Market Revenue Share (%), by Country 2024 & 2032
- Figure 44: Middle East and Africa ARA Market Revenue (Million), by Source 2024 & 2032
- Figure 45: Middle East and Africa ARA Market Revenue Share (%), by Source 2024 & 2032
- Figure 46: Middle East and Africa ARA Market Revenue (Million), by Form 2024 & 2032
- Figure 47: Middle East and Africa ARA Market Revenue Share (%), by Form 2024 & 2032
- Figure 48: Middle East and Africa ARA Market Revenue (Million), by Application 2024 & 2032
- Figure 49: Middle East and Africa ARA Market Revenue Share (%), by Application 2024 & 2032
- Figure 50: Middle East and Africa ARA Market Revenue (Million), by Country 2024 & 2032
- Figure 51: Middle East and Africa ARA Market Revenue Share (%), by Country 2024 & 2032
List of Tables
- Table 1: Global ARA Market Revenue Million Forecast, by Region 2019 & 2032
- Table 2: Global ARA Market Revenue Million Forecast, by Source 2019 & 2032
- Table 3: Global ARA Market Revenue Million Forecast, by Form 2019 & 2032
- Table 4: Global ARA Market Revenue Million Forecast, by Application 2019 & 2032
- Table 5: Global ARA Market Revenue Million Forecast, by Region 2019 & 2032
- Table 6: Global ARA Market Revenue Million Forecast, by Country 2019 & 2032
- Table 7: United States ARA Market Revenue (Million) Forecast, by Application 2019 & 2032
- Table 8: Canada ARA Market Revenue (Million) Forecast, by Application 2019 & 2032
- Table 9: Mexico ARA Market Revenue (Million) Forecast, by Application 2019 & 2032
- Table 10: Rest of North America ARA Market Revenue (Million) Forecast, by Application 2019 & 2032
- Table 11: Global ARA Market Revenue Million Forecast, by Country 2019 & 2032
- Table 12: Germany ARA Market Revenue (Million) Forecast, by Application 2019 & 2032
- Table 13: United Kingdom ARA Market Revenue (Million) Forecast, by Application 2019 & 2032
- Table 14: Italy ARA Market Revenue (Million) Forecast, by Application 2019 & 2032
- Table 15: France ARA Market Revenue (Million) Forecast, by Application 2019 & 2032
- Table 16: Russia ARA Market Revenue (Million) Forecast, by Application 2019 & 2032
- Table 17: Spain ARA Market Revenue (Million) Forecast, by Application 2019 & 2032
- Table 18: Rest of Europe ARA Market Revenue (Million) Forecast, by Application 2019 & 2032
- Table 19: Global ARA Market Revenue Million Forecast, by Country 2019 & 2032
- Table 20: India ARA Market Revenue (Million) Forecast, by Application 2019 & 2032
- Table 21: China ARA Market Revenue (Million) Forecast, by Application 2019 & 2032
- Table 22: Australia ARA Market Revenue (Million) Forecast, by Application 2019 & 2032
- Table 23: Japan ARA Market Revenue (Million) Forecast, by Application 2019 & 2032
- Table 24: Rest of Asia Pacific ARA Market Revenue (Million) Forecast, by Application 2019 & 2032
- Table 25: Global ARA Market Revenue Million Forecast, by Country 2019 & 2032
- Table 26: Brazil ARA Market Revenue (Million) Forecast, by Application 2019 & 2032
- Table 27: Argentina ARA Market Revenue (Million) Forecast, by Application 2019 & 2032
- Table 28: Rest of South America ARA Market Revenue (Million) Forecast, by Application 2019 & 2032
- Table 29: Global ARA Market Revenue Million Forecast, by Country 2019 & 2032
- Table 30: South Africa ARA Market Revenue (Million) Forecast, by Application 2019 & 2032
- Table 31: Saudi Arabia ARA Market Revenue (Million) Forecast, by Application 2019 & 2032
- Table 32: Rest of Middle East and Africa ARA Market Revenue (Million) Forecast, by Application 2019 & 2032
- Table 33: Global ARA Market Revenue Million Forecast, by Source 2019 & 2032
- Table 34: Global ARA Market Revenue Million Forecast, by Form 2019 & 2032
- Table 35: Global ARA Market Revenue Million Forecast, by Application 2019 & 2032
- Table 36: Global ARA Market Revenue Million Forecast, by Country 2019 & 2032
- Table 37: United States ARA Market Revenue (Million) Forecast, by Application 2019 & 2032
- Table 38: Canada ARA Market Revenue (Million) Forecast, by Application 2019 & 2032
- Table 39: Mexico ARA Market Revenue (Million) Forecast, by Application 2019 & 2032
- Table 40: Rest of North America ARA Market Revenue (Million) Forecast, by Application 2019 & 2032
- Table 41: Global ARA Market Revenue Million Forecast, by Source 2019 & 2032
- Table 42: Global ARA Market Revenue Million Forecast, by Form 2019 & 2032
- Table 43: Global ARA Market Revenue Million Forecast, by Application 2019 & 2032
- Table 44: Global ARA Market Revenue Million Forecast, by Country 2019 & 2032
- Table 45: Germany ARA Market Revenue (Million) Forecast, by Application 2019 & 2032
- Table 46: United Kingdom ARA Market Revenue (Million) Forecast, by Application 2019 & 2032
- Table 47: Italy ARA Market Revenue (Million) Forecast, by Application 2019 & 2032
- Table 48: France ARA Market Revenue (Million) Forecast, by Application 2019 & 2032
- Table 49: Russia ARA Market Revenue (Million) Forecast, by Application 2019 & 2032
- Table 50: Spain ARA Market Revenue (Million) Forecast, by Application 2019 & 2032
- Table 51: Rest of Europe ARA Market Revenue (Million) Forecast, by Application 2019 & 2032
- Table 52: Global ARA Market Revenue Million Forecast, by Source 2019 & 2032
- Table 53: Global ARA Market Revenue Million Forecast, by Form 2019 & 2032
- Table 54: Global ARA Market Revenue Million Forecast, by Application 2019 & 2032
- Table 55: Global ARA Market Revenue Million Forecast, by Country 2019 & 2032
- Table 56: India ARA Market Revenue (Million) Forecast, by Application 2019 & 2032
- Table 57: China ARA Market Revenue (Million) Forecast, by Application 2019 & 2032
- Table 58: Australia ARA Market Revenue (Million) Forecast, by Application 2019 & 2032
- Table 59: Japan ARA Market Revenue (Million) Forecast, by Application 2019 & 2032
- Table 60: Rest of Asia Pacific ARA Market Revenue (Million) Forecast, by Application 2019 & 2032
- Table 61: Global ARA Market Revenue Million Forecast, by Source 2019 & 2032
- Table 62: Global ARA Market Revenue Million Forecast, by Form 2019 & 2032
- Table 63: Global ARA Market Revenue Million Forecast, by Application 2019 & 2032
- Table 64: Global ARA Market Revenue Million Forecast, by Country 2019 & 2032
- Table 65: Brazil ARA Market Revenue (Million) Forecast, by Application 2019 & 2032
- Table 66: Argentina ARA Market Revenue (Million) Forecast, by Application 2019 & 2032
- Table 67: Rest of South America ARA Market Revenue (Million) Forecast, by Application 2019 & 2032
- Table 68: Global ARA Market Revenue Million Forecast, by Source 2019 & 2032
- Table 69: Global ARA Market Revenue Million Forecast, by Form 2019 & 2032
- Table 70: Global ARA Market Revenue Million Forecast, by Application 2019 & 2032
- Table 71: Global ARA Market Revenue Million Forecast, by Country 2019 & 2032
- Table 72: South Africa ARA Market Revenue (Million) Forecast, by Application 2019 & 2032
- Table 73: Saudi Arabia ARA Market Revenue (Million) Forecast, by Application 2019 & 2032
- Table 74: Rest of Middle East and Africa ARA Market Revenue (Million) Forecast, by Application 2019 & 2032
Frequently Asked Questions
1. What is the projected Compound Annual Growth Rate (CAGR) of the ARA Market?
The projected CAGR is approximately 6.80%.
2. Which companies are prominent players in the ARA Market?
Key companies in the market include Guangdong Runke, A & Z Food Additives Co Ltd, Koninklijke DSM N V, Wuhan Shu Ou Technology Co Ltd*List Not Exhaustive, Cabio Biotech (Wuhan)Co Ltd, Cargill Inc, Cayman Chemicals, Merck Group.
3. What are the main segments of the ARA Market?
The market segments include Source, Form, Application.
4. Can you provide details about the market size?
The market size is estimated to be USD XX Million as of 2022.
5. What are some drivers contributing to market growth?
Increasing Demand for Low-Fat and Low-Calorie Food; Increasing Product Innovation.
6. What are the notable trends driving market growth?
Application of ARA in Infant Formula Increases.
7. Are there any restraints impacting market growth?
; Threat of New Entrants; Bargaining Power of Buyers/Consumers; Bargaining Power of Suppliers; Threat of Substitute Products; Degree Of Competition.
8. Can you provide examples of recent developments in the market?
N/A
9. What pricing options are available for accessing the report?
Pricing options include single-user, multi-user, and enterprise licenses priced at USD 4750, USD 5250, and USD 8750 respectively.
10. Is the market size provided in terms of value or volume?
The market size is provided in terms of value, measured in Million.
11. Are there any specific market keywords associated with the report?
Yes, the market keyword associated with the report is "ARA Market," which aids in identifying and referencing the specific market segment covered.
12. How do I determine which pricing option suits my needs best?
The pricing options vary based on user requirements and access needs. Individual users may opt for single-user licenses, while businesses requiring broader access may choose multi-user or enterprise licenses for cost-effective access to the report.
13. Are there any additional resources or data provided in the ARA Market report?
While the report offers comprehensive insights, it's advisable to review the specific contents or supplementary materials provided to ascertain if additional resources or data are available.
14. How can I stay updated on further developments or reports in the ARA Market?
To stay informed about further developments, trends, and reports in the ARA Market, consider subscribing to industry newsletters, following relevant companies and organizations, or regularly checking reputable industry news sources and publications.
Methodology
Step 1 - Identification of Relevant Samples Size from Population Database


Step 2 - Approaches for Defining Global Market Size (Value, Volume* & Price*)

Note*: In applicable scenarios
Step 3 - Data Sources
Primary Research
- Web Analytics
- Survey Reports
- Research Institute
- Latest Research Reports
- Opinion Leaders
Secondary Research
- Annual Reports
- White Paper
- Latest Press Release
- Industry Association
- Paid Database
- Investor Presentations

Step 4 - Data Triangulation
Involves using different sources of information in order to increase the validity of a study
These sources are likely to be stakeholders in a program - participants, other researchers, program staff, other community members, and so on.
Then we put all data in single framework & apply various statistical tools to find out the dynamic on the market.
During the analysis stage, feedback from the stakeholder groups would be compared to determine areas of agreement as well as areas of divergence


