

Key Insights
The Japan energy drink market, estimated at ¥2 billion in 2024, is projected for substantial growth with a CAGR of 6.7% through 2033. This expansion is driven by increasing urbanization, demanding lifestyles, and the rising engagement in fitness and sports, particularly among younger demographics. Innovation in functional beverages, incorporating vitamins and natural ingredients, is also a key influencer, meeting consumer demand for healthier alternatives. While health consciousness and sugar concerns present challenges, these are being addressed through product diversification and marketing emphasizing natural and functional benefits. Bottled formats, predominantly sold via supermarkets, hypermarkets, and convenience stores, lead the market, with online channels experiencing significant growth. Suntory Holdings Ltd, Coca-Cola, and Red Bull are key players actively shaping the market through branding, innovation, and distribution.
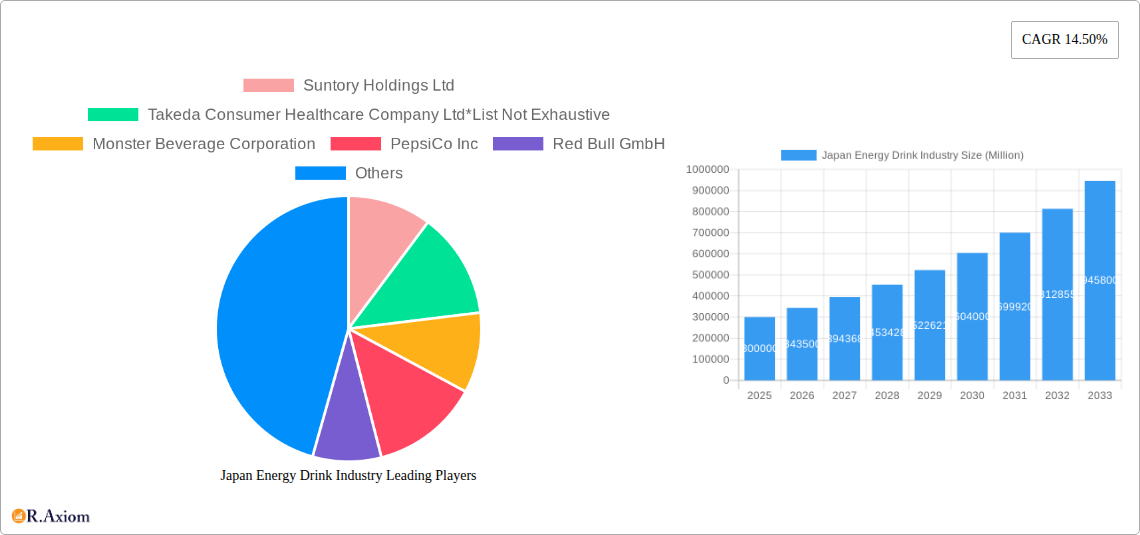
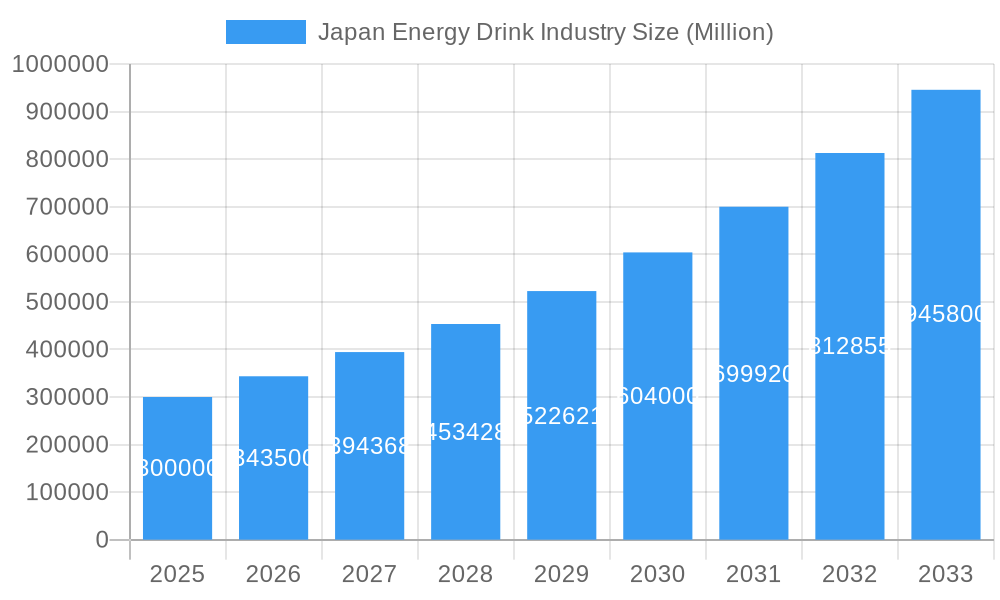
Japan Energy Drink Industry Market Size (In Billion)
Major metropolitan areas, including Kanto and Kansai, represent the largest markets due to population density and economic activity. Emerging growth potential exists in regions like Kyushu and Tohoku. Sustained economic development, evolving lifestyles, and new market entrants are expected to fuel continued growth from 2024 to 2033. The non-alcoholic segment is forecast to lead, aligning with health trends, while the alcoholic segment will remain niche. Intensified competition will necessitate strategic marketing and diversification for sustained success.
Japan Energy Drink Industry Company Market Share
Japan Energy Drink Industry: 2019-2033 Market Report
This comprehensive report provides a detailed analysis of the Japan energy drink industry, covering the period 2019-2033. It offers invaluable insights into market trends, competitive dynamics, and future growth prospects, empowering stakeholders to make informed strategic decisions. The report leverages extensive data analysis and expert insights to forecast market size, segment performance, and key industry developments. The base year for this analysis is 2025, with estimations for 2025 and a forecast period spanning 2025-2033. The historical period covered is 2019-2024. This report is crucial for businesses looking to expand into the Japanese market, existing players seeking to optimize their strategies, and investors assessing the investment potential within this dynamic sector.
Japan Energy Drink Industry Market Concentration & Innovation
The Japanese energy drink market exhibits a moderately concentrated structure, dominated by a few major international and domestic players. Suntory Holdings Ltd, The Coca-Cola Company, and Red Bull GmbH hold significant market share, with their established brand recognition and extensive distribution networks driving their success. However, smaller players continue to innovate and carve niches for themselves. The market displays high innovation levels, with continuous product launches and reformulations responding to consumer demand for novel flavors, functional benefits (e.g., improved focus, enhanced hydration), and healthier ingredients. Regulatory frameworks regarding sugar content, caffeine levels, and marketing practices influence product development. Existing substitutes such as coffee, tea, and sports drinks pose a competitive challenge. Consumer trends favor functional beverages with natural ingredients and lower sugar content. The recent years have witnessed moderate M&A activity, with deal values ranging from xx Million to xx Million, driven primarily by larger players expanding their portfolios and market reach.
- Market Share (2024 Estimate): Suntory Holdings Ltd (xx%), The Coca-Cola Company (xx%), Red Bull GmbH (xx%), Others (xx%)
- Recent M&A Activities: [Include specific examples of mergers and acquisitions if available, detailing the deal size and companies involved]
Japan Energy Drink Industry Industry Trends & Insights
The Japanese energy drink market demonstrates robust growth, driven by factors such as rising disposable incomes, increasing urbanization, a young and active population, and changing lifestyle patterns. The market has witnessed a compound annual growth rate (CAGR) of xx% during the historical period (2019-2024). The increasing demand for functional beverages with enhanced energy and focus-boosting properties fuels market growth. Technological disruptions, such as improved packaging solutions (e.g., sustainable materials) and advanced flavor technologies, are shaping the market. Consumer preferences are increasingly geared toward healthier options with reduced sugar and artificial ingredients. The competitive landscape is intensely dynamic, with existing players focused on product diversification, innovation, and brand building, while emerging brands target niche segments. Market penetration of energy drinks in Japan is estimated at xx% in 2024, projected to reach xx% by 2033.
Dominant Markets & Segments in Japan Energy Drink Industry
The Japanese energy drink market is geographically diverse, with significant consumption across major urban centers and regional markets. The non-alcoholic segment dominates the market, accounting for over xx% of total volume sales in 2024. The cans segment is the dominant packaging type, followed by plastic bottles. Convenience stores and supermarkets/hypermarkets form the main distribution channels.
Key Drivers for Dominance:
- Non-alcoholic segment: Strong consumer preference for non-alcoholic options, particularly among health-conscious consumers.
- Cans Segment: Cost-effectiveness, portability, and convenience for consumers.
- Convenience Stores/Supermarkets: Wide reach and accessibility to consumers, particularly in densely populated areas.
Detailed Dominance Analysis: [Include a paragraph-form analysis explaining the factors contributing to the dominance of each segment, citing data and market trends]
Japan Energy Drink Industry Product Developments
Recent product developments in the Japanese energy drink market highlight a shift towards healthier and more diverse offerings. Companies are introducing energy drinks with natural ingredients, reduced sugar content, and functional benefits beyond energy boosting, such as improved hydration and enhanced cognitive performance. Technological advancements in flavor creation, packaging, and formulation are driving innovation. This trend reflects consumer demand for healthier alternatives and a growing awareness of health and wellness. New product launches, including Red Bull's cactus fruit drink and Monster's Super Cola, exemplify this trend, showcasing the companies' efforts to adapt to changing consumer preferences and expand their market share.
Report Scope & Segmentation Analysis
This report segments the Japan energy drink market based on product type (alcoholic and non-alcoholic), packaging type (bottles – plastic and glass, cans), and distribution channels (supermarkets/hypermarkets, specialty stores, convenience stores/grocery stores, online retail stores, other distribution channels). Each segment is analyzed in terms of its market size, growth projections, and competitive dynamics.
- Type: The non-alcoholic segment is expected to continue its dominance with significant growth, while the alcoholic segment is likely to exhibit a more moderate growth rate.
- Packaging: Cans are expected to remain the leading packaging type, due to their convenience and cost-effectiveness.
- Distribution Channels: Convenience stores and supermarkets will maintain their significant share, while the online retail channel will experience increasing growth.
Key Drivers of Japan Energy Drink Industry Growth
Several key factors drive the growth of the Japan energy drink industry. These include rising disposable incomes fueling increased spending on discretionary items, a young and growing population with a preference for convenient and stimulating beverages, and a thriving culture of work and social activities where energy drinks provide a functional benefit. Technological advancements in product formulation and packaging also support growth, while favorable government regulations create a conducive business environment. Furthermore, successful marketing campaigns and expanding distribution networks enhance market penetration.
Challenges in the Japan Energy Drink Industry Sector
The Japan energy drink industry faces challenges including increasing health concerns surrounding high sugar and caffeine content, leading to stricter government regulations and potential health taxes. Supply chain disruptions, such as raw material price fluctuations and transportation costs, can impact profitability. Intense competition among established and emerging players necessitates constant innovation and marketing efforts. Furthermore, changing consumer preferences towards healthier alternatives pose a persistent challenge. These factors can negatively affect market growth if not addressed strategically.
Emerging Opportunities in Japan Energy Drink Industry
Emerging opportunities lie in developing functional energy drinks catering to specific consumer needs, such as drinks with added vitamins, minerals, or nootropics. The growing popularity of natural and organic ingredients presents an opportunity to target health-conscious consumers. Expanding distribution channels through e-commerce and specialized retail outlets can increase market reach. Moreover, collaborations with health and wellness brands can enhance brand image and attract a wider consumer base.
Leading Players in the Japan Energy Drink Industry Market
- Suntory Holdings Ltd
- Takeda Consumer Healthcare Company Ltd
- Monster Beverage Corporation
- PepsiCo Inc
- Red Bull GmbH
- Taisho Pharmaceutical Co Ltd
- The Coca-Cola Company
- Osotspa Ltd
- Otsuka Pharmaceutical Co Ltd
- Rockstar Inc
Key Developments in Japan Energy Drink Industry Industry
- March 2021: Monster Beverages launched its newest drink, Super Cola, in Japan, aiming to meet consumer demand for cola-flavored energy drinks and increase its product line.
- April 2021: Red Bull launched its new summer cactus fruit drink, introducing a novel flavor to attract consumers and gain market share.
Strategic Outlook for Japan Energy Drink Industry Market
The Japan energy drink market exhibits strong growth potential, driven by evolving consumer preferences, technological advancements, and favorable economic conditions. The shift towards healthier options and functional beverages presents a significant opportunity for innovation and market expansion. Strategic partnerships, targeted marketing campaigns, and consistent product development will be crucial for success in this dynamic market. The industry is expected to witness continued growth and innovation over the forecast period, driven by health-conscious consumers and an increase in demand for functional beverages.
Japan Energy Drink Industry Segmentation
-
1. Type
- 1.1. Alcoholic
- 1.2. Non-alcoholic
-
2. Packaging Type
- 2.1. Bottles (Plastic and Glass)
- 2.2. Cans
-
3. Distribution Channel
- 3.1. Supermarkets/Hypermarkets
- 3.2. Specialty Stores
- 3.3. Convenience Stores/Grocery Stores
- 3.4. Online Retail Stores
- 3.5. Other Distribution Channels
Japan Energy Drink Industry Segmentation By Geography
- 1. Japan
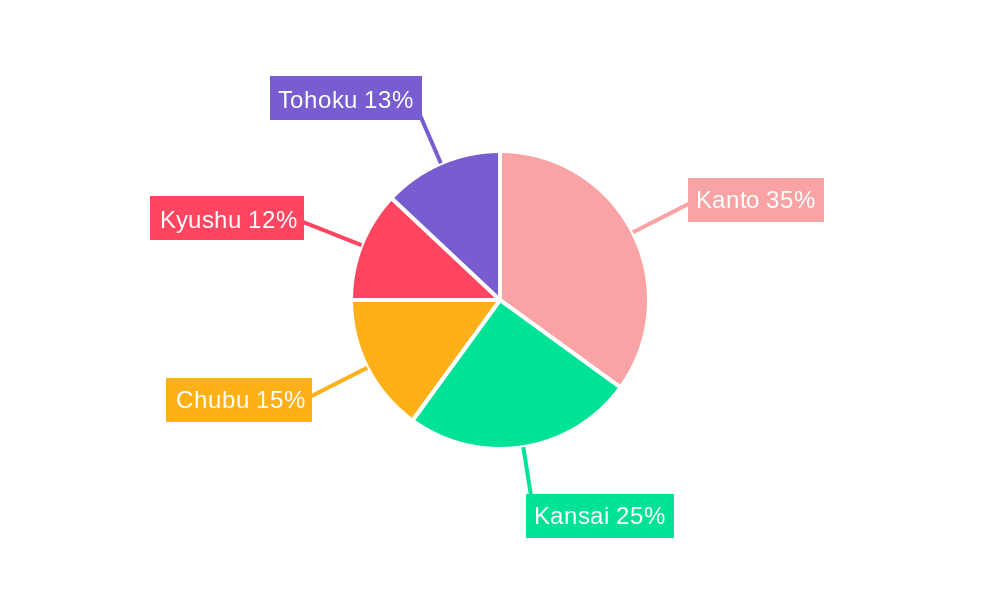
Japan Energy Drink Industry Regional Market Share
Geographic Coverage of Japan Energy Drink Industry
Japan Energy Drink Industry REPORT HIGHLIGHTS
| Aspects | Details |
|---|---|
| Study Period | 2020-2034 |
| Base Year | 2025 |
| Estimated Year | 2026 |
| Forecast Period | 2026-2034 |
| Historical Period | 2020-2025 |
| Growth Rate | CAGR of 6.7% from 2020-2034 |
| Segmentation |
|
Table of Contents
- 1. Introduction
- 1.1. Research Scope
- 1.2. Market Segmentation
- 1.3. Research Objective
- 1.4. Definitions and Assumptions
- 2. Executive Summary
- 2.1. Market Snapshot
- 3. Market Dynamics
- 3.1. Market Drivers
- 3.2. Market Restrains
- 3.3. Market Trends
- 3.4. Market Opportunities
- 4. Market Factor Analysis
- 4.1. Porters Five Forces
- 4.1.1. Bargaining Power of Suppliers
- 4.1.2. Bargaining Power of Buyers
- 4.1.3. Threat of New Entrants
- 4.1.4. Threat of Substitutes
- 4.1.5. Competitive Rivalry
- 4.2. PESTEL analysis
- 4.3. BCG Analysis
- 4.3.1. Stars (High Growth, High Market Share)
- 4.3.2. Cash Cows (Low Growth, High Market Share)
- 4.3.3. Question Mark (High Growth, Low Market Share)
- 4.3.4. Dogs (Low Growth, Low Market Share)
- 4.4. Ansoff Matrix Analysis
- 4.5. Supply Chain Analysis
- 4.6. Regulatory Landscape
- 4.7. Current Market Potential and Opportunity Assessment (TAM–SAM–SOM Framework)
- 4.8. RAX Analyst Note
- 4.1. Porters Five Forces
- 5. Market Analysis, Insights and Forecast 2021-2033
- 5.1. Market Analysis, Insights and Forecast - by Type
- 5.1.1. Alcoholic
- 5.1.2. Non-alcoholic
- 5.2. Market Analysis, Insights and Forecast - by Packaging Type
- 5.2.1. Bottles (Plastic and Glass)
- 5.2.2. Cans
- 5.3. Market Analysis, Insights and Forecast - by Distribution Channel
- 5.3.1. Supermarkets/Hypermarkets
- 5.3.2. Specialty Stores
- 5.3.3. Convenience Stores/Grocery Stores
- 5.3.4. Online Retail Stores
- 5.3.5. Other Distribution Channels
- 5.4. Market Analysis, Insights and Forecast - by Region
- 5.4.1. Japan
- 5.1. Market Analysis, Insights and Forecast - by Type
- 6. Japan Energy Drink Industry Analysis, Insights and Forecast, 2021-2033
- 6.1. Market Analysis, Insights and Forecast - by Type
- 6.1.1. Alcoholic
- 6.1.2. Non-alcoholic
- 6.2. Market Analysis, Insights and Forecast - by Packaging Type
- 6.2.1. Bottles (Plastic and Glass)
- 6.2.2. Cans
- 6.3. Market Analysis, Insights and Forecast - by Distribution Channel
- 6.3.1. Supermarkets/Hypermarkets
- 6.3.2. Specialty Stores
- 6.3.3. Convenience Stores/Grocery Stores
- 6.3.4. Online Retail Stores
- 6.3.5. Other Distribution Channels
- 6.1. Market Analysis, Insights and Forecast - by Type
- 7. Competitive Analysis
- 7.1. Company Profiles
- 7.1.1 Suntory Holdings Ltd
- 7.1.1.1. Company Overview
- 7.1.1.2. Products
- 7.1.1.3. Company Financials
- 7.1.1.4. SWOT Analysis
- 7.1.2 Takeda Consumer Healthcare Company Ltd*List Not Exhaustive
- 7.1.2.1. Company Overview
- 7.1.2.2. Products
- 7.1.2.3. Company Financials
- 7.1.2.4. SWOT Analysis
- 7.1.3 Monster Beverage Corporation
- 7.1.3.1. Company Overview
- 7.1.3.2. Products
- 7.1.3.3. Company Financials
- 7.1.3.4. SWOT Analysis
- 7.1.4 PepsiCo Inc
- 7.1.4.1. Company Overview
- 7.1.4.2. Products
- 7.1.4.3. Company Financials
- 7.1.4.4. SWOT Analysis
- 7.1.5 Red Bull GmbH
- 7.1.5.1. Company Overview
- 7.1.5.2. Products
- 7.1.5.3. Company Financials
- 7.1.5.4. SWOT Analysis
- 7.1.6 Taisho Pharmaceutical Co Ltd
- 7.1.6.1. Company Overview
- 7.1.6.2. Products
- 7.1.6.3. Company Financials
- 7.1.6.4. SWOT Analysis
- 7.1.7 The Coca-Cola Company
- 7.1.7.1. Company Overview
- 7.1.7.2. Products
- 7.1.7.3. Company Financials
- 7.1.7.4. SWOT Analysis
- 7.1.8 Osotspa Ltd
- 7.1.8.1. Company Overview
- 7.1.8.2. Products
- 7.1.8.3. Company Financials
- 7.1.8.4. SWOT Analysis
- 7.1.9 Otsuka Pharmaceutical Co Ltd
- 7.1.9.1. Company Overview
- 7.1.9.2. Products
- 7.1.9.3. Company Financials
- 7.1.9.4. SWOT Analysis
- 7.1.10 Rockstar Inc
- 7.1.10.1. Company Overview
- 7.1.10.2. Products
- 7.1.10.3. Company Financials
- 7.1.10.4. SWOT Analysis
- 7.1.1 Suntory Holdings Ltd
- 7.2. Market Entropy
- 7.2.1 Company's Key Areas Served
- 7.2.2 Recent Developments
- 7.3. Company Market Share Analysis 2025
- 7.3.1 Top 5 Companies Market Share Analysis
- 7.3.2 Top 3 Companies Market Share Analysis
- 7.4. List of Potential Customers
- 8. Research Methodology
List of Figures
- Figure 1: Japan Energy Drink Industry Revenue Breakdown (billion, %) by Product 2025 & 2033
- Figure 2: Japan Energy Drink Industry Share (%) by Company 2025
List of Tables
- Table 1: Japan Energy Drink Industry Revenue billion Forecast, by Type 2020 & 2033
- Table 2: Japan Energy Drink Industry Volume K Litres Forecast, by Type 2020 & 2033
- Table 3: Japan Energy Drink Industry Revenue billion Forecast, by Packaging Type 2020 & 2033
- Table 4: Japan Energy Drink Industry Volume K Litres Forecast, by Packaging Type 2020 & 2033
- Table 5: Japan Energy Drink Industry Revenue billion Forecast, by Distribution Channel 2020 & 2033
- Table 6: Japan Energy Drink Industry Volume K Litres Forecast, by Distribution Channel 2020 & 2033
- Table 7: Japan Energy Drink Industry Revenue billion Forecast, by Region 2020 & 2033
- Table 8: Japan Energy Drink Industry Volume K Litres Forecast, by Region 2020 & 2033
- Table 9: Japan Energy Drink Industry Revenue billion Forecast, by Type 2020 & 2033
- Table 10: Japan Energy Drink Industry Volume K Litres Forecast, by Type 2020 & 2033
- Table 11: Japan Energy Drink Industry Revenue billion Forecast, by Packaging Type 2020 & 2033
- Table 12: Japan Energy Drink Industry Volume K Litres Forecast, by Packaging Type 2020 & 2033
- Table 13: Japan Energy Drink Industry Revenue billion Forecast, by Distribution Channel 2020 & 2033
- Table 14: Japan Energy Drink Industry Volume K Litres Forecast, by Distribution Channel 2020 & 2033
- Table 15: Japan Energy Drink Industry Revenue billion Forecast, by Country 2020 & 2033
- Table 16: Japan Energy Drink Industry Volume K Litres Forecast, by Country 2020 & 2033
Frequently Asked Questions
1. What is the projected Compound Annual Growth Rate (CAGR) of the Japan Energy Drink Industry?
The projected CAGR is approximately 6.7%.
2. Which companies are prominent players in the Japan Energy Drink Industry?
Key companies in the market include Suntory Holdings Ltd, Takeda Consumer Healthcare Company Ltd*List Not Exhaustive, Monster Beverage Corporation, PepsiCo Inc, Red Bull GmbH, Taisho Pharmaceutical Co Ltd, The Coca-Cola Company, Osotspa Ltd, Otsuka Pharmaceutical Co Ltd, Rockstar Inc.
3. What are the main segments of the Japan Energy Drink Industry?
The market segments include Type, Packaging Type, Distribution Channel.
4. Can you provide details about the market size?
The market size is estimated to be USD 2 billion as of 2022.
5. What are some drivers contributing to market growth?
Increasing Sports Participation; Increasing Awareness about Health and Fitness.
6. What are the notable trends driving market growth?
Hectic Lifestyles Leading Toward High Demand for Energy Drinks.
7. Are there any restraints impacting market growth?
Adverse Effects of Overconsumption of Products.
8. Can you provide examples of recent developments in the market?
April 2021: Red Bull launched its new summer cactus fruit drink. The newest cactus fruit drink from the brand has a fresh and delicious red berry taste, inspired by desert plants. This completely new flavor has been launched to obtain market value in the existing market and attract consumers.
9. What pricing options are available for accessing the report?
Pricing options include single-user, multi-user, and enterprise licenses priced at USD 3800, USD 4500, and USD 5800 respectively.
10. Is the market size provided in terms of value or volume?
The market size is provided in terms of value, measured in billion and volume, measured in K Litres.
11. Are there any specific market keywords associated with the report?
Yes, the market keyword associated with the report is "Japan Energy Drink Industry," which aids in identifying and referencing the specific market segment covered.
12. How do I determine which pricing option suits my needs best?
The pricing options vary based on user requirements and access needs. Individual users may opt for single-user licenses, while businesses requiring broader access may choose multi-user or enterprise licenses for cost-effective access to the report.
13. Are there any additional resources or data provided in the Japan Energy Drink Industry report?
While the report offers comprehensive insights, it's advisable to review the specific contents or supplementary materials provided to ascertain if additional resources or data are available.
14. How can I stay updated on further developments or reports in the Japan Energy Drink Industry?
To stay informed about further developments, trends, and reports in the Japan Energy Drink Industry, consider subscribing to industry newsletters, following relevant companies and organizations, or regularly checking reputable industry news sources and publications.
Methodology
Step 1 - Identification of Relevant Samples Size from Population Database


Step 2 - Approaches for Defining Global Market Size (Value, Volume* & Price*)

Note*: In applicable scenarios
Step 3 - Data Sources
Primary Research
- Web Analytics
- Survey Reports
- Research Institute
- Latest Research Reports
- Opinion Leaders
Secondary Research
- Annual Reports
- White Paper
- Latest Press Release
- Industry Association
- Paid Database
- Investor Presentations

Step 4 - Data Triangulation
Involves using different sources of information in order to increase the validity of a study
These sources are likely to be stakeholders in a program - participants, other researchers, program staff, other community members, and so on.
Then we put all data in single framework & apply various statistical tools to find out the dynamic on the market.
During the analysis stage, feedback from the stakeholder groups would be compared to determine areas of agreement as well as areas of divergence