

Key Insights
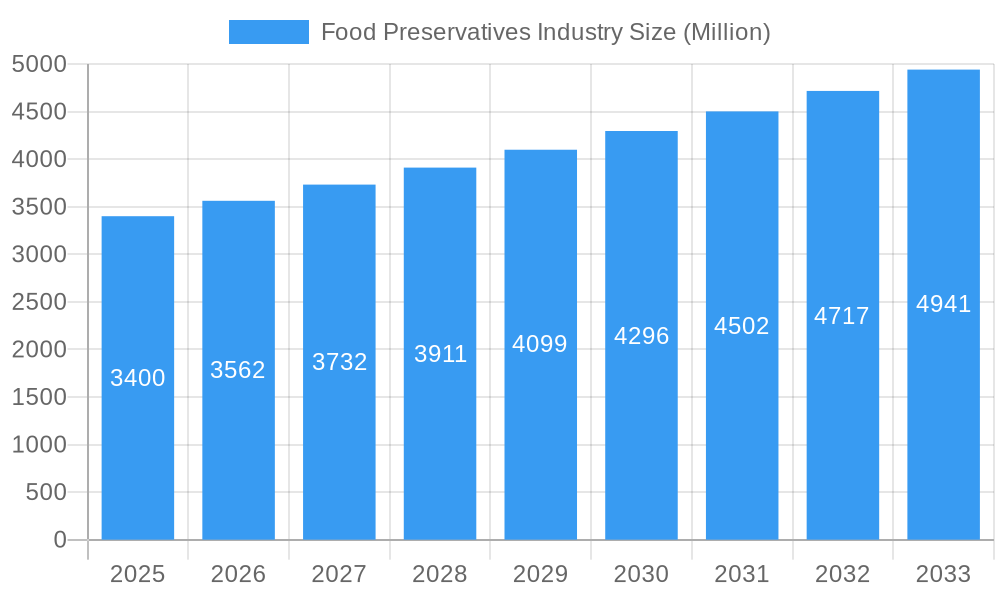
The global food preservatives market is poised for steady expansion, projected to reach a valuation of $3.40 billion. This growth is underpinned by a Compound Annual Growth Rate (CAGR) of 4.81%, indicating a healthy and sustained upward trajectory for the industry. A primary driver fueling this market expansion is the increasing consumer demand for longer shelf-life food products, driven by a desire for convenience, reduced food waste, and greater accessibility to a wider variety of food items. The evolving retail landscape, with its emphasis on efficient supply chains and product availability, further amplifies the need for effective preservation solutions. Furthermore, growing awareness regarding food safety and the economic benefits of minimizing spoilage are compelling manufacturers to invest in advanced preservation technologies. The trend towards natural food ingredients also presents a significant opportunity, with natural antioxidants and antimicrobials gaining prominence as consumers seek cleaner labels and perceive them as healthier alternatives.
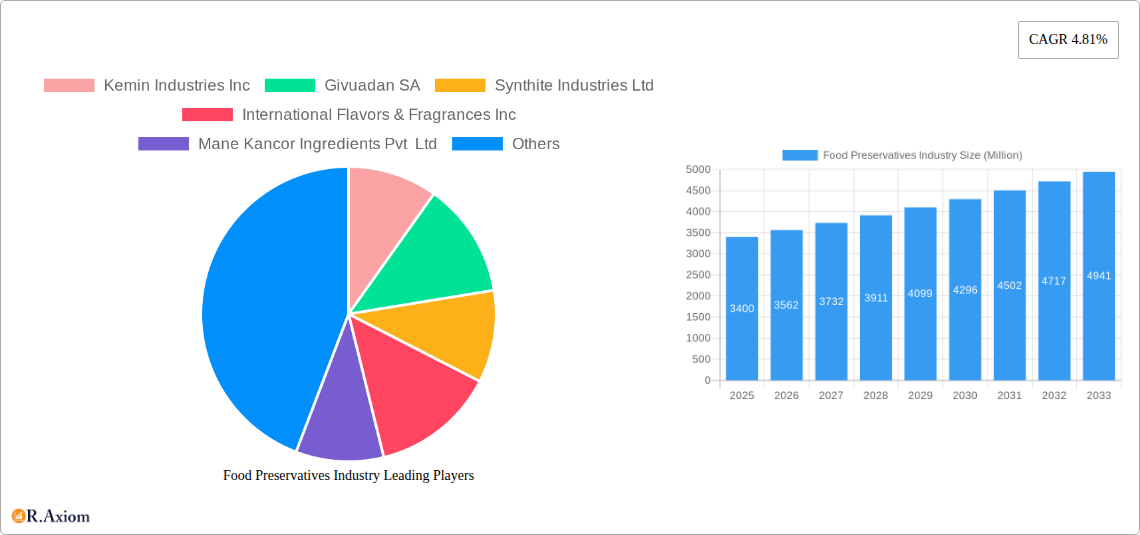
Food Preservatives Industry Market Size (In Billion)
The market is segmented into distinct categories based on preservative type and application, reflecting diverse industry needs. In terms of Type, Antioxidants, encompassing both Natural and Synthetic variants, and Antimicrobials, also available in Natural and Synthetic forms, are key segments. Acidulants and other specialized preservative types also contribute to the market's breadth. On the Application front, the market is driven by demand from Bakery and Confectionery, Meat and Poultry, Ready Meals, Sweet and Savory Snacks, Sauces and Dressings, and Edible Oils, among other applications. These diverse segments highlight the pervasive role of food preservatives across the entire food and beverage industry, from processed goods to staple ingredients. Geographically, regions like North America and Europe are expected to maintain significant market shares due to established food processing industries and high consumer spending. However, the Asia Pacific region is anticipated to witness the most dynamic growth, fueled by rapid industrialization, a burgeoning middle class, and increasing adoption of processed foods.
Food Preservatives Industry Company Market Share
This comprehensive report delves into the dynamic food preservatives market, offering an in-depth analysis of market growth, industry trends, and strategic insights for stakeholders. Covering the historical period from 2019 to 2024, with a base year of 2025 and a forecast period extending to 2033, this study provides critical intelligence on market segmentation, competitive landscape, and emerging opportunities. We examine the intricate interplay of natural preservatives, synthetic preservatives, and food additives that are shaping the future of food safety and shelf-life extension.
Food Preservatives Industry Market Concentration & Innovation
The global food preservatives market, valued at an estimated $XX Billion in 2025, exhibits moderate to high concentration, with key players like Kemin Industries Inc., Givaudan SA, and International Flavors & Fragrances Inc. holding significant market share. Innovation is primarily driven by the increasing consumer demand for clean-label ingredients, natural food preservatives, and solutions that enhance food shelf life without compromising on health or taste. Regulatory frameworks worldwide are evolving, pushing manufacturers towards safer and more sustainable preservative options. Product substitutes, such as improved processing techniques and advanced packaging, are emerging but currently hold a limited market share against established preservative solutions. End-user trends strongly favor preservatives that offer functional benefits beyond preservation, including flavor enhancement and nutritional fortification. Mergers and acquisitions (M&A) activity remains a key strategy for market expansion and technological acquisition, with recent deals valued in the hundreds of Millions.
- Market Share Snapshot (2025 Estimate): Leading companies collectively account for over 60% of the global market.
- M&A Deal Value Trend: Expected to grow by 15% annually through 2033.
Food Preservatives Industry Industry Trends & Insights
The food preservatives market is experiencing robust growth, projected to expand at a Compound Annual Growth Rate (CAGR) of approximately 6.5% from 2025 to 2033. This growth is propelled by a confluence of factors, including the escalating global population, increasing demand for processed and convenience foods, and a heightened consumer awareness regarding food safety and shelf-life. Technological advancements are playing a pivotal role, with a strong emphasis on developing bio-based preservatives and antimicrobial agents derived from natural sources. The trend towards clean-label food ingredients is a significant market disruptor, pushing formulators to replace synthetic preservatives with natural alternatives like natural antioxidants and natural antimicrobials. This shift is driven by consumer preferences for transparent ingredient lists and a perception of improved health benefits associated with natural products. Competitive dynamics are intensifying, with established players investing heavily in R&D and smaller, specialized companies focusing on niche, high-growth segments. The penetration of food preservatives in emerging economies is rapidly increasing due to improving living standards and the expansion of the modern retail sector.
Dominant Markets & Segments in Food Preservatives Industry
The food preservatives industry is dominated by the Antioxidants segment, particularly Natural Antioxidants, which are gaining significant traction due to consumer preference for clean labels and perceived health benefits. Within the Application segment, Bakery and Confectionery and Meat and Poultry applications represent the largest market shares, driven by the extensive use of preservatives to ensure product quality and extend shelf life in these high-volume categories. The Asia Pacific region is emerging as a dominant market, fueled by rapid urbanization, a growing middle class, and increasing disposable incomes that are driving the demand for processed foods.
- Dominant Type Segment: Antioxidants
- Natural Antioxidants: Driven by clean-label trends and consumer demand for perceived healthier options. Market penetration expected to exceed 50% of the antioxidant segment by 2028.
- Synthetic Antioxidants: Continue to hold a significant share due to cost-effectiveness and proven efficacy, particularly in applications where strict regulatory approvals are in place.
- Dominant Application Segment: Bakery and Confectionery & Meat and Poultry
- Bakery and Confectionery: High demand for preservatives to maintain freshness, prevent spoilage, and extend shelf life of a wide range of products.
- Meat and Poultry: Essential for inhibiting microbial growth, preventing rancidity, and maintaining color and texture, contributing to a substantial market share.
- Dominant Geographic Region: Asia Pacific
- Key Drivers: Growing population, increasing disposable income, rapid expansion of the food processing industry, and rising demand for convenience foods.
- Country-Specific Dominance: China and India are anticipated to lead regional growth due to their large consumer bases and evolving food consumption patterns.
Food Preservatives Industry Product Developments
Recent product developments in the food preservatives industry highlight a strong focus on natural and sustainable solutions. Kemin Industries Inc.'s launch of RUBINITE GC Dry, a natural alternative to sodium nitrite for curing meats, exemplifies the industry's pivot towards cleaner labels and enhanced microbiological protection. DSM's DelvoGuard cultures offer producers clean-label solutions for extending the shelf life of dairy products. Tate & Lyle PLC's investment in biomass boilers signifies a move towards more sustainable manufacturing processes for acidulants. These innovations cater to growing consumer demand for healthier, safer, and environmentally conscious food products, providing competitive advantages through enhanced functionality and market appeal.
Report Scope & Segmentation Analysis
This report meticulously analyzes the food preservatives industry across key segments:
- Type: Antioxidants (Natural Antioxidants, Synthetic Antioxidants), Antimicrobials (Natural Antimicrobial, Synthetic Antimicrobial), Acidulant, and Other Types.
- Application: Bakery and Confectionery, Meat and Poultry, Ready Meals, Sweet and Savory Snacks, Sauces and Dressings, Edible Oils, and Other Applications.
The Antioxidants segment, especially Natural Antioxidants, is projected to witness a significant market size of approximately $XX Billion by 2033, driven by increasing consumer awareness and regulatory shifts. The Meat and Poultry application segment is expected to maintain a substantial market share, estimated at $XX Billion by 2033, due to the critical need for microbial control and shelf-life extension. The Asia Pacific region is poised for the highest growth, with an estimated market size of $XX Billion by 2033, fueled by burgeoning demand for processed foods.
Key Drivers of Food Preservatives Industry Growth
The food preservatives industry is propelled by several key drivers. The escalating global population and the subsequent rise in demand for food products, particularly processed and convenience foods, necessitate effective preservation methods. Stringent food safety regulations globally are pushing manufacturers to adopt advanced preservatives that ensure product safety and compliance, thereby driving the adoption of food additives and antimicrobials. The growing consumer preference for clean-label food ingredients and natural alternatives is a significant catalyst, spurring innovation in natural food preservatives such as natural antioxidants and natural antimicrobials. Furthermore, advancements in food processing technologies and packaging solutions that integrate preservative functionalities are contributing to market expansion.
Challenges in the Food Preservatives Industry Sector
Despite robust growth, the food preservatives industry faces several challenges. Stringent and evolving regulatory landscapes across different regions can pose hurdles for product approvals and market entry, especially for novel food additives. The increasing consumer demand for natural preservatives can create a challenge for manufacturers of synthetic alternatives, requiring significant R&D investment to reformulate products. Supply chain disruptions, raw material price volatility, and the complex global logistics of distributing perishable food products can impact operational efficiency and profitability. Intense competition among key players and the emergence of specialized niche providers also contribute to market pressures, demanding continuous innovation and cost optimization.
Emerging Opportunities in Food Preservatives Industry
The food preservatives market presents numerous emerging opportunities. The growing demand for plant-based and vegan food products creates opportunities for natural preservatives that align with these dietary trends. The expansion of the ready meals and convenience food sectors, especially in developing economies, offers a significant growth avenue for preservatives that enhance shelf life and maintain product quality. Advancements in biotechnology are paving the way for the development of novel antimicrobial agents and fermentation-derived preservatives with improved efficacy and cleaner labels. Furthermore, the integration of food preservatives with smart packaging technologies that indicate spoilage and enhance shelf-life monitoring presents a futuristic market opportunity.
Leading Players in the Food Preservatives Industry Market
- Kemin Industries Inc.
- Givaudan SA
- Synthite Industries Ltd
- International Flavors & Fragrances Inc.
- Mane Kancor Ingredients Pvt Ltd
- BASF SE
- Tate & Lyle PLC
- Corbion NV
- Hawkins Watt Limited
- Eastman Chemical Company
Key Developments in Food Preservatives Industry Industry
- July 2022: Kemin Industries Inc. launched RUBINITE GC Dry, a natural food preservative and curing agent, offering an alternative to sodium nitrite for processed meats.
- March 2022: DSM introduced DelvoGuard cultures, providing clean-label solutions to extend the shelf life of dairy products like yogurt and cheese.
- November 2021: Tate & Lyle PLC commenced construction of a new biomass boiler at its acidulants plant in Santa Rosa, Brazil, emphasizing sustainable manufacturing.
- April 2021: Kemin Industries Inc. expanded its distribution agreement with DKSH to cover Kemin Food Technologies Asia in the Philippines and Indonesia.
Strategic Outlook for Food Preservatives Industry Market
The strategic outlook for the food preservatives market is highly positive, driven by sustained demand for food safety, extended shelf life, and a growing preference for natural and clean-label solutions. Companies that invest in research and development for natural preservatives and bio-based antimicrobial agents will likely gain a competitive edge. Expansion into emerging economies, particularly in Asia, presents significant growth potential. Strategic partnerships and acquisitions will continue to be crucial for market consolidation and technological advancement. Embracing sustainable manufacturing practices and offering integrated solutions that address consumer concerns about health and environmental impact will be key to long-term success in this dynamic industry.
Food Preservatives Industry Segmentation
-
1. Type
-
1.1. Antioxidants
- 1.1.1. Natural Antioxidants
- 1.1.2. Synthetic Antioxidants
-
1.2. Antimicrobials
- 1.2.1. Natural Antimicrobial
- 1.2.2. Synthetic Antimicrobial
- 1.3. Acidulant
- 1.4. Other Types
-
1.1. Antioxidants
-
2. Application
- 2.1. Bakery and Confectionery
- 2.2. Meat and Poultry
- 2.3. Ready Meals
- 2.4. Sweet and Savory Snacks
- 2.5. Sauces and Dressings
- 2.6. Edible Oils
- 2.7. Other Applications
Food Preservatives Industry Segmentation By Geography
-
1. North America
- 1.1. United States
- 1.2. Canada
- 1.3. Mexico
- 1.4. Rest of North America
-
2. Europe
- 2.1. Spain
- 2.2. United Kingdom
- 2.3. Germany
- 2.4. France
- 2.5. Italy
- 2.6. Russia
- 2.7. Rest of Europe
-
3. Asia Pacific
- 3.1. China
- 3.2. Japan
- 3.3. India
- 3.4. Australia
- 3.5. Rest of Asia Pacific
-
4. South America
- 4.1. Brazil
- 4.2. Argentina
- 4.3. Rest of South America
-
5. Middle East and Africa
- 5.1. South Africa
- 5.2. United Arab Emirates
- 5.3. Rest of Middle East and Africa
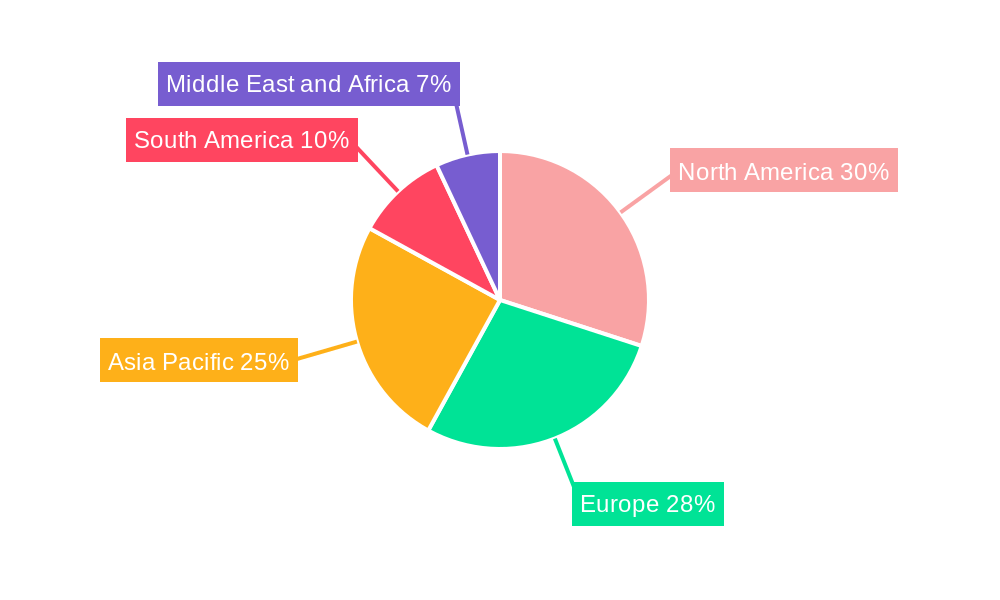
Food Preservatives Industry Regional Market Share
Geographic Coverage of Food Preservatives Industry
Food Preservatives Industry REPORT HIGHLIGHTS
| Aspects | Details |
|---|---|
| Study Period | 2020-2034 |
| Base Year | 2025 |
| Estimated Year | 2026 |
| Forecast Period | 2026-2034 |
| Historical Period | 2020-2025 |
| Growth Rate | CAGR of 4.81% from 2020-2034 |
| Segmentation |
|
Table of Contents
- 1. Introduction
- 1.1. Research Scope
- 1.2. Market Segmentation
- 1.3. Research Methodology
- 1.4. Definitions and Assumptions
- 2. Executive Summary
- 2.1. Introduction
- 3. Market Dynamics
- 3.1. Introduction
- 3.2. Market Drivers
- 3.3. Market Restrains
- 3.4. Market Trends
- 3.4.1. Surge in Demand for Clean Label Food Products
- 4. Market Factor Analysis
- 4.1. Porters Five Forces
- 4.2. Supply/Value Chain
- 4.3. PESTEL analysis
- 4.4. Market Entropy
- 4.5. Patent/Trademark Analysis
- 5. Global Food Preservatives Industry Analysis, Insights and Forecast, 2020-2032
- 5.1. Market Analysis, Insights and Forecast - by Type
- 5.1.1. Antioxidants
- 5.1.1.1. Natural Antioxidants
- 5.1.1.2. Synthetic Antioxidants
- 5.1.2. Antimicrobials
- 5.1.2.1. Natural Antimicrobial
- 5.1.2.2. Synthetic Antimicrobial
- 5.1.3. Acidulant
- 5.1.4. Other Types
- 5.1.1. Antioxidants
- 5.2. Market Analysis, Insights and Forecast - by Application
- 5.2.1. Bakery and Confectionery
- 5.2.2. Meat and Poultry
- 5.2.3. Ready Meals
- 5.2.4. Sweet and Savory Snacks
- 5.2.5. Sauces and Dressings
- 5.2.6. Edible Oils
- 5.2.7. Other Applications
- 5.3. Market Analysis, Insights and Forecast - by Region
- 5.3.1. North America
- 5.3.2. Europe
- 5.3.3. Asia Pacific
- 5.3.4. South America
- 5.3.5. Middle East and Africa
- 5.1. Market Analysis, Insights and Forecast - by Type
- 6. North America Food Preservatives Industry Analysis, Insights and Forecast, 2020-2032
- 6.1. Market Analysis, Insights and Forecast - by Type
- 6.1.1. Antioxidants
- 6.1.1.1. Natural Antioxidants
- 6.1.1.2. Synthetic Antioxidants
- 6.1.2. Antimicrobials
- 6.1.2.1. Natural Antimicrobial
- 6.1.2.2. Synthetic Antimicrobial
- 6.1.3. Acidulant
- 6.1.4. Other Types
- 6.1.1. Antioxidants
- 6.2. Market Analysis, Insights and Forecast - by Application
- 6.2.1. Bakery and Confectionery
- 6.2.2. Meat and Poultry
- 6.2.3. Ready Meals
- 6.2.4. Sweet and Savory Snacks
- 6.2.5. Sauces and Dressings
- 6.2.6. Edible Oils
- 6.2.7. Other Applications
- 6.1. Market Analysis, Insights and Forecast - by Type
- 7. Europe Food Preservatives Industry Analysis, Insights and Forecast, 2020-2032
- 7.1. Market Analysis, Insights and Forecast - by Type
- 7.1.1. Antioxidants
- 7.1.1.1. Natural Antioxidants
- 7.1.1.2. Synthetic Antioxidants
- 7.1.2. Antimicrobials
- 7.1.2.1. Natural Antimicrobial
- 7.1.2.2. Synthetic Antimicrobial
- 7.1.3. Acidulant
- 7.1.4. Other Types
- 7.1.1. Antioxidants
- 7.2. Market Analysis, Insights and Forecast - by Application
- 7.2.1. Bakery and Confectionery
- 7.2.2. Meat and Poultry
- 7.2.3. Ready Meals
- 7.2.4. Sweet and Savory Snacks
- 7.2.5. Sauces and Dressings
- 7.2.6. Edible Oils
- 7.2.7. Other Applications
- 7.1. Market Analysis, Insights and Forecast - by Type
- 8. Asia Pacific Food Preservatives Industry Analysis, Insights and Forecast, 2020-2032
- 8.1. Market Analysis, Insights and Forecast - by Type
- 8.1.1. Antioxidants
- 8.1.1.1. Natural Antioxidants
- 8.1.1.2. Synthetic Antioxidants
- 8.1.2. Antimicrobials
- 8.1.2.1. Natural Antimicrobial
- 8.1.2.2. Synthetic Antimicrobial
- 8.1.3. Acidulant
- 8.1.4. Other Types
- 8.1.1. Antioxidants
- 8.2. Market Analysis, Insights and Forecast - by Application
- 8.2.1. Bakery and Confectionery
- 8.2.2. Meat and Poultry
- 8.2.3. Ready Meals
- 8.2.4. Sweet and Savory Snacks
- 8.2.5. Sauces and Dressings
- 8.2.6. Edible Oils
- 8.2.7. Other Applications
- 8.1. Market Analysis, Insights and Forecast - by Type
- 9. South America Food Preservatives Industry Analysis, Insights and Forecast, 2020-2032
- 9.1. Market Analysis, Insights and Forecast - by Type
- 9.1.1. Antioxidants
- 9.1.1.1. Natural Antioxidants
- 9.1.1.2. Synthetic Antioxidants
- 9.1.2. Antimicrobials
- 9.1.2.1. Natural Antimicrobial
- 9.1.2.2. Synthetic Antimicrobial
- 9.1.3. Acidulant
- 9.1.4. Other Types
- 9.1.1. Antioxidants
- 9.2. Market Analysis, Insights and Forecast - by Application
- 9.2.1. Bakery and Confectionery
- 9.2.2. Meat and Poultry
- 9.2.3. Ready Meals
- 9.2.4. Sweet and Savory Snacks
- 9.2.5. Sauces and Dressings
- 9.2.6. Edible Oils
- 9.2.7. Other Applications
- 9.1. Market Analysis, Insights and Forecast - by Type
- 10. Middle East and Africa Food Preservatives Industry Analysis, Insights and Forecast, 2020-2032
- 10.1. Market Analysis, Insights and Forecast - by Type
- 10.1.1. Antioxidants
- 10.1.1.1. Natural Antioxidants
- 10.1.1.2. Synthetic Antioxidants
- 10.1.2. Antimicrobials
- 10.1.2.1. Natural Antimicrobial
- 10.1.2.2. Synthetic Antimicrobial
- 10.1.3. Acidulant
- 10.1.4. Other Types
- 10.1.1. Antioxidants
- 10.2. Market Analysis, Insights and Forecast - by Application
- 10.2.1. Bakery and Confectionery
- 10.2.2. Meat and Poultry
- 10.2.3. Ready Meals
- 10.2.4. Sweet and Savory Snacks
- 10.2.5. Sauces and Dressings
- 10.2.6. Edible Oils
- 10.2.7. Other Applications
- 10.1. Market Analysis, Insights and Forecast - by Type
- 11. Competitive Analysis
- 11.1. Global Market Share Analysis 2025
- 11.2. Company Profiles
- 11.2.1 Kemin Industries Inc
- 11.2.1.1. Overview
- 11.2.1.2. Products
- 11.2.1.3. SWOT Analysis
- 11.2.1.4. Recent Developments
- 11.2.1.5. Financials (Based on Availability)
- 11.2.2 Givuadan SA
- 11.2.2.1. Overview
- 11.2.2.2. Products
- 11.2.2.3. SWOT Analysis
- 11.2.2.4. Recent Developments
- 11.2.2.5. Financials (Based on Availability)
- 11.2.3 Synthite Industries Ltd
- 11.2.3.1. Overview
- 11.2.3.2. Products
- 11.2.3.3. SWOT Analysis
- 11.2.3.4. Recent Developments
- 11.2.3.5. Financials (Based on Availability)
- 11.2.4 International Flavors & Fragrances Inc
- 11.2.4.1. Overview
- 11.2.4.2. Products
- 11.2.4.3. SWOT Analysis
- 11.2.4.4. Recent Developments
- 11.2.4.5. Financials (Based on Availability)
- 11.2.5 Mane Kancor Ingredients Pvt Ltd
- 11.2.5.1. Overview
- 11.2.5.2. Products
- 11.2.5.3. SWOT Analysis
- 11.2.5.4. Recent Developments
- 11.2.5.5. Financials (Based on Availability)
- 11.2.6 BASF SE
- 11.2.6.1. Overview
- 11.2.6.2. Products
- 11.2.6.3. SWOT Analysis
- 11.2.6.4. Recent Developments
- 11.2.6.5. Financials (Based on Availability)
- 11.2.7 Tate & Lyle PLC
- 11.2.7.1. Overview
- 11.2.7.2. Products
- 11.2.7.3. SWOT Analysis
- 11.2.7.4. Recent Developments
- 11.2.7.5. Financials (Based on Availability)
- 11.2.8 Corbion NV
- 11.2.8.1. Overview
- 11.2.8.2. Products
- 11.2.8.3. SWOT Analysis
- 11.2.8.4. Recent Developments
- 11.2.8.5. Financials (Based on Availability)
- 11.2.9 Hawkins Watt Limited
- 11.2.9.1. Overview
- 11.2.9.2. Products
- 11.2.9.3. SWOT Analysis
- 11.2.9.4. Recent Developments
- 11.2.9.5. Financials (Based on Availability)
- 11.2.10 Eastman Chemical Company*List Not Exhaustive
- 11.2.10.1. Overview
- 11.2.10.2. Products
- 11.2.10.3. SWOT Analysis
- 11.2.10.4. Recent Developments
- 11.2.10.5. Financials (Based on Availability)
- 11.2.1 Kemin Industries Inc
List of Figures
- Figure 1: Global Food Preservatives Industry Revenue Breakdown (Million, %) by Region 2025 & 2033
- Figure 2: Global Food Preservatives Industry Volume Breakdown (Billion, %) by Region 2025 & 2033
- Figure 3: North America Food Preservatives Industry Revenue (Million), by Type 2025 & 2033
- Figure 4: North America Food Preservatives Industry Volume (Billion), by Type 2025 & 2033
- Figure 5: North America Food Preservatives Industry Revenue Share (%), by Type 2025 & 2033
- Figure 6: North America Food Preservatives Industry Volume Share (%), by Type 2025 & 2033
- Figure 7: North America Food Preservatives Industry Revenue (Million), by Application 2025 & 2033
- Figure 8: North America Food Preservatives Industry Volume (Billion), by Application 2025 & 2033
- Figure 9: North America Food Preservatives Industry Revenue Share (%), by Application 2025 & 2033
- Figure 10: North America Food Preservatives Industry Volume Share (%), by Application 2025 & 2033
- Figure 11: North America Food Preservatives Industry Revenue (Million), by Country 2025 & 2033
- Figure 12: North America Food Preservatives Industry Volume (Billion), by Country 2025 & 2033
- Figure 13: North America Food Preservatives Industry Revenue Share (%), by Country 2025 & 2033
- Figure 14: North America Food Preservatives Industry Volume Share (%), by Country 2025 & 2033
- Figure 15: Europe Food Preservatives Industry Revenue (Million), by Type 2025 & 2033
- Figure 16: Europe Food Preservatives Industry Volume (Billion), by Type 2025 & 2033
- Figure 17: Europe Food Preservatives Industry Revenue Share (%), by Type 2025 & 2033
- Figure 18: Europe Food Preservatives Industry Volume Share (%), by Type 2025 & 2033
- Figure 19: Europe Food Preservatives Industry Revenue (Million), by Application 2025 & 2033
- Figure 20: Europe Food Preservatives Industry Volume (Billion), by Application 2025 & 2033
- Figure 21: Europe Food Preservatives Industry Revenue Share (%), by Application 2025 & 2033
- Figure 22: Europe Food Preservatives Industry Volume Share (%), by Application 2025 & 2033
- Figure 23: Europe Food Preservatives Industry Revenue (Million), by Country 2025 & 2033
- Figure 24: Europe Food Preservatives Industry Volume (Billion), by Country 2025 & 2033
- Figure 25: Europe Food Preservatives Industry Revenue Share (%), by Country 2025 & 2033
- Figure 26: Europe Food Preservatives Industry Volume Share (%), by Country 2025 & 2033
- Figure 27: Asia Pacific Food Preservatives Industry Revenue (Million), by Type 2025 & 2033
- Figure 28: Asia Pacific Food Preservatives Industry Volume (Billion), by Type 2025 & 2033
- Figure 29: Asia Pacific Food Preservatives Industry Revenue Share (%), by Type 2025 & 2033
- Figure 30: Asia Pacific Food Preservatives Industry Volume Share (%), by Type 2025 & 2033
- Figure 31: Asia Pacific Food Preservatives Industry Revenue (Million), by Application 2025 & 2033
- Figure 32: Asia Pacific Food Preservatives Industry Volume (Billion), by Application 2025 & 2033
- Figure 33: Asia Pacific Food Preservatives Industry Revenue Share (%), by Application 2025 & 2033
- Figure 34: Asia Pacific Food Preservatives Industry Volume Share (%), by Application 2025 & 2033
- Figure 35: Asia Pacific Food Preservatives Industry Revenue (Million), by Country 2025 & 2033
- Figure 36: Asia Pacific Food Preservatives Industry Volume (Billion), by Country 2025 & 2033
- Figure 37: Asia Pacific Food Preservatives Industry Revenue Share (%), by Country 2025 & 2033
- Figure 38: Asia Pacific Food Preservatives Industry Volume Share (%), by Country 2025 & 2033
- Figure 39: South America Food Preservatives Industry Revenue (Million), by Type 2025 & 2033
- Figure 40: South America Food Preservatives Industry Volume (Billion), by Type 2025 & 2033
- Figure 41: South America Food Preservatives Industry Revenue Share (%), by Type 2025 & 2033
- Figure 42: South America Food Preservatives Industry Volume Share (%), by Type 2025 & 2033
- Figure 43: South America Food Preservatives Industry Revenue (Million), by Application 2025 & 2033
- Figure 44: South America Food Preservatives Industry Volume (Billion), by Application 2025 & 2033
- Figure 45: South America Food Preservatives Industry Revenue Share (%), by Application 2025 & 2033
- Figure 46: South America Food Preservatives Industry Volume Share (%), by Application 2025 & 2033
- Figure 47: South America Food Preservatives Industry Revenue (Million), by Country 2025 & 2033
- Figure 48: South America Food Preservatives Industry Volume (Billion), by Country 2025 & 2033
- Figure 49: South America Food Preservatives Industry Revenue Share (%), by Country 2025 & 2033
- Figure 50: South America Food Preservatives Industry Volume Share (%), by Country 2025 & 2033
- Figure 51: Middle East and Africa Food Preservatives Industry Revenue (Million), by Type 2025 & 2033
- Figure 52: Middle East and Africa Food Preservatives Industry Volume (Billion), by Type 2025 & 2033
- Figure 53: Middle East and Africa Food Preservatives Industry Revenue Share (%), by Type 2025 & 2033
- Figure 54: Middle East and Africa Food Preservatives Industry Volume Share (%), by Type 2025 & 2033
- Figure 55: Middle East and Africa Food Preservatives Industry Revenue (Million), by Application 2025 & 2033
- Figure 56: Middle East and Africa Food Preservatives Industry Volume (Billion), by Application 2025 & 2033
- Figure 57: Middle East and Africa Food Preservatives Industry Revenue Share (%), by Application 2025 & 2033
- Figure 58: Middle East and Africa Food Preservatives Industry Volume Share (%), by Application 2025 & 2033
- Figure 59: Middle East and Africa Food Preservatives Industry Revenue (Million), by Country 2025 & 2033
- Figure 60: Middle East and Africa Food Preservatives Industry Volume (Billion), by Country 2025 & 2033
- Figure 61: Middle East and Africa Food Preservatives Industry Revenue Share (%), by Country 2025 & 2033
- Figure 62: Middle East and Africa Food Preservatives Industry Volume Share (%), by Country 2025 & 2033
List of Tables
- Table 1: Global Food Preservatives Industry Revenue Million Forecast, by Type 2020 & 2033
- Table 2: Global Food Preservatives Industry Volume Billion Forecast, by Type 2020 & 2033
- Table 3: Global Food Preservatives Industry Revenue Million Forecast, by Application 2020 & 2033
- Table 4: Global Food Preservatives Industry Volume Billion Forecast, by Application 2020 & 2033
- Table 5: Global Food Preservatives Industry Revenue Million Forecast, by Region 2020 & 2033
- Table 6: Global Food Preservatives Industry Volume Billion Forecast, by Region 2020 & 2033
- Table 7: Global Food Preservatives Industry Revenue Million Forecast, by Type 2020 & 2033
- Table 8: Global Food Preservatives Industry Volume Billion Forecast, by Type 2020 & 2033
- Table 9: Global Food Preservatives Industry Revenue Million Forecast, by Application 2020 & 2033
- Table 10: Global Food Preservatives Industry Volume Billion Forecast, by Application 2020 & 2033
- Table 11: Global Food Preservatives Industry Revenue Million Forecast, by Country 2020 & 2033
- Table 12: Global Food Preservatives Industry Volume Billion Forecast, by Country 2020 & 2033
- Table 13: United States Food Preservatives Industry Revenue (Million) Forecast, by Application 2020 & 2033
- Table 14: United States Food Preservatives Industry Volume (Billion) Forecast, by Application 2020 & 2033
- Table 15: Canada Food Preservatives Industry Revenue (Million) Forecast, by Application 2020 & 2033
- Table 16: Canada Food Preservatives Industry Volume (Billion) Forecast, by Application 2020 & 2033
- Table 17: Mexico Food Preservatives Industry Revenue (Million) Forecast, by Application 2020 & 2033
- Table 18: Mexico Food Preservatives Industry Volume (Billion) Forecast, by Application 2020 & 2033
- Table 19: Rest of North America Food Preservatives Industry Revenue (Million) Forecast, by Application 2020 & 2033
- Table 20: Rest of North America Food Preservatives Industry Volume (Billion) Forecast, by Application 2020 & 2033
- Table 21: Global Food Preservatives Industry Revenue Million Forecast, by Type 2020 & 2033
- Table 22: Global Food Preservatives Industry Volume Billion Forecast, by Type 2020 & 2033
- Table 23: Global Food Preservatives Industry Revenue Million Forecast, by Application 2020 & 2033
- Table 24: Global Food Preservatives Industry Volume Billion Forecast, by Application 2020 & 2033
- Table 25: Global Food Preservatives Industry Revenue Million Forecast, by Country 2020 & 2033
- Table 26: Global Food Preservatives Industry Volume Billion Forecast, by Country 2020 & 2033
- Table 27: Spain Food Preservatives Industry Revenue (Million) Forecast, by Application 2020 & 2033
- Table 28: Spain Food Preservatives Industry Volume (Billion) Forecast, by Application 2020 & 2033
- Table 29: United Kingdom Food Preservatives Industry Revenue (Million) Forecast, by Application 2020 & 2033
- Table 30: United Kingdom Food Preservatives Industry Volume (Billion) Forecast, by Application 2020 & 2033
- Table 31: Germany Food Preservatives Industry Revenue (Million) Forecast, by Application 2020 & 2033
- Table 32: Germany Food Preservatives Industry Volume (Billion) Forecast, by Application 2020 & 2033
- Table 33: France Food Preservatives Industry Revenue (Million) Forecast, by Application 2020 & 2033
- Table 34: France Food Preservatives Industry Volume (Billion) Forecast, by Application 2020 & 2033
- Table 35: Italy Food Preservatives Industry Revenue (Million) Forecast, by Application 2020 & 2033
- Table 36: Italy Food Preservatives Industry Volume (Billion) Forecast, by Application 2020 & 2033
- Table 37: Russia Food Preservatives Industry Revenue (Million) Forecast, by Application 2020 & 2033
- Table 38: Russia Food Preservatives Industry Volume (Billion) Forecast, by Application 2020 & 2033
- Table 39: Rest of Europe Food Preservatives Industry Revenue (Million) Forecast, by Application 2020 & 2033
- Table 40: Rest of Europe Food Preservatives Industry Volume (Billion) Forecast, by Application 2020 & 2033
- Table 41: Global Food Preservatives Industry Revenue Million Forecast, by Type 2020 & 2033
- Table 42: Global Food Preservatives Industry Volume Billion Forecast, by Type 2020 & 2033
- Table 43: Global Food Preservatives Industry Revenue Million Forecast, by Application 2020 & 2033
- Table 44: Global Food Preservatives Industry Volume Billion Forecast, by Application 2020 & 2033
- Table 45: Global Food Preservatives Industry Revenue Million Forecast, by Country 2020 & 2033
- Table 46: Global Food Preservatives Industry Volume Billion Forecast, by Country 2020 & 2033
- Table 47: China Food Preservatives Industry Revenue (Million) Forecast, by Application 2020 & 2033
- Table 48: China Food Preservatives Industry Volume (Billion) Forecast, by Application 2020 & 2033
- Table 49: Japan Food Preservatives Industry Revenue (Million) Forecast, by Application 2020 & 2033
- Table 50: Japan Food Preservatives Industry Volume (Billion) Forecast, by Application 2020 & 2033
- Table 51: India Food Preservatives Industry Revenue (Million) Forecast, by Application 2020 & 2033
- Table 52: India Food Preservatives Industry Volume (Billion) Forecast, by Application 2020 & 2033
- Table 53: Australia Food Preservatives Industry Revenue (Million) Forecast, by Application 2020 & 2033
- Table 54: Australia Food Preservatives Industry Volume (Billion) Forecast, by Application 2020 & 2033
- Table 55: Rest of Asia Pacific Food Preservatives Industry Revenue (Million) Forecast, by Application 2020 & 2033
- Table 56: Rest of Asia Pacific Food Preservatives Industry Volume (Billion) Forecast, by Application 2020 & 2033
- Table 57: Global Food Preservatives Industry Revenue Million Forecast, by Type 2020 & 2033
- Table 58: Global Food Preservatives Industry Volume Billion Forecast, by Type 2020 & 2033
- Table 59: Global Food Preservatives Industry Revenue Million Forecast, by Application 2020 & 2033
- Table 60: Global Food Preservatives Industry Volume Billion Forecast, by Application 2020 & 2033
- Table 61: Global Food Preservatives Industry Revenue Million Forecast, by Country 2020 & 2033
- Table 62: Global Food Preservatives Industry Volume Billion Forecast, by Country 2020 & 2033
- Table 63: Brazil Food Preservatives Industry Revenue (Million) Forecast, by Application 2020 & 2033
- Table 64: Brazil Food Preservatives Industry Volume (Billion) Forecast, by Application 2020 & 2033
- Table 65: Argentina Food Preservatives Industry Revenue (Million) Forecast, by Application 2020 & 2033
- Table 66: Argentina Food Preservatives Industry Volume (Billion) Forecast, by Application 2020 & 2033
- Table 67: Rest of South America Food Preservatives Industry Revenue (Million) Forecast, by Application 2020 & 2033
- Table 68: Rest of South America Food Preservatives Industry Volume (Billion) Forecast, by Application 2020 & 2033
- Table 69: Global Food Preservatives Industry Revenue Million Forecast, by Type 2020 & 2033
- Table 70: Global Food Preservatives Industry Volume Billion Forecast, by Type 2020 & 2033
- Table 71: Global Food Preservatives Industry Revenue Million Forecast, by Application 2020 & 2033
- Table 72: Global Food Preservatives Industry Volume Billion Forecast, by Application 2020 & 2033
- Table 73: Global Food Preservatives Industry Revenue Million Forecast, by Country 2020 & 2033
- Table 74: Global Food Preservatives Industry Volume Billion Forecast, by Country 2020 & 2033
- Table 75: South Africa Food Preservatives Industry Revenue (Million) Forecast, by Application 2020 & 2033
- Table 76: South Africa Food Preservatives Industry Volume (Billion) Forecast, by Application 2020 & 2033
- Table 77: United Arab Emirates Food Preservatives Industry Revenue (Million) Forecast, by Application 2020 & 2033
- Table 78: United Arab Emirates Food Preservatives Industry Volume (Billion) Forecast, by Application 2020 & 2033
- Table 79: Rest of Middle East and Africa Food Preservatives Industry Revenue (Million) Forecast, by Application 2020 & 2033
- Table 80: Rest of Middle East and Africa Food Preservatives Industry Volume (Billion) Forecast, by Application 2020 & 2033
Frequently Asked Questions
1. What is the projected Compound Annual Growth Rate (CAGR) of the Food Preservatives Industry?
The projected CAGR is approximately 4.81%.
2. Which companies are prominent players in the Food Preservatives Industry?
Key companies in the market include Kemin Industries Inc, Givuadan SA, Synthite Industries Ltd, International Flavors & Fragrances Inc, Mane Kancor Ingredients Pvt Ltd, BASF SE, Tate & Lyle PLC, Corbion NV, Hawkins Watt Limited, Eastman Chemical Company*List Not Exhaustive.
3. What are the main segments of the Food Preservatives Industry?
The market segments include Type, Application.
4. Can you provide details about the market size?
The market size is estimated to be USD 3.40 Million as of 2022.
5. What are some drivers contributing to market growth?
N/A
6. What are the notable trends driving market growth?
Surge in Demand for Clean Label Food Products.
7. Are there any restraints impacting market growth?
N/A
8. Can you provide examples of recent developments in the market?
July 2022: Kemin Industries Inc. launched a new food preservative, RUBINITE GC Dry, as a substitute for sodium nitrite. As per the company, RUBINITE is a natural alternative that can be used as a curing agent in foods, offering the best microbiological protection and maintaining product stability. Furthermore, Kemin Industries intends to employ it in processed meat products like sausages and hot dogs.
9. What pricing options are available for accessing the report?
Pricing options include single-user, multi-user, and enterprise licenses priced at USD 4750, USD 5250, and USD 8750 respectively.
10. Is the market size provided in terms of value or volume?
The market size is provided in terms of value, measured in Million and volume, measured in Billion.
11. Are there any specific market keywords associated with the report?
Yes, the market keyword associated with the report is "Food Preservatives Industry," which aids in identifying and referencing the specific market segment covered.
12. How do I determine which pricing option suits my needs best?
The pricing options vary based on user requirements and access needs. Individual users may opt for single-user licenses, while businesses requiring broader access may choose multi-user or enterprise licenses for cost-effective access to the report.
13. Are there any additional resources or data provided in the Food Preservatives Industry report?
While the report offers comprehensive insights, it's advisable to review the specific contents or supplementary materials provided to ascertain if additional resources or data are available.
14. How can I stay updated on further developments or reports in the Food Preservatives Industry?
To stay informed about further developments, trends, and reports in the Food Preservatives Industry, consider subscribing to industry newsletters, following relevant companies and organizations, or regularly checking reputable industry news sources and publications.
Methodology
Step 1 - Identification of Relevant Samples Size from Population Database


Step 2 - Approaches for Defining Global Market Size (Value, Volume* & Price*)

Note*: In applicable scenarios
Step 3 - Data Sources
Primary Research
- Web Analytics
- Survey Reports
- Research Institute
- Latest Research Reports
- Opinion Leaders
Secondary Research
- Annual Reports
- White Paper
- Latest Press Release
- Industry Association
- Paid Database
- Investor Presentations

Step 4 - Data Triangulation
Involves using different sources of information in order to increase the validity of a study
These sources are likely to be stakeholders in a program - participants, other researchers, program staff, other community members, and so on.
Then we put all data in single framework & apply various statistical tools to find out the dynamic on the market.
During the analysis stage, feedback from the stakeholder groups would be compared to determine areas of agreement as well as areas of divergence