


Key Insights
The global aromatic rubber process oil market is experiencing robust growth, driven by the expanding tire and rubber industry, particularly in developing economies. The increasing demand for high-performance tires, coupled with advancements in rubber compounding techniques that leverage the unique properties of aromatic process oils, is a key factor fueling market expansion. A conservative estimate suggests a market size of approximately $2.5 billion in 2025, with a compound annual growth rate (CAGR) of around 5% projected through 2033. This growth is further supported by the rising production of automobiles and other rubber-based products. However, fluctuating crude oil prices and environmental concerns regarding the carbon footprint of oil-based products pose significant challenges to sustained growth. The market is segmented by type (e.g., naphthenic, paraffinic, aromatic), application (tire production, other rubber products), and region. Major players, including H&R Group, Orgkhim Biochemical Holdings, Total, and Repsol, are actively involved in research and development to improve product efficiency and sustainability, which will play a crucial role in shaping future market dynamics. Strategic partnerships, mergers, and acquisitions are expected to further consolidate the market landscape.

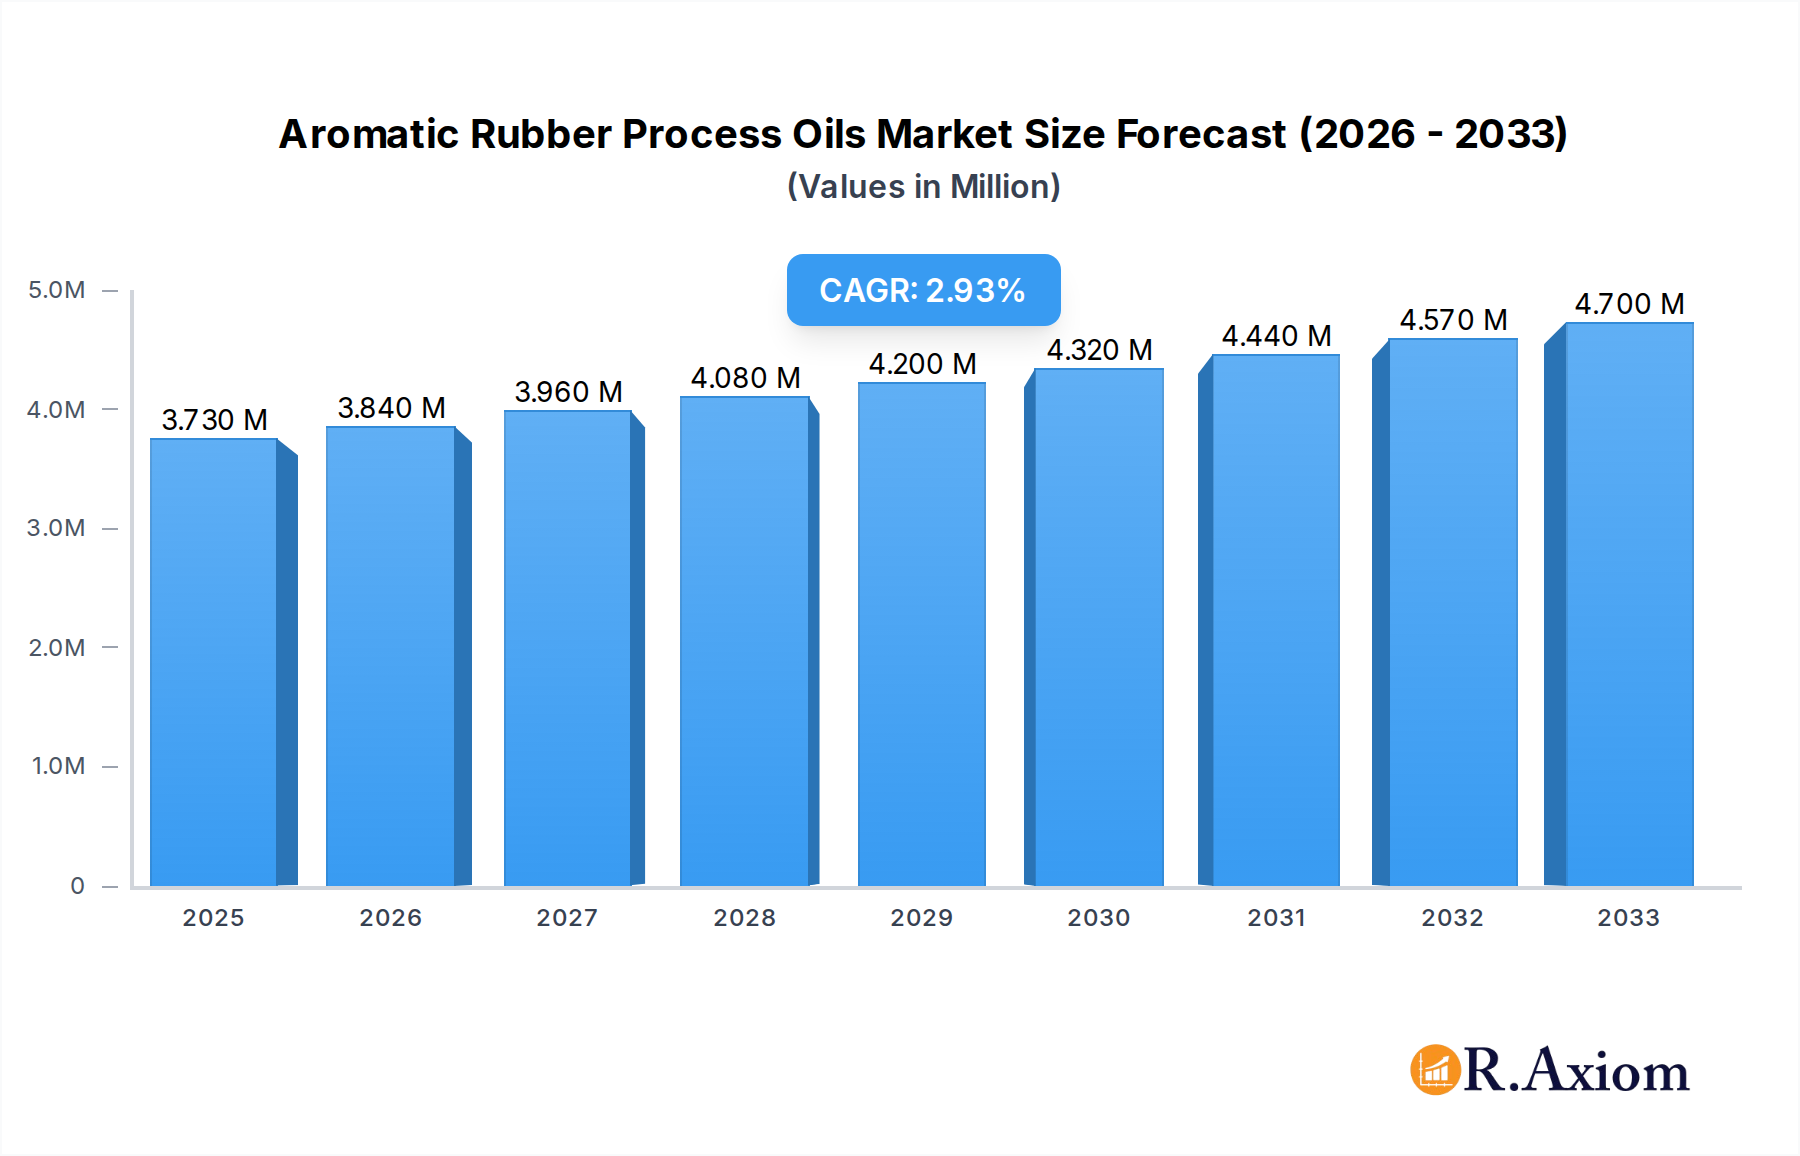
Aromatic Rubber Process Oils Market Size (In Billion)

The market's competitive dynamics are characterized by the presence of both large multinational corporations and smaller regional players. Companies are focusing on expanding their product portfolios to meet the diverse requirements of different rubber applications. Product innovation, focusing on improved performance characteristics such as viscosity, tackiness, and processability, is a key strategic initiative for many market participants. Furthermore, companies are increasingly emphasizing the development of environmentally friendly aromatic process oils to address growing sustainability concerns. Regional variations in demand are primarily driven by factors such as automotive production levels, infrastructure development, and economic growth. Asia-Pacific, particularly China and India, is projected to witness substantial growth owing to rapid industrialization and increasing vehicle ownership.
Aromatic Rubber Process Oils Company Market Share
Aromatic Rubber Process Oils Market: A Comprehensive Report (2019-2033)
This comprehensive report provides an in-depth analysis of the Aromatic Rubber Process Oils market, offering invaluable insights for industry stakeholders, investors, and strategic decision-makers. The report covers the period from 2019 to 2033, with a base year of 2025 and a forecast period extending to 2033. The study meticulously analyzes market dynamics, competitive landscapes, and growth opportunities, providing actionable intelligence for navigating this dynamic sector. The total market value is predicted to reach xx million by 2033.
Aromatic Rubber Process Oils Market Concentration & Innovation
This section analyzes the competitive landscape of the Aromatic Rubber Process Oils market, focusing on market concentration, innovation drivers, regulatory frameworks, product substitutes, end-user trends, and mergers and acquisitions (M&A) activities. The market is moderately concentrated, with key players holding significant shares. However, the presence of numerous smaller players fosters competition and innovation.
- Market Share: The top five players, including Total, Repsol, Shell, Nynas, and H&R Group, collectively hold approximately xx% of the global market share in 2025. Smaller players contribute the remaining xx%.
- Innovation Drivers: Technological advancements in refining processes, coupled with increasing demand for high-performance rubber products, are driving innovation in aromatic rubber process oils.
- Regulatory Landscape: Stringent environmental regulations concerning emissions and waste management are influencing the adoption of cleaner production methods and sustainable sourcing practices.
- Product Substitutes: While several substitutes exist, the unique properties of aromatic rubber process oils, particularly their plasticizing and processing aid characteristics, maintain their dominant position in the rubber industry.
- End-User Trends: The growing demand for tires, automotive components, and industrial rubber goods is directly driving the demand for aromatic rubber process oils.
- M&A Activities: The past five years have witnessed xx major M&A deals in the aromatic rubber process oil industry, with a total deal value exceeding xx million. These mergers often involved smaller players seeking acquisition by larger conglomerates.
Aromatic Rubber Process Oils Industry Trends & Insights
This section provides an in-depth analysis of the key trends and insights shaping the Aromatic Rubber Process Oils market. The global market exhibited a CAGR of xx% during the historical period (2019-2024) and is projected to maintain a CAGR of xx% during the forecast period (2025-2033). Market penetration is predicted to reach xx% by 2033. Growth is primarily driven by the burgeoning automotive and tire industries, particularly in developing economies. Technological advancements in refining technologies are contributing to improved product quality and efficiency. The rise of sustainable manufacturing practices and the increasing demand for high-performance rubber goods further propel market growth. However, fluctuating crude oil prices and environmental regulations pose significant challenges. Competitive dynamics are shaped by pricing strategies, product differentiation, and supply chain optimization.
Dominant Markets & Segments in Aromatic Rubber Process Oils
The Asia-Pacific region dominates the global aromatic rubber process oils market, driven by rapid industrialization and substantial automotive production in countries like China and India.
- Key Drivers in Asia-Pacific:
- Robust Automotive Industry: Significant growth in vehicle production fuels high demand for tires and other rubber components.
- Expanding Infrastructure: Investments in infrastructure development, including roads and bridges, further boost demand.
- Favorable Government Policies: Supportive government policies encouraging industrial growth contribute positively to market expansion.
- Lower Production Costs: Lower manufacturing costs in some regions increase the competitiveness of these markets.
The dominance of Asia-Pacific is attributed to several factors, including its strong economic growth, burgeoning automotive industry, and extensive infrastructure development projects. However, other regions, such as North America and Europe, also exhibit significant demand, although at a slower pace. Market segmentation by type (e.g., paraffinic, naphthenic) and application (e.g., tires, hoses, belts) is also considered.
Aromatic Rubber Process Oils Product Developments
Recent product innovations focus on improving processability, enhancing performance characteristics, and reducing environmental impact. This includes the development of higher purity oils with improved viscosity and dispersing properties and the introduction of bio-based alternatives aiming to meet rising sustainability requirements. These innovations are enhancing the market attractiveness of aromatic rubber process oils and catering to the increasing demand for high-performance rubber products in various industries. The market is witnessing a trend toward specialized oils tailored to specific applications, improving overall efficiency and performance.
Report Scope & Segmentation Analysis
This report segments the aromatic rubber process oils market based on several criteria, including product type, application, and region. Each segment presents unique growth projections and competitive dynamics. For instance, the tire segment holds the largest market share and is predicted to maintain its dominance due to its massive demand and growth potential. Regional segments are further analyzed, offering detailed insights into regional variations in market growth patterns, consumption trends, and competitive scenarios.
Key Drivers of Aromatic Rubber Process Oils Growth
The growth of the aromatic rubber process oils market is propelled by several key factors. The rising demand for tires and other rubber products, particularly from the rapidly expanding automotive industry, is a primary driver. Technological advancements in refining processes lead to the production of higher-quality oils with enhanced properties. Favorable economic conditions in several regions also contribute to increased demand. However, government regulations concerning environmental protection and resource sustainability are also significant influencers, pushing manufacturers to adopt more sustainable production practices.
Challenges in the Aromatic Rubber Process Oils Sector
Several challenges impede the growth of the aromatic rubber process oils market. Fluctuations in crude oil prices directly impact production costs and market stability. Stringent environmental regulations, aiming to reduce emissions and waste, necessitate investments in cleaner technologies. Intense competition among numerous manufacturers necessitates continuous innovation and cost optimization. Furthermore, the availability of substitutes and the rising popularity of bio-based alternatives add to the competitive pressure.
Emerging Opportunities in Aromatic Rubber Process Oils
Several emerging opportunities present themselves in the aromatic rubber process oils market. The growing adoption of electric vehicles (EVs) and hybrid vehicles presents a new market segment, requiring specialized oils optimized for EV tire performance. Advancements in 3D printing technology create new applications for aromatic rubber process oils. Increasing investments in sustainable technologies, such as bio-based oils and recycled rubber, offer significant opportunities for growth. Expansion into untapped markets in developing economies also presents substantial growth potential.
Leading Players in the Aromatic Rubber Process Oils Market
- H&R Group
- Orgkhim Biochemical Holdings
- Total
- Repsol
- CPC Corporation
- IRPC
- Shell
- Nynas
- Apar Industries
- Panama Petrochem
- Hollyfrontier Refining & Marketing
- ORLEN Unipetrol
- Behrang Oil Company
- Indian Oil Corporation
- Hindustan Petroleum Corporation
- Idemitsu Kosan
- Eagle Petrochem
- Lodha Petro
- Southwestern Petroleum Corporation
- Cross Oil
- CNOOC
- Shandong Tianyuan Chemical Co. Ltd
- Suzhou Jiutai Group
Key Developments in Aromatic Rubber Process Oils Industry
- 2022 Q3: Shell announced the launch of a new high-performance aromatic rubber process oil designed for electric vehicle tires.
- 2021 Q4: Repsol invested xx million in expanding its aromatic rubber process oil production capacity in Spain.
- 2020 Q1: A merger between two smaller aromatic rubber process oil producers resulted in a combined entity with xx million in annual revenue. (Further details would need to be researched and added here.)
Strategic Outlook for Aromatic Rubber Process Oils Market
The aromatic rubber process oils market is poised for continued growth, driven by the expanding global automotive industry, advancements in tire technology, and rising demand for high-performance rubber products. Opportunities exist in developing sustainable production methods, exploring new applications, and expanding into emerging markets. Companies focusing on innovation, sustainability, and efficient supply chain management will be best positioned to capture market share and achieve sustained growth in this dynamic sector. The market is expected to see increased consolidation through mergers and acquisitions as companies seek to gain scale and technological advantage.
Aromatic Rubber Process Oils Segmentation
-
1. Application
- 1.1. Tyre
- 1.2. Non-Tyre
-
2. Types
- 2.1. TDAE
- 2.2. MES
- 2.3. NAP
- 2.4. RAE
- 2.5. Others
Aromatic Rubber Process Oils Segmentation By Geography
-
1. North America
- 1.1. United States
- 1.2. Canada
- 1.3. Mexico
-
2. South America
- 2.1. Brazil
- 2.2. Argentina
- 2.3. Rest of South America
-
3. Europe
- 3.1. United Kingdom
- 3.2. Germany
- 3.3. France
- 3.4. Italy
- 3.5. Spain
- 3.6. Russia
- 3.7. Benelux
- 3.8. Nordics
- 3.9. Rest of Europe
-
4. Middle East & Africa
- 4.1. Turkey
- 4.2. Israel
- 4.3. GCC
- 4.4. North Africa
- 4.5. South Africa
- 4.6. Rest of Middle East & Africa
-
5. Asia Pacific
- 5.1. China
- 5.2. India
- 5.3. Japan
- 5.4. South Korea
- 5.5. ASEAN
- 5.6. Oceania
- 5.7. Rest of Asia Pacific
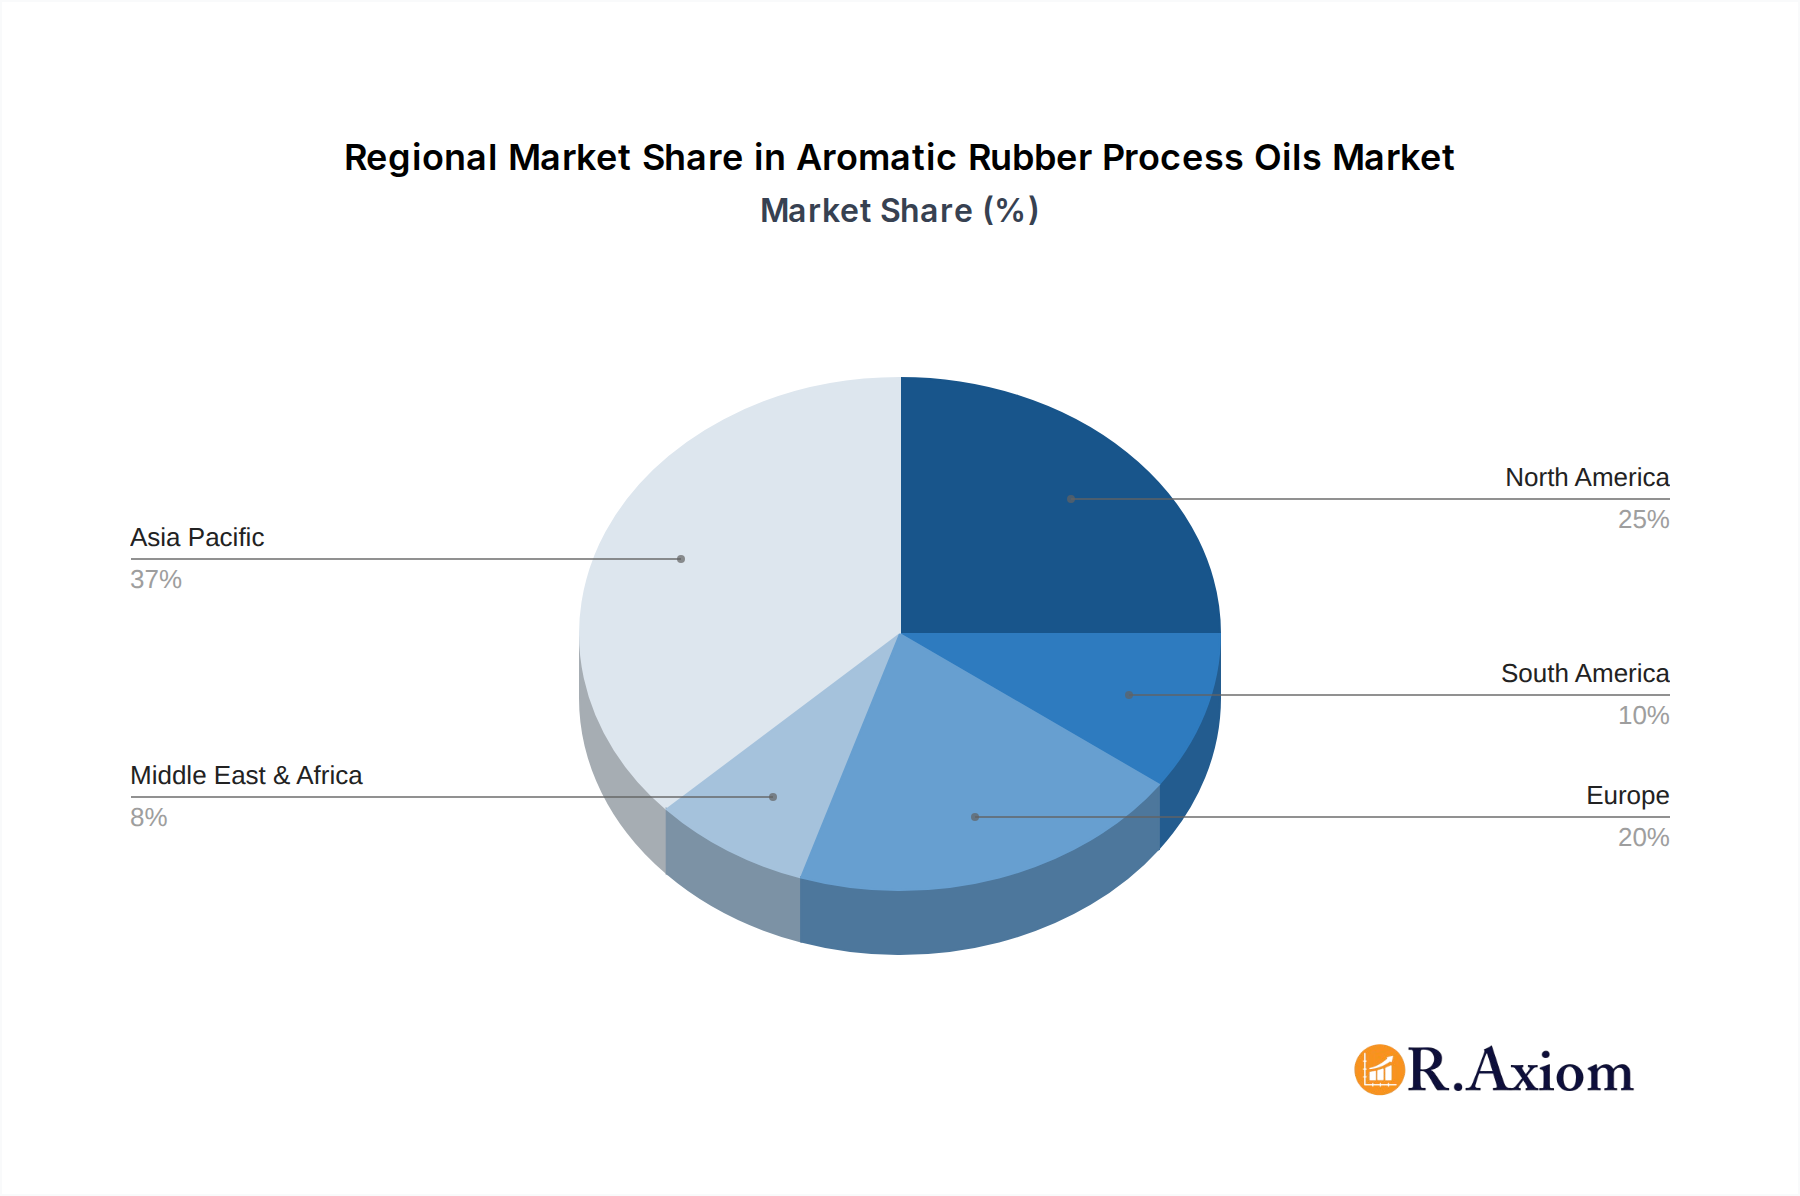
Aromatic Rubber Process Oils Regional Market Share
Geographic Coverage of Aromatic Rubber Process Oils
Aromatic Rubber Process Oils REPORT HIGHLIGHTS
| Aspects | Details |
|---|---|
| Study Period | 2020-2034 |
| Base Year | 2025 |
| Estimated Year | 2026 |
| Forecast Period | 2026-2034 |
| Historical Period | 2020-2025 |
| Growth Rate | CAGR of 2.93% from 2020-2034 |
| Segmentation |
|
Table of Contents
- 1. Introduction
- 1.1. Research Scope
- 1.2. Market Segmentation
- 1.3. Research Methodology
- 1.4. Definitions and Assumptions
- 2. Executive Summary
- 2.1. Introduction
- 3. Market Dynamics
- 3.1. Introduction
- 3.2. Market Drivers
- 3.3. Market Restrains
- 3.4. Market Trends
- 4. Market Factor Analysis
- 4.1. Porters Five Forces
- 4.2. Supply/Value Chain
- 4.3. PESTEL analysis
- 4.4. Market Entropy
- 4.5. Patent/Trademark Analysis
- 5. Global Aromatic Rubber Process Oils Analysis, Insights and Forecast, 2020-2032
- 5.1. Market Analysis, Insights and Forecast - by Application
- 5.1.1. Tyre
- 5.1.2. Non-Tyre
- 5.2. Market Analysis, Insights and Forecast - by Types
- 5.2.1. TDAE
- 5.2.2. MES
- 5.2.3. NAP
- 5.2.4. RAE
- 5.2.5. Others
- 5.3. Market Analysis, Insights and Forecast - by Region
- 5.3.1. North America
- 5.3.2. South America
- 5.3.3. Europe
- 5.3.4. Middle East & Africa
- 5.3.5. Asia Pacific
- 5.1. Market Analysis, Insights and Forecast - by Application
- 6. North America Aromatic Rubber Process Oils Analysis, Insights and Forecast, 2020-2032
- 6.1. Market Analysis, Insights and Forecast - by Application
- 6.1.1. Tyre
- 6.1.2. Non-Tyre
- 6.2. Market Analysis, Insights and Forecast - by Types
- 6.2.1. TDAE
- 6.2.2. MES
- 6.2.3. NAP
- 6.2.4. RAE
- 6.2.5. Others
- 6.1. Market Analysis, Insights and Forecast - by Application
- 7. South America Aromatic Rubber Process Oils Analysis, Insights and Forecast, 2020-2032
- 7.1. Market Analysis, Insights and Forecast - by Application
- 7.1.1. Tyre
- 7.1.2. Non-Tyre
- 7.2. Market Analysis, Insights and Forecast - by Types
- 7.2.1. TDAE
- 7.2.2. MES
- 7.2.3. NAP
- 7.2.4. RAE
- 7.2.5. Others
- 7.1. Market Analysis, Insights and Forecast - by Application
- 8. Europe Aromatic Rubber Process Oils Analysis, Insights and Forecast, 2020-2032
- 8.1. Market Analysis, Insights and Forecast - by Application
- 8.1.1. Tyre
- 8.1.2. Non-Tyre
- 8.2. Market Analysis, Insights and Forecast - by Types
- 8.2.1. TDAE
- 8.2.2. MES
- 8.2.3. NAP
- 8.2.4. RAE
- 8.2.5. Others
- 8.1. Market Analysis, Insights and Forecast - by Application
- 9. Middle East & Africa Aromatic Rubber Process Oils Analysis, Insights and Forecast, 2020-2032
- 9.1. Market Analysis, Insights and Forecast - by Application
- 9.1.1. Tyre
- 9.1.2. Non-Tyre
- 9.2. Market Analysis, Insights and Forecast - by Types
- 9.2.1. TDAE
- 9.2.2. MES
- 9.2.3. NAP
- 9.2.4. RAE
- 9.2.5. Others
- 9.1. Market Analysis, Insights and Forecast - by Application
- 10. Asia Pacific Aromatic Rubber Process Oils Analysis, Insights and Forecast, 2020-2032
- 10.1. Market Analysis, Insights and Forecast - by Application
- 10.1.1. Tyre
- 10.1.2. Non-Tyre
- 10.2. Market Analysis, Insights and Forecast - by Types
- 10.2.1. TDAE
- 10.2.2. MES
- 10.2.3. NAP
- 10.2.4. RAE
- 10.2.5. Others
- 10.1. Market Analysis, Insights and Forecast - by Application
- 11. Competitive Analysis
- 11.1. Global Market Share Analysis 2025
- 11.2. Company Profiles
- 11.2.1 H&R Group
- 11.2.1.1. Overview
- 11.2.1.2. Products
- 11.2.1.3. SWOT Analysis
- 11.2.1.4. Recent Developments
- 11.2.1.5. Financials (Based on Availability)
- 11.2.2 Orgkhim Biochemical Holdings
- 11.2.2.1. Overview
- 11.2.2.2. Products
- 11.2.2.3. SWOT Analysis
- 11.2.2.4. Recent Developments
- 11.2.2.5. Financials (Based on Availability)
- 11.2.3 Total
- 11.2.3.1. Overview
- 11.2.3.2. Products
- 11.2.3.3. SWOT Analysis
- 11.2.3.4. Recent Developments
- 11.2.3.5. Financials (Based on Availability)
- 11.2.4 Repsol
- 11.2.4.1. Overview
- 11.2.4.2. Products
- 11.2.4.3. SWOT Analysis
- 11.2.4.4. Recent Developments
- 11.2.4.5. Financials (Based on Availability)
- 11.2.5 CPC Corporation
- 11.2.5.1. Overview
- 11.2.5.2. Products
- 11.2.5.3. SWOT Analysis
- 11.2.5.4. Recent Developments
- 11.2.5.5. Financials (Based on Availability)
- 11.2.6 IRPC
- 11.2.6.1. Overview
- 11.2.6.2. Products
- 11.2.6.3. SWOT Analysis
- 11.2.6.4. Recent Developments
- 11.2.6.5. Financials (Based on Availability)
- 11.2.7 Shell
- 11.2.7.1. Overview
- 11.2.7.2. Products
- 11.2.7.3. SWOT Analysis
- 11.2.7.4. Recent Developments
- 11.2.7.5. Financials (Based on Availability)
- 11.2.8 Nynas
- 11.2.8.1. Overview
- 11.2.8.2. Products
- 11.2.8.3. SWOT Analysis
- 11.2.8.4. Recent Developments
- 11.2.8.5. Financials (Based on Availability)
- 11.2.9 Apar Industries
- 11.2.9.1. Overview
- 11.2.9.2. Products
- 11.2.9.3. SWOT Analysis
- 11.2.9.4. Recent Developments
- 11.2.9.5. Financials (Based on Availability)
- 11.2.10 Panama Petrochem
- 11.2.10.1. Overview
- 11.2.10.2. Products
- 11.2.10.3. SWOT Analysis
- 11.2.10.4. Recent Developments
- 11.2.10.5. Financials (Based on Availability)
- 11.2.11 Hollyfrontier Refining & Marketing
- 11.2.11.1. Overview
- 11.2.11.2. Products
- 11.2.11.3. SWOT Analysis
- 11.2.11.4. Recent Developments
- 11.2.11.5. Financials (Based on Availability)
- 11.2.12 ORLEN Unipetrol
- 11.2.12.1. Overview
- 11.2.12.2. Products
- 11.2.12.3. SWOT Analysis
- 11.2.12.4. Recent Developments
- 11.2.12.5. Financials (Based on Availability)
- 11.2.13 Behran Oil Company
- 11.2.13.1. Overview
- 11.2.13.2. Products
- 11.2.13.3. SWOT Analysis
- 11.2.13.4. Recent Developments
- 11.2.13.5. Financials (Based on Availability)
- 11.2.14 Indian Oil Corporation
- 11.2.14.1. Overview
- 11.2.14.2. Products
- 11.2.14.3. SWOT Analysis
- 11.2.14.4. Recent Developments
- 11.2.14.5. Financials (Based on Availability)
- 11.2.15 Hindustan Petroleum Corporation
- 11.2.15.1. Overview
- 11.2.15.2. Products
- 11.2.15.3. SWOT Analysis
- 11.2.15.4. Recent Developments
- 11.2.15.5. Financials (Based on Availability)
- 11.2.16 Idemitsu Kosan
- 11.2.16.1. Overview
- 11.2.16.2. Products
- 11.2.16.3. SWOT Analysis
- 11.2.16.4. Recent Developments
- 11.2.16.5. Financials (Based on Availability)
- 11.2.17 Eagle Petrochem
- 11.2.17.1. Overview
- 11.2.17.2. Products
- 11.2.17.3. SWOT Analysis
- 11.2.17.4. Recent Developments
- 11.2.17.5. Financials (Based on Availability)
- 11.2.18 Lodha Petro
- 11.2.18.1. Overview
- 11.2.18.2. Products
- 11.2.18.3. SWOT Analysis
- 11.2.18.4. Recent Developments
- 11.2.18.5. Financials (Based on Availability)
- 11.2.19 Southwestern Petroleum Corporation
- 11.2.19.1. Overview
- 11.2.19.2. Products
- 11.2.19.3. SWOT Analysis
- 11.2.19.4. Recent Developments
- 11.2.19.5. Financials (Based on Availability)
- 11.2.20 Cross Oil
- 11.2.20.1. Overview
- 11.2.20.2. Products
- 11.2.20.3. SWOT Analysis
- 11.2.20.4. Recent Developments
- 11.2.20.5. Financials (Based on Availability)
- 11.2.21 CNOOC
- 11.2.21.1. Overview
- 11.2.21.2. Products
- 11.2.21.3. SWOT Analysis
- 11.2.21.4. Recent Developments
- 11.2.21.5. Financials (Based on Availability)
- 11.2.22 Shandong Tianyuan Chemical Co. Ltd
- 11.2.22.1. Overview
- 11.2.22.2. Products
- 11.2.22.3. SWOT Analysis
- 11.2.22.4. Recent Developments
- 11.2.22.5. Financials (Based on Availability)
- 11.2.23 Suzhou Jiutai Group
- 11.2.23.1. Overview
- 11.2.23.2. Products
- 11.2.23.3. SWOT Analysis
- 11.2.23.4. Recent Developments
- 11.2.23.5. Financials (Based on Availability)
- 11.2.1 H&R Group
List of Figures
- Figure 1: Global Aromatic Rubber Process Oils Revenue Breakdown (undefined, %) by Region 2025 & 2033
- Figure 2: North America Aromatic Rubber Process Oils Revenue (undefined), by Application 2025 & 2033
- Figure 3: North America Aromatic Rubber Process Oils Revenue Share (%), by Application 2025 & 2033
- Figure 4: North America Aromatic Rubber Process Oils Revenue (undefined), by Types 2025 & 2033
- Figure 5: North America Aromatic Rubber Process Oils Revenue Share (%), by Types 2025 & 2033
- Figure 6: North America Aromatic Rubber Process Oils Revenue (undefined), by Country 2025 & 2033
- Figure 7: North America Aromatic Rubber Process Oils Revenue Share (%), by Country 2025 & 2033
- Figure 8: South America Aromatic Rubber Process Oils Revenue (undefined), by Application 2025 & 2033
- Figure 9: South America Aromatic Rubber Process Oils Revenue Share (%), by Application 2025 & 2033
- Figure 10: South America Aromatic Rubber Process Oils Revenue (undefined), by Types 2025 & 2033
- Figure 11: South America Aromatic Rubber Process Oils Revenue Share (%), by Types 2025 & 2033
- Figure 12: South America Aromatic Rubber Process Oils Revenue (undefined), by Country 2025 & 2033
- Figure 13: South America Aromatic Rubber Process Oils Revenue Share (%), by Country 2025 & 2033
- Figure 14: Europe Aromatic Rubber Process Oils Revenue (undefined), by Application 2025 & 2033
- Figure 15: Europe Aromatic Rubber Process Oils Revenue Share (%), by Application 2025 & 2033
- Figure 16: Europe Aromatic Rubber Process Oils Revenue (undefined), by Types 2025 & 2033
- Figure 17: Europe Aromatic Rubber Process Oils Revenue Share (%), by Types 2025 & 2033
- Figure 18: Europe Aromatic Rubber Process Oils Revenue (undefined), by Country 2025 & 2033
- Figure 19: Europe Aromatic Rubber Process Oils Revenue Share (%), by Country 2025 & 2033
- Figure 20: Middle East & Africa Aromatic Rubber Process Oils Revenue (undefined), by Application 2025 & 2033
- Figure 21: Middle East & Africa Aromatic Rubber Process Oils Revenue Share (%), by Application 2025 & 2033
- Figure 22: Middle East & Africa Aromatic Rubber Process Oils Revenue (undefined), by Types 2025 & 2033
- Figure 23: Middle East & Africa Aromatic Rubber Process Oils Revenue Share (%), by Types 2025 & 2033
- Figure 24: Middle East & Africa Aromatic Rubber Process Oils Revenue (undefined), by Country 2025 & 2033
- Figure 25: Middle East & Africa Aromatic Rubber Process Oils Revenue Share (%), by Country 2025 & 2033
- Figure 26: Asia Pacific Aromatic Rubber Process Oils Revenue (undefined), by Application 2025 & 2033
- Figure 27: Asia Pacific Aromatic Rubber Process Oils Revenue Share (%), by Application 2025 & 2033
- Figure 28: Asia Pacific Aromatic Rubber Process Oils Revenue (undefined), by Types 2025 & 2033
- Figure 29: Asia Pacific Aromatic Rubber Process Oils Revenue Share (%), by Types 2025 & 2033
- Figure 30: Asia Pacific Aromatic Rubber Process Oils Revenue (undefined), by Country 2025 & 2033
- Figure 31: Asia Pacific Aromatic Rubber Process Oils Revenue Share (%), by Country 2025 & 2033
List of Tables
- Table 1: Global Aromatic Rubber Process Oils Revenue undefined Forecast, by Application 2020 & 2033
- Table 2: Global Aromatic Rubber Process Oils Revenue undefined Forecast, by Types 2020 & 2033
- Table 3: Global Aromatic Rubber Process Oils Revenue undefined Forecast, by Region 2020 & 2033
- Table 4: Global Aromatic Rubber Process Oils Revenue undefined Forecast, by Application 2020 & 2033
- Table 5: Global Aromatic Rubber Process Oils Revenue undefined Forecast, by Types 2020 & 2033
- Table 6: Global Aromatic Rubber Process Oils Revenue undefined Forecast, by Country 2020 & 2033
- Table 7: United States Aromatic Rubber Process Oils Revenue (undefined) Forecast, by Application 2020 & 2033
- Table 8: Canada Aromatic Rubber Process Oils Revenue (undefined) Forecast, by Application 2020 & 2033
- Table 9: Mexico Aromatic Rubber Process Oils Revenue (undefined) Forecast, by Application 2020 & 2033
- Table 10: Global Aromatic Rubber Process Oils Revenue undefined Forecast, by Application 2020 & 2033
- Table 11: Global Aromatic Rubber Process Oils Revenue undefined Forecast, by Types 2020 & 2033
- Table 12: Global Aromatic Rubber Process Oils Revenue undefined Forecast, by Country 2020 & 2033
- Table 13: Brazil Aromatic Rubber Process Oils Revenue (undefined) Forecast, by Application 2020 & 2033
- Table 14: Argentina Aromatic Rubber Process Oils Revenue (undefined) Forecast, by Application 2020 & 2033
- Table 15: Rest of South America Aromatic Rubber Process Oils Revenue (undefined) Forecast, by Application 2020 & 2033
- Table 16: Global Aromatic Rubber Process Oils Revenue undefined Forecast, by Application 2020 & 2033
- Table 17: Global Aromatic Rubber Process Oils Revenue undefined Forecast, by Types 2020 & 2033
- Table 18: Global Aromatic Rubber Process Oils Revenue undefined Forecast, by Country 2020 & 2033
- Table 19: United Kingdom Aromatic Rubber Process Oils Revenue (undefined) Forecast, by Application 2020 & 2033
- Table 20: Germany Aromatic Rubber Process Oils Revenue (undefined) Forecast, by Application 2020 & 2033
- Table 21: France Aromatic Rubber Process Oils Revenue (undefined) Forecast, by Application 2020 & 2033
- Table 22: Italy Aromatic Rubber Process Oils Revenue (undefined) Forecast, by Application 2020 & 2033
- Table 23: Spain Aromatic Rubber Process Oils Revenue (undefined) Forecast, by Application 2020 & 2033
- Table 24: Russia Aromatic Rubber Process Oils Revenue (undefined) Forecast, by Application 2020 & 2033
- Table 25: Benelux Aromatic Rubber Process Oils Revenue (undefined) Forecast, by Application 2020 & 2033
- Table 26: Nordics Aromatic Rubber Process Oils Revenue (undefined) Forecast, by Application 2020 & 2033
- Table 27: Rest of Europe Aromatic Rubber Process Oils Revenue (undefined) Forecast, by Application 2020 & 2033
- Table 28: Global Aromatic Rubber Process Oils Revenue undefined Forecast, by Application 2020 & 2033
- Table 29: Global Aromatic Rubber Process Oils Revenue undefined Forecast, by Types 2020 & 2033
- Table 30: Global Aromatic Rubber Process Oils Revenue undefined Forecast, by Country 2020 & 2033
- Table 31: Turkey Aromatic Rubber Process Oils Revenue (undefined) Forecast, by Application 2020 & 2033
- Table 32: Israel Aromatic Rubber Process Oils Revenue (undefined) Forecast, by Application 2020 & 2033
- Table 33: GCC Aromatic Rubber Process Oils Revenue (undefined) Forecast, by Application 2020 & 2033
- Table 34: North Africa Aromatic Rubber Process Oils Revenue (undefined) Forecast, by Application 2020 & 2033
- Table 35: South Africa Aromatic Rubber Process Oils Revenue (undefined) Forecast, by Application 2020 & 2033
- Table 36: Rest of Middle East & Africa Aromatic Rubber Process Oils Revenue (undefined) Forecast, by Application 2020 & 2033
- Table 37: Global Aromatic Rubber Process Oils Revenue undefined Forecast, by Application 2020 & 2033
- Table 38: Global Aromatic Rubber Process Oils Revenue undefined Forecast, by Types 2020 & 2033
- Table 39: Global Aromatic Rubber Process Oils Revenue undefined Forecast, by Country 2020 & 2033
- Table 40: China Aromatic Rubber Process Oils Revenue (undefined) Forecast, by Application 2020 & 2033
- Table 41: India Aromatic Rubber Process Oils Revenue (undefined) Forecast, by Application 2020 & 2033
- Table 42: Japan Aromatic Rubber Process Oils Revenue (undefined) Forecast, by Application 2020 & 2033
- Table 43: South Korea Aromatic Rubber Process Oils Revenue (undefined) Forecast, by Application 2020 & 2033
- Table 44: ASEAN Aromatic Rubber Process Oils Revenue (undefined) Forecast, by Application 2020 & 2033
- Table 45: Oceania Aromatic Rubber Process Oils Revenue (undefined) Forecast, by Application 2020 & 2033
- Table 46: Rest of Asia Pacific Aromatic Rubber Process Oils Revenue (undefined) Forecast, by Application 2020 & 2033
Frequently Asked Questions
1. What is the projected Compound Annual Growth Rate (CAGR) of the Aromatic Rubber Process Oils?
The projected CAGR is approximately 2.93%.
2. Which companies are prominent players in the Aromatic Rubber Process Oils?
Key companies in the market include H&R Group, Orgkhim Biochemical Holdings, Total, Repsol, CPC Corporation, IRPC, Shell, Nynas, Apar Industries, Panama Petrochem, Hollyfrontier Refining & Marketing, ORLEN Unipetrol, Behran Oil Company, Indian Oil Corporation, Hindustan Petroleum Corporation, Idemitsu Kosan, Eagle Petrochem, Lodha Petro, Southwestern Petroleum Corporation, Cross Oil, CNOOC, Shandong Tianyuan Chemical Co. Ltd, Suzhou Jiutai Group.
3. What are the main segments of the Aromatic Rubber Process Oils?
The market segments include Application, Types.
4. Can you provide details about the market size?
The market size is estimated to be USD XXX N/A as of 2022.
5. What are some drivers contributing to market growth?
N/A
6. What are the notable trends driving market growth?
N/A
7. Are there any restraints impacting market growth?
N/A
8. Can you provide examples of recent developments in the market?
N/A
9. What pricing options are available for accessing the report?
Pricing options include single-user, multi-user, and enterprise licenses priced at USD 4900.00, USD 7350.00, and USD 9800.00 respectively.
10. Is the market size provided in terms of value or volume?
The market size is provided in terms of value, measured in N/A.
11. Are there any specific market keywords associated with the report?
Yes, the market keyword associated with the report is "Aromatic Rubber Process Oils," which aids in identifying and referencing the specific market segment covered.
12. How do I determine which pricing option suits my needs best?
The pricing options vary based on user requirements and access needs. Individual users may opt for single-user licenses, while businesses requiring broader access may choose multi-user or enterprise licenses for cost-effective access to the report.
13. Are there any additional resources or data provided in the Aromatic Rubber Process Oils report?
While the report offers comprehensive insights, it's advisable to review the specific contents or supplementary materials provided to ascertain if additional resources or data are available.
14. How can I stay updated on further developments or reports in the Aromatic Rubber Process Oils?
To stay informed about further developments, trends, and reports in the Aromatic Rubber Process Oils, consider subscribing to industry newsletters, following relevant companies and organizations, or regularly checking reputable industry news sources and publications.
Methodology
Step 1 - Identification of Relevant Samples Size from Population Database


Step 2 - Approaches for Defining Global Market Size (Value, Volume* & Price*)

Note*: In applicable scenarios
Step 3 - Data Sources
Primary Research
- Web Analytics
- Survey Reports
- Research Institute
- Latest Research Reports
- Opinion Leaders
Secondary Research
- Annual Reports
- White Paper
- Latest Press Release
- Industry Association
- Paid Database
- Investor Presentations

Step 4 - Data Triangulation
Involves using different sources of information in order to increase the validity of a study
These sources are likely to be stakeholders in a program - participants, other researchers, program staff, other community members, and so on.
Then we put all data in single framework & apply various statistical tools to find out the dynamic on the market.
During the analysis stage, feedback from the stakeholder groups would be compared to determine areas of agreement as well as areas of divergence