
Key Insights
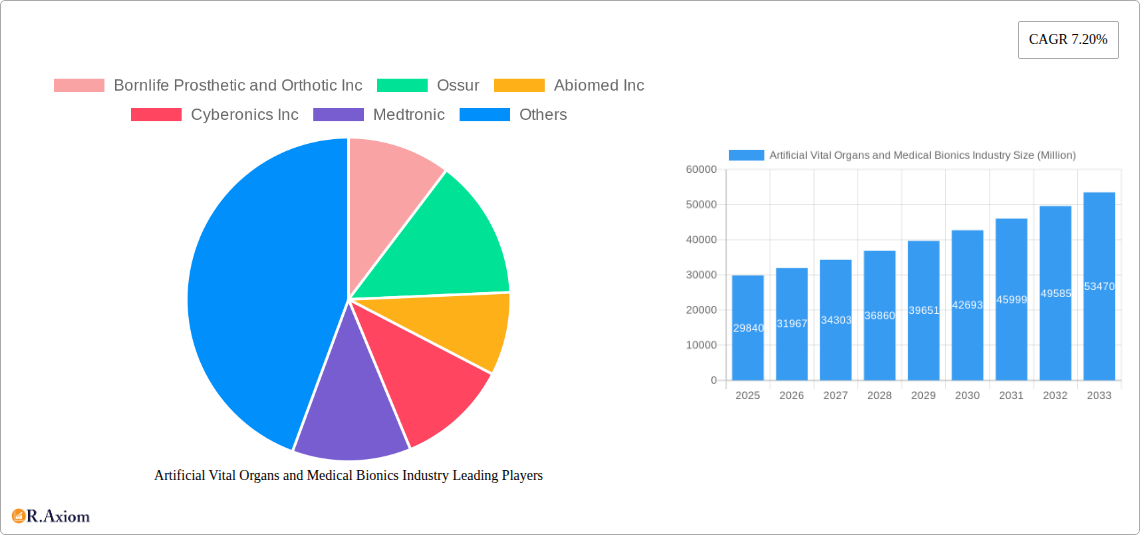
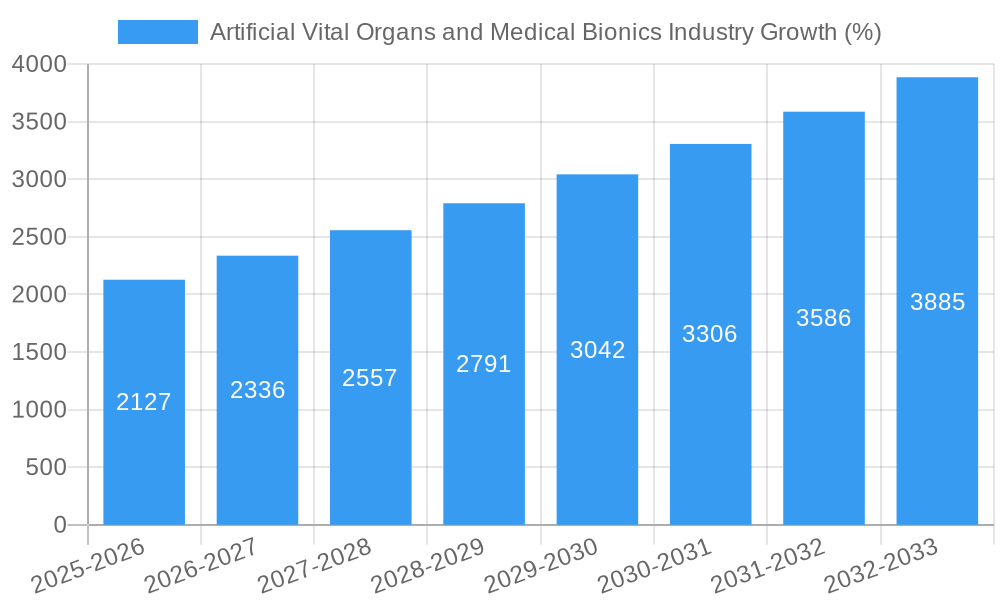
The global artificial vital organs and medical bionics market is experiencing robust growth, projected to reach \$29.84 billion in 2025 and maintain a Compound Annual Growth Rate (CAGR) of 7.20% from 2025 to 2033. This expansion is driven by several key factors. Increasing prevalence of chronic diseases like heart failure, kidney disease, and diabetes necessitates the development and adoption of artificial organs, fueling market demand. Technological advancements in materials science, miniaturization, and biocompatibility are enabling the creation of more effective and less invasive devices. Furthermore, rising geriatric populations globally are increasing the need for assistive technologies like bionic limbs and exoskeletons, further boosting market growth. Government initiatives promoting healthcare infrastructure and supporting research and development in this sector also play a significant role. While high costs associated with these technologies and potential regulatory hurdles pose challenges, the overall market outlook remains positive, with significant growth expected across all segments.
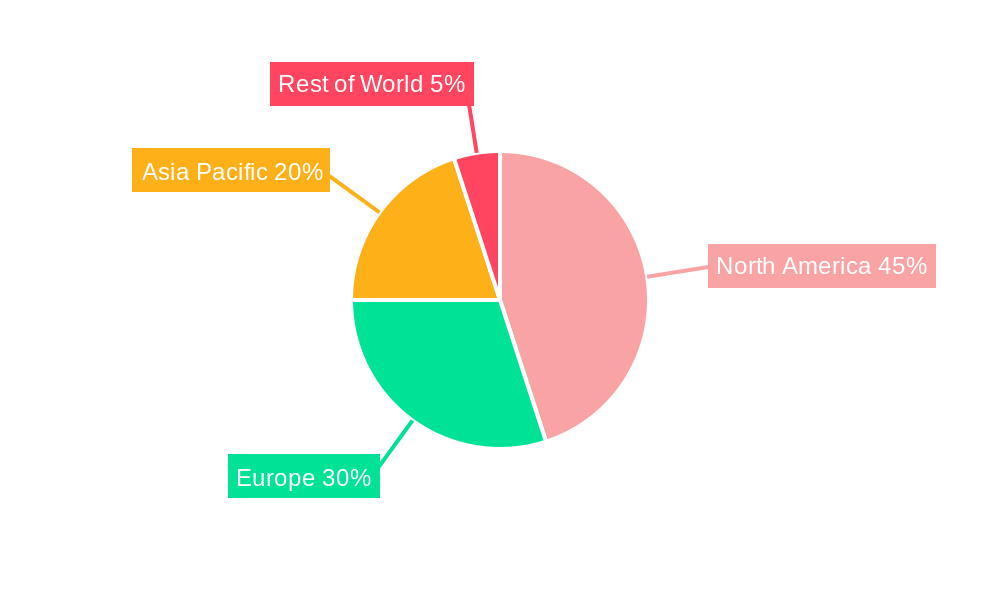
The market segmentation reveals strong growth across artificial organs (artificial heart, kidney, liver, pancreas, lungs) and bionics (ear, vision, exoskeletons, limbs, brain, cardiac). North America currently holds a significant market share due to advanced healthcare infrastructure and high adoption rates. However, Asia-Pacific is expected to witness significant growth in the coming years driven by rising disposable incomes and increasing awareness of these technologies. Europe also maintains a substantial market presence, with ongoing research and development activities contributing to market growth. The competitive landscape is characterized by a mix of established players like Medtronic, Boston Scientific, and Ossur, along with emerging companies focusing on innovative solutions. Strategic partnerships, mergers, and acquisitions are anticipated to shape the market dynamics in the coming years, driving innovation and market consolidation.
Artificial Vital Organs and Medical Bionics Industry: A Comprehensive Market Report (2019-2033)
This in-depth report provides a comprehensive analysis of the Artificial Vital Organs and Medical Bionics industry, encompassing market size, segmentation, growth drivers, challenges, and future opportunities. The study period covers 2019-2033, with 2025 as the base and estimated year, and a forecast period of 2025-2033. The report offers actionable insights for industry stakeholders, investors, and researchers, leveraging extensive data analysis and expert perspectives.
Artificial Vital Organs and Medical Bionics Industry Market Concentration & Innovation
The Artificial Vital Organs and Medical Bionics industry exhibits a moderately concentrated market structure, with a few major players holding significant market share. While precise market share figures for each company are proprietary information, companies like Medtronic, Abiomed Inc, and Boston Scientific Corporation hold substantial positions, driven by their extensive product portfolios and strong R&D capabilities. The industry is characterized by high innovation, fueled by continuous advancements in materials science, bioengineering, and miniaturization technologies. Regulatory frameworks, particularly those concerning safety and efficacy, play a critical role in shaping market dynamics. Product substitutes, such as traditional therapies and alternative treatment approaches, exert competitive pressure. End-user trends, primarily driven by an aging global population and rising prevalence of chronic diseases, are strongly propelling market growth. M&A activities have been relatively frequent, with deal values reaching xx Million in recent years, further consolidating the industry landscape.
- Key Metrics: Market share (proprietary data for individual companies); M&A deal values (xx Million annually)
- Innovation Drivers: Advancements in biomaterials, miniaturization, AI & Machine Learning integration, 3D printing, nanotechnology.
- Regulatory Landscape: Stringent regulatory approvals (e.g., FDA), impacting time-to-market and development costs.
- End-user Trends: Aging population, increasing prevalence of chronic diseases, rising demand for minimally invasive procedures, and improved patient outcomes.
- M&A Activities: Consolidation through strategic acquisitions driving market concentration.
Artificial Vital Organs and Medical Bionics Industry Industry Trends & Insights
The Artificial Vital Organs and Medical Bionics market is experiencing robust growth, driven by several factors. Technological advancements are significantly impacting the industry, with the introduction of sophisticated biocompatible materials, advanced sensor technologies, and improved control systems driving the development of more effective and durable devices. The market is characterized by high R&D expenditure among leading companies, contributing to a projected CAGR of xx% during the forecast period (2025-2033). Consumer preferences are shifting towards minimally invasive procedures, personalized medicine, and improved quality of life, thereby increasing the adoption of advanced bionic and artificial organ technologies. Competitive dynamics are intense, with leading companies vying for market share through product innovation, strategic partnerships, and aggressive marketing campaigns. Market penetration for specific segments, such as artificial heart devices, is estimated at xx% in 2025 and projected to increase to xx% by 2033.
Dominant Markets & Segments in Artificial Vital Organs and Medical Bionics Industry
The North American region dominates the Artificial Vital Organs and Medical Bionics market, owing to a combination of factors. The high prevalence of chronic diseases, advanced healthcare infrastructure, and strong regulatory support within this region fosters a significant demand for these technologies. Within the segments, Artificial Hearts and Bionic Limbs currently represent the largest market share, driven by significant technological advancements and growing patient populations.
Key Drivers for North American Dominance:
- High healthcare expenditure
- Strong regulatory support (e.g., FDA) for new technologies
- Well-established healthcare infrastructure
- High prevalence of chronic diseases.
Segment Dominance Analysis:
- Artificial Hearts: Technological advancements in biocompatible materials and miniaturization are propelling growth.
- Bionic Limbs: Rising demand fueled by improved functionality, enhanced aesthetics, and broader accessibility.
- Other Segments: Artificial kidneys, livers, and pancreas, along with other bionic segments, are experiencing steady growth.
Artificial Vital Organs and Medical Bionics Industry Product Developments
Recent product innovations in the Artificial Vital Organs and Medical Bionics space include the development of biocompatible materials, improving device longevity and reducing rejection rates. Miniaturization of devices improves patient comfort and functionality. Artificial intelligence (AI) and machine learning are being integrated for improved device control, personalized therapy and predictive maintenance. These advancements are enhancing the market fit of these technologies, expanding applications and attracting a wider range of patients.
Report Scope & Segmentation Analysis
This report segments the Artificial Vital Organs and Medical Bionics market by Type (Artificial Organ, Bionics) and further sub-segments Artificial Organs (Artificial Heart, Artificial Kidney, Artificial Liver, Artificial Pancreas, Artificial Lungs, Others) and Bionics (Ear Bionics, Vision Bionics, Exoskeletons, Bionic Limbs, Brain Bionics, Cardiac Bionics, Others). Each segment's growth projections, market sizes (in Millions), and competitive dynamics are analyzed in detail within the report. For example, the Artificial Heart segment is expected to witness significant growth due to technological advancements, while the Exoskeleton segment shows strong potential within the rehabilitation market. Market sizes and growth projections are detailed for each sub-segment within the report.
Key Drivers of Artificial Vital Organs and Medical Bionics Industry Growth
Several factors contribute to the growth of the Artificial Vital Organs and Medical Bionics industry. Technological advancements in materials science, miniaturization, and sensor technology are leading to improved device performance and patient outcomes. Increased government funding for R&D, as exemplified by the USD 10.5 Million Kidney Innovation Accelerator prize, drives innovation. The rising prevalence of chronic diseases and an aging global population create a large and growing patient pool. Favorable regulatory environments that encourage the development and adoption of these technologies further contribute to market expansion.
Challenges in the Artificial Vital Organs and Medical Bionics Industry Sector
Significant challenges hinder the growth of this industry. High research and development costs are a major barrier, impacting the time-to-market and profitability for new devices. Stringent regulatory requirements for approval and safety considerations increase the complexity and cost of bringing products to market. Supply chain complexities and dependence on specialized materials can impact production and availability. High treatment costs and limited insurance coverage limit patient access in certain regions, thus hindering wider market penetration.
Emerging Opportunities in Artificial Vital Organs and Medical Bionics Industry
Emerging opportunities abound in this sector. The development of bio-integrated devices, utilizing bioprinting technologies and regenerative medicine, offers great potential. The integration of artificial intelligence and machine learning for personalized therapy and remote monitoring will redefine the patient care model. Expansion into emerging markets with growing healthcare needs presents substantial growth potential. Personalized medicine will provide custom-designed devices to better suit individual patient needs.
Leading Players in the Artificial Vital Organs and Medical Bionics Industry Market
- Bornlife Prosthetic and Orthotic Inc
- Ossur
- Abiomed Inc
- Cyberonics Inc
- Medtronic
- Baxter
- Asahi Kasei Medical Co Ltd
- Getinge AB
- Ekso Bionics Holdings Inc
- Boston Scientific Corporation
- Sonova
- Berlin Heart GmbH
Key Developments in Artificial Vital Organs and Medical Bionics Industry Industry
- August 2022: The American Society of Nephrology and the United States Department of Health and Human Services offered USD 10.5 Million for a new prize competition from the Kidney Innovation Accelerator. Phase 2 focuses on bioartificial kidney prototypes.
- January 2022: IIT-Kanpur launched a project to develop an advanced artificial heart in collaboration with Indian hospitals.
Strategic Outlook for Artificial Vital Organs and Medical Bionics Industry Market
The Artificial Vital Organs and Medical Bionics industry presents a compelling investment opportunity, driven by continuous technological innovation, and a growing patient pool. Future growth will be propelled by the increasing adoption of minimally invasive procedures, personalized medicine, the development of more biocompatible and durable devices, and expansion into new markets. Companies focusing on innovation and addressing the challenges of cost and accessibility will be best positioned to capitalize on future opportunities.
Artificial Vital Organs and Medical Bionics Industry Segmentation
-
1. Type
-
1.1. Artificial Organ
- 1.1.1. Artificial Heart
- 1.1.2. Artificial Kidney
- 1.1.3. Artificial Lungs
- 1.1.4. Cochlear Implants
- 1.1.5. Other Organ Types
-
1.2. Bionics
- 1.2.1. Vision Bionics
- 1.2.2. Ear Bionics
- 1.2.3. Orthopedic Bionic
- 1.2.4. Cardiac Bionics
-
1.1. Artificial Organ
Artificial Vital Organs and Medical Bionics Industry Segmentation By Geography
-
1. North America
- 1.1. United States
- 1.2. Canada
- 1.3. Mexico
-
2. Europe
- 2.1. Germany
- 2.2. United Kingdom
- 2.3. France
- 2.4. Italy
- 2.5. Spain
- 2.6. Rest of Europe
-
3. Asia Pacific
- 3.1. China
- 3.2. Japan
- 3.3. India
- 3.4. Australia
- 3.5. South Korea
- 3.6. Rest of Asia Pacific
-
4. Middle East and Africa
- 4.1. GCC
- 4.2. South Africa
- 4.3. Rest of Middle East and Africa
-
5. South America
- 5.1. Brazil
- 5.2. Argentina
- 5.3. Rest of South America
Artificial Vital Organs and Medical Bionics Industry REPORT HIGHLIGHTS
| Aspects | Details |
|---|---|
| Study Period | 2019-2033 |
| Base Year | 2024 |
| Estimated Year | 2025 |
| Forecast Period | 2025-2033 |
| Historical Period | 2019-2024 |
| Growth Rate | CAGR of 7.20% from 2019-2033 |
| Segmentation |
|
Table of Contents
- 1. Introduction
- 1.1. Research Scope
- 1.2. Market Segmentation
- 1.3. Research Methodology
- 1.4. Definitions and Assumptions
- 2. Executive Summary
- 2.1. Introduction
- 3. Market Dynamics
- 3.1. Introduction
- 3.2. Market Drivers
- 3.2.1. Increased Incidence of Disabilities and Organ Failures; High Incidence of Road Accidents Leading to Amputations; Scarcity of Donor Organs; Technological Advancements in the Artificial Organ and Bionics
- 3.3. Market Restrains
- 3.3.1. Expensive Procedures; Compatibility Issues and Malfunctions
- 3.4. Market Trends
- 3.4.1. Artificial Kidney by Artificial Organ Segment is anticipated to Grow Over the Forecast Period
- 4. Market Factor Analysis
- 4.1. Porters Five Forces
- 4.2. Supply/Value Chain
- 4.3. PESTEL analysis
- 4.4. Market Entropy
- 4.5. Patent/Trademark Analysis
- 5. Global Artificial Vital Organs and Medical Bionics Industry Analysis, Insights and Forecast, 2019-2031
- 5.1. Market Analysis, Insights and Forecast - by Type
- 5.1.1. Artificial Organ
- 5.1.1.1. Artificial Heart
- 5.1.1.2. Artificial Kidney
- 5.1.1.3. Artificial Lungs
- 5.1.1.4. Cochlear Implants
- 5.1.1.5. Other Organ Types
- 5.1.2. Bionics
- 5.1.2.1. Vision Bionics
- 5.1.2.2. Ear Bionics
- 5.1.2.3. Orthopedic Bionic
- 5.1.2.4. Cardiac Bionics
- 5.1.1. Artificial Organ
- 5.2. Market Analysis, Insights and Forecast - by Region
- 5.2.1. North America
- 5.2.2. Europe
- 5.2.3. Asia Pacific
- 5.2.4. Middle East and Africa
- 5.2.5. South America
- 5.1. Market Analysis, Insights and Forecast - by Type
- 6. North America Artificial Vital Organs and Medical Bionics Industry Analysis, Insights and Forecast, 2019-2031
- 6.1. Market Analysis, Insights and Forecast - by Type
- 6.1.1. Artificial Organ
- 6.1.1.1. Artificial Heart
- 6.1.1.2. Artificial Kidney
- 6.1.1.3. Artificial Lungs
- 6.1.1.4. Cochlear Implants
- 6.1.1.5. Other Organ Types
- 6.1.2. Bionics
- 6.1.2.1. Vision Bionics
- 6.1.2.2. Ear Bionics
- 6.1.2.3. Orthopedic Bionic
- 6.1.2.4. Cardiac Bionics
- 6.1.1. Artificial Organ
- 6.1. Market Analysis, Insights and Forecast - by Type
- 7. Europe Artificial Vital Organs and Medical Bionics Industry Analysis, Insights and Forecast, 2019-2031
- 7.1. Market Analysis, Insights and Forecast - by Type
- 7.1.1. Artificial Organ
- 7.1.1.1. Artificial Heart
- 7.1.1.2. Artificial Kidney
- 7.1.1.3. Artificial Lungs
- 7.1.1.4. Cochlear Implants
- 7.1.1.5. Other Organ Types
- 7.1.2. Bionics
- 7.1.2.1. Vision Bionics
- 7.1.2.2. Ear Bionics
- 7.1.2.3. Orthopedic Bionic
- 7.1.2.4. Cardiac Bionics
- 7.1.1. Artificial Organ
- 7.1. Market Analysis, Insights and Forecast - by Type
- 8. Asia Pacific Artificial Vital Organs and Medical Bionics Industry Analysis, Insights and Forecast, 2019-2031
- 8.1. Market Analysis, Insights and Forecast - by Type
- 8.1.1. Artificial Organ
- 8.1.1.1. Artificial Heart
- 8.1.1.2. Artificial Kidney
- 8.1.1.3. Artificial Lungs
- 8.1.1.4. Cochlear Implants
- 8.1.1.5. Other Organ Types
- 8.1.2. Bionics
- 8.1.2.1. Vision Bionics
- 8.1.2.2. Ear Bionics
- 8.1.2.3. Orthopedic Bionic
- 8.1.2.4. Cardiac Bionics
- 8.1.1. Artificial Organ
- 8.1. Market Analysis, Insights and Forecast - by Type
- 9. Middle East and Africa Artificial Vital Organs and Medical Bionics Industry Analysis, Insights and Forecast, 2019-2031
- 9.1. Market Analysis, Insights and Forecast - by Type
- 9.1.1. Artificial Organ
- 9.1.1.1. Artificial Heart
- 9.1.1.2. Artificial Kidney
- 9.1.1.3. Artificial Lungs
- 9.1.1.4. Cochlear Implants
- 9.1.1.5. Other Organ Types
- 9.1.2. Bionics
- 9.1.2.1. Vision Bionics
- 9.1.2.2. Ear Bionics
- 9.1.2.3. Orthopedic Bionic
- 9.1.2.4. Cardiac Bionics
- 9.1.1. Artificial Organ
- 9.1. Market Analysis, Insights and Forecast - by Type
- 10. South America Artificial Vital Organs and Medical Bionics Industry Analysis, Insights and Forecast, 2019-2031
- 10.1. Market Analysis, Insights and Forecast - by Type
- 10.1.1. Artificial Organ
- 10.1.1.1. Artificial Heart
- 10.1.1.2. Artificial Kidney
- 10.1.1.3. Artificial Lungs
- 10.1.1.4. Cochlear Implants
- 10.1.1.5. Other Organ Types
- 10.1.2. Bionics
- 10.1.2.1. Vision Bionics
- 10.1.2.2. Ear Bionics
- 10.1.2.3. Orthopedic Bionic
- 10.1.2.4. Cardiac Bionics
- 10.1.1. Artificial Organ
- 10.1. Market Analysis, Insights and Forecast - by Type
- 11. North America Artificial Vital Organs and Medical Bionics Industry Analysis, Insights and Forecast, 2019-2031
- 11.1. Market Analysis, Insights and Forecast - By Country/Sub-region
- 11.1.1 United States
- 11.1.2 Canada
- 11.1.3 Mexico
- 12. Europe Artificial Vital Organs and Medical Bionics Industry Analysis, Insights and Forecast, 2019-2031
- 12.1. Market Analysis, Insights and Forecast - By Country/Sub-region
- 12.1.1 Germany
- 12.1.2 United Kingdom
- 12.1.3 France
- 12.1.4 Italy
- 12.1.5 Spain
- 12.1.6 Rest of Europe
- 13. Asia Pacific Artificial Vital Organs and Medical Bionics Industry Analysis, Insights and Forecast, 2019-2031
- 13.1. Market Analysis, Insights and Forecast - By Country/Sub-region
- 13.1.1 China
- 13.1.2 Japan
- 13.1.3 India
- 13.1.4 Australia
- 13.1.5 South Korea
- 13.1.6 Rest of Asia Pacific
- 14. Middle East and Africa Artificial Vital Organs and Medical Bionics Industry Analysis, Insights and Forecast, 2019-2031
- 14.1. Market Analysis, Insights and Forecast - By Country/Sub-region
- 14.1.1 GCC
- 14.1.2 South Africa
- 14.1.3 Rest of Middle East and Africa
- 15. South America Artificial Vital Organs and Medical Bionics Industry Analysis, Insights and Forecast, 2019-2031
- 15.1. Market Analysis, Insights and Forecast - By Country/Sub-region
- 15.1.1 Brazil
- 15.1.2 Argentina
- 15.1.3 Rest of South America
- 16. Competitive Analysis
- 16.1. Global Market Share Analysis 2024
- 16.2. Company Profiles
- 16.2.1 Bornlife Prosthetic and Orthotic Inc
- 16.2.1.1. Overview
- 16.2.1.2. Products
- 16.2.1.3. SWOT Analysis
- 16.2.1.4. Recent Developments
- 16.2.1.5. Financials (Based on Availability)
- 16.2.2 Ossur
- 16.2.2.1. Overview
- 16.2.2.2. Products
- 16.2.2.3. SWOT Analysis
- 16.2.2.4. Recent Developments
- 16.2.2.5. Financials (Based on Availability)
- 16.2.3 Abiomed Inc
- 16.2.3.1. Overview
- 16.2.3.2. Products
- 16.2.3.3. SWOT Analysis
- 16.2.3.4. Recent Developments
- 16.2.3.5. Financials (Based on Availability)
- 16.2.4 Cyberonics Inc
- 16.2.4.1. Overview
- 16.2.4.2. Products
- 16.2.4.3. SWOT Analysis
- 16.2.4.4. Recent Developments
- 16.2.4.5. Financials (Based on Availability)
- 16.2.5 Medtronic
- 16.2.5.1. Overview
- 16.2.5.2. Products
- 16.2.5.3. SWOT Analysis
- 16.2.5.4. Recent Developments
- 16.2.5.5. Financials (Based on Availability)
- 16.2.6 Baxter
- 16.2.6.1. Overview
- 16.2.6.2. Products
- 16.2.6.3. SWOT Analysis
- 16.2.6.4. Recent Developments
- 16.2.6.5. Financials (Based on Availability)
- 16.2.7 Asahi Kasei Medical Co Ltd
- 16.2.7.1. Overview
- 16.2.7.2. Products
- 16.2.7.3. SWOT Analysis
- 16.2.7.4. Recent Developments
- 16.2.7.5. Financials (Based on Availability)
- 16.2.8 Getinge AB
- 16.2.8.1. Overview
- 16.2.8.2. Products
- 16.2.8.3. SWOT Analysis
- 16.2.8.4. Recent Developments
- 16.2.8.5. Financials (Based on Availability)
- 16.2.9 Ekso Bionics Holdings Inc
- 16.2.9.1. Overview
- 16.2.9.2. Products
- 16.2.9.3. SWOT Analysis
- 16.2.9.4. Recent Developments
- 16.2.9.5. Financials (Based on Availability)
- 16.2.10 Boston Scientific Corporation
- 16.2.10.1. Overview
- 16.2.10.2. Products
- 16.2.10.3. SWOT Analysis
- 16.2.10.4. Recent Developments
- 16.2.10.5. Financials (Based on Availability)
- 16.2.11 Sonova*List Not Exhaustive
- 16.2.11.1. Overview
- 16.2.11.2. Products
- 16.2.11.3. SWOT Analysis
- 16.2.11.4. Recent Developments
- 16.2.11.5. Financials (Based on Availability)
- 16.2.12 Berlin Heart GmbH
- 16.2.12.1. Overview
- 16.2.12.2. Products
- 16.2.12.3. SWOT Analysis
- 16.2.12.4. Recent Developments
- 16.2.12.5. Financials (Based on Availability)
- 16.2.1 Bornlife Prosthetic and Orthotic Inc
List of Figures
- Figure 1: Global Artificial Vital Organs and Medical Bionics Industry Revenue Breakdown (Million, %) by Region 2024 & 2032
- Figure 2: Global Artificial Vital Organs and Medical Bionics Industry Volume Breakdown (Piece, %) by Region 2024 & 2032
- Figure 3: North America Artificial Vital Organs and Medical Bionics Industry Revenue (Million), by Country 2024 & 2032
- Figure 4: North America Artificial Vital Organs and Medical Bionics Industry Volume (Piece), by Country 2024 & 2032
- Figure 5: North America Artificial Vital Organs and Medical Bionics Industry Revenue Share (%), by Country 2024 & 2032
- Figure 6: North America Artificial Vital Organs and Medical Bionics Industry Volume Share (%), by Country 2024 & 2032
- Figure 7: Europe Artificial Vital Organs and Medical Bionics Industry Revenue (Million), by Country 2024 & 2032
- Figure 8: Europe Artificial Vital Organs and Medical Bionics Industry Volume (Piece), by Country 2024 & 2032
- Figure 9: Europe Artificial Vital Organs and Medical Bionics Industry Revenue Share (%), by Country 2024 & 2032
- Figure 10: Europe Artificial Vital Organs and Medical Bionics Industry Volume Share (%), by Country 2024 & 2032
- Figure 11: Asia Pacific Artificial Vital Organs and Medical Bionics Industry Revenue (Million), by Country 2024 & 2032
- Figure 12: Asia Pacific Artificial Vital Organs and Medical Bionics Industry Volume (Piece), by Country 2024 & 2032
- Figure 13: Asia Pacific Artificial Vital Organs and Medical Bionics Industry Revenue Share (%), by Country 2024 & 2032
- Figure 14: Asia Pacific Artificial Vital Organs and Medical Bionics Industry Volume Share (%), by Country 2024 & 2032
- Figure 15: Middle East and Africa Artificial Vital Organs and Medical Bionics Industry Revenue (Million), by Country 2024 & 2032
- Figure 16: Middle East and Africa Artificial Vital Organs and Medical Bionics Industry Volume (Piece), by Country 2024 & 2032
- Figure 17: Middle East and Africa Artificial Vital Organs and Medical Bionics Industry Revenue Share (%), by Country 2024 & 2032
- Figure 18: Middle East and Africa Artificial Vital Organs and Medical Bionics Industry Volume Share (%), by Country 2024 & 2032
- Figure 19: South America Artificial Vital Organs and Medical Bionics Industry Revenue (Million), by Country 2024 & 2032
- Figure 20: South America Artificial Vital Organs and Medical Bionics Industry Volume (Piece), by Country 2024 & 2032
- Figure 21: South America Artificial Vital Organs and Medical Bionics Industry Revenue Share (%), by Country 2024 & 2032
- Figure 22: South America Artificial Vital Organs and Medical Bionics Industry Volume Share (%), by Country 2024 & 2032
- Figure 23: North America Artificial Vital Organs and Medical Bionics Industry Revenue (Million), by Type 2024 & 2032
- Figure 24: North America Artificial Vital Organs and Medical Bionics Industry Volume (Piece), by Type 2024 & 2032
- Figure 25: North America Artificial Vital Organs and Medical Bionics Industry Revenue Share (%), by Type 2024 & 2032
- Figure 26: North America Artificial Vital Organs and Medical Bionics Industry Volume Share (%), by Type 2024 & 2032
- Figure 27: North America Artificial Vital Organs and Medical Bionics Industry Revenue (Million), by Country 2024 & 2032
- Figure 28: North America Artificial Vital Organs and Medical Bionics Industry Volume (Piece), by Country 2024 & 2032
- Figure 29: North America Artificial Vital Organs and Medical Bionics Industry Revenue Share (%), by Country 2024 & 2032
- Figure 30: North America Artificial Vital Organs and Medical Bionics Industry Volume Share (%), by Country 2024 & 2032
- Figure 31: Europe Artificial Vital Organs and Medical Bionics Industry Revenue (Million), by Type 2024 & 2032
- Figure 32: Europe Artificial Vital Organs and Medical Bionics Industry Volume (Piece), by Type 2024 & 2032
- Figure 33: Europe Artificial Vital Organs and Medical Bionics Industry Revenue Share (%), by Type 2024 & 2032
- Figure 34: Europe Artificial Vital Organs and Medical Bionics Industry Volume Share (%), by Type 2024 & 2032
- Figure 35: Europe Artificial Vital Organs and Medical Bionics Industry Revenue (Million), by Country 2024 & 2032
- Figure 36: Europe Artificial Vital Organs and Medical Bionics Industry Volume (Piece), by Country 2024 & 2032
- Figure 37: Europe Artificial Vital Organs and Medical Bionics Industry Revenue Share (%), by Country 2024 & 2032
- Figure 38: Europe Artificial Vital Organs and Medical Bionics Industry Volume Share (%), by Country 2024 & 2032
- Figure 39: Asia Pacific Artificial Vital Organs and Medical Bionics Industry Revenue (Million), by Type 2024 & 2032
- Figure 40: Asia Pacific Artificial Vital Organs and Medical Bionics Industry Volume (Piece), by Type 2024 & 2032
- Figure 41: Asia Pacific Artificial Vital Organs and Medical Bionics Industry Revenue Share (%), by Type 2024 & 2032
- Figure 42: Asia Pacific Artificial Vital Organs and Medical Bionics Industry Volume Share (%), by Type 2024 & 2032
- Figure 43: Asia Pacific Artificial Vital Organs and Medical Bionics Industry Revenue (Million), by Country 2024 & 2032
- Figure 44: Asia Pacific Artificial Vital Organs and Medical Bionics Industry Volume (Piece), by Country 2024 & 2032
- Figure 45: Asia Pacific Artificial Vital Organs and Medical Bionics Industry Revenue Share (%), by Country 2024 & 2032
- Figure 46: Asia Pacific Artificial Vital Organs and Medical Bionics Industry Volume Share (%), by Country 2024 & 2032
- Figure 47: Middle East and Africa Artificial Vital Organs and Medical Bionics Industry Revenue (Million), by Type 2024 & 2032
- Figure 48: Middle East and Africa Artificial Vital Organs and Medical Bionics Industry Volume (Piece), by Type 2024 & 2032
- Figure 49: Middle East and Africa Artificial Vital Organs and Medical Bionics Industry Revenue Share (%), by Type 2024 & 2032
- Figure 50: Middle East and Africa Artificial Vital Organs and Medical Bionics Industry Volume Share (%), by Type 2024 & 2032
- Figure 51: Middle East and Africa Artificial Vital Organs and Medical Bionics Industry Revenue (Million), by Country 2024 & 2032
- Figure 52: Middle East and Africa Artificial Vital Organs and Medical Bionics Industry Volume (Piece), by Country 2024 & 2032
- Figure 53: Middle East and Africa Artificial Vital Organs and Medical Bionics Industry Revenue Share (%), by Country 2024 & 2032
- Figure 54: Middle East and Africa Artificial Vital Organs and Medical Bionics Industry Volume Share (%), by Country 2024 & 2032
- Figure 55: South America Artificial Vital Organs and Medical Bionics Industry Revenue (Million), by Type 2024 & 2032
- Figure 56: South America Artificial Vital Organs and Medical Bionics Industry Volume (Piece), by Type 2024 & 2032
- Figure 57: South America Artificial Vital Organs and Medical Bionics Industry Revenue Share (%), by Type 2024 & 2032
- Figure 58: South America Artificial Vital Organs and Medical Bionics Industry Volume Share (%), by Type 2024 & 2032
- Figure 59: South America Artificial Vital Organs and Medical Bionics Industry Revenue (Million), by Country 2024 & 2032
- Figure 60: South America Artificial Vital Organs and Medical Bionics Industry Volume (Piece), by Country 2024 & 2032
- Figure 61: South America Artificial Vital Organs and Medical Bionics Industry Revenue Share (%), by Country 2024 & 2032
- Figure 62: South America Artificial Vital Organs and Medical Bionics Industry Volume Share (%), by Country 2024 & 2032
List of Tables
- Table 1: Global Artificial Vital Organs and Medical Bionics Industry Revenue Million Forecast, by Region 2019 & 2032
- Table 2: Global Artificial Vital Organs and Medical Bionics Industry Volume Piece Forecast, by Region 2019 & 2032
- Table 3: Global Artificial Vital Organs and Medical Bionics Industry Revenue Million Forecast, by Type 2019 & 2032
- Table 4: Global Artificial Vital Organs and Medical Bionics Industry Volume Piece Forecast, by Type 2019 & 2032
- Table 5: Global Artificial Vital Organs and Medical Bionics Industry Revenue Million Forecast, by Region 2019 & 2032
- Table 6: Global Artificial Vital Organs and Medical Bionics Industry Volume Piece Forecast, by Region 2019 & 2032
- Table 7: Global Artificial Vital Organs and Medical Bionics Industry Revenue Million Forecast, by Country 2019 & 2032
- Table 8: Global Artificial Vital Organs and Medical Bionics Industry Volume Piece Forecast, by Country 2019 & 2032
- Table 9: United States Artificial Vital Organs and Medical Bionics Industry Revenue (Million) Forecast, by Application 2019 & 2032
- Table 10: United States Artificial Vital Organs and Medical Bionics Industry Volume (Piece) Forecast, by Application 2019 & 2032
- Table 11: Canada Artificial Vital Organs and Medical Bionics Industry Revenue (Million) Forecast, by Application 2019 & 2032
- Table 12: Canada Artificial Vital Organs and Medical Bionics Industry Volume (Piece) Forecast, by Application 2019 & 2032
- Table 13: Mexico Artificial Vital Organs and Medical Bionics Industry Revenue (Million) Forecast, by Application 2019 & 2032
- Table 14: Mexico Artificial Vital Organs and Medical Bionics Industry Volume (Piece) Forecast, by Application 2019 & 2032
- Table 15: Global Artificial Vital Organs and Medical Bionics Industry Revenue Million Forecast, by Country 2019 & 2032
- Table 16: Global Artificial Vital Organs and Medical Bionics Industry Volume Piece Forecast, by Country 2019 & 2032
- Table 17: Germany Artificial Vital Organs and Medical Bionics Industry Revenue (Million) Forecast, by Application 2019 & 2032
- Table 18: Germany Artificial Vital Organs and Medical Bionics Industry Volume (Piece) Forecast, by Application 2019 & 2032
- Table 19: United Kingdom Artificial Vital Organs and Medical Bionics Industry Revenue (Million) Forecast, by Application 2019 & 2032
- Table 20: United Kingdom Artificial Vital Organs and Medical Bionics Industry Volume (Piece) Forecast, by Application 2019 & 2032
- Table 21: France Artificial Vital Organs and Medical Bionics Industry Revenue (Million) Forecast, by Application 2019 & 2032
- Table 22: France Artificial Vital Organs and Medical Bionics Industry Volume (Piece) Forecast, by Application 2019 & 2032
- Table 23: Italy Artificial Vital Organs and Medical Bionics Industry Revenue (Million) Forecast, by Application 2019 & 2032
- Table 24: Italy Artificial Vital Organs and Medical Bionics Industry Volume (Piece) Forecast, by Application 2019 & 2032
- Table 25: Spain Artificial Vital Organs and Medical Bionics Industry Revenue (Million) Forecast, by Application 2019 & 2032
- Table 26: Spain Artificial Vital Organs and Medical Bionics Industry Volume (Piece) Forecast, by Application 2019 & 2032
- Table 27: Rest of Europe Artificial Vital Organs and Medical Bionics Industry Revenue (Million) Forecast, by Application 2019 & 2032
- Table 28: Rest of Europe Artificial Vital Organs and Medical Bionics Industry Volume (Piece) Forecast, by Application 2019 & 2032
- Table 29: Global Artificial Vital Organs and Medical Bionics Industry Revenue Million Forecast, by Country 2019 & 2032
- Table 30: Global Artificial Vital Organs and Medical Bionics Industry Volume Piece Forecast, by Country 2019 & 2032
- Table 31: China Artificial Vital Organs and Medical Bionics Industry Revenue (Million) Forecast, by Application 2019 & 2032
- Table 32: China Artificial Vital Organs and Medical Bionics Industry Volume (Piece) Forecast, by Application 2019 & 2032
- Table 33: Japan Artificial Vital Organs and Medical Bionics Industry Revenue (Million) Forecast, by Application 2019 & 2032
- Table 34: Japan Artificial Vital Organs and Medical Bionics Industry Volume (Piece) Forecast, by Application 2019 & 2032
- Table 35: India Artificial Vital Organs and Medical Bionics Industry Revenue (Million) Forecast, by Application 2019 & 2032
- Table 36: India Artificial Vital Organs and Medical Bionics Industry Volume (Piece) Forecast, by Application 2019 & 2032
- Table 37: Australia Artificial Vital Organs and Medical Bionics Industry Revenue (Million) Forecast, by Application 2019 & 2032
- Table 38: Australia Artificial Vital Organs and Medical Bionics Industry Volume (Piece) Forecast, by Application 2019 & 2032
- Table 39: South Korea Artificial Vital Organs and Medical Bionics Industry Revenue (Million) Forecast, by Application 2019 & 2032
- Table 40: South Korea Artificial Vital Organs and Medical Bionics Industry Volume (Piece) Forecast, by Application 2019 & 2032
- Table 41: Rest of Asia Pacific Artificial Vital Organs and Medical Bionics Industry Revenue (Million) Forecast, by Application 2019 & 2032
- Table 42: Rest of Asia Pacific Artificial Vital Organs and Medical Bionics Industry Volume (Piece) Forecast, by Application 2019 & 2032
- Table 43: Global Artificial Vital Organs and Medical Bionics Industry Revenue Million Forecast, by Country 2019 & 2032
- Table 44: Global Artificial Vital Organs and Medical Bionics Industry Volume Piece Forecast, by Country 2019 & 2032
- Table 45: GCC Artificial Vital Organs and Medical Bionics Industry Revenue (Million) Forecast, by Application 2019 & 2032
- Table 46: GCC Artificial Vital Organs and Medical Bionics Industry Volume (Piece) Forecast, by Application 2019 & 2032
- Table 47: South Africa Artificial Vital Organs and Medical Bionics Industry Revenue (Million) Forecast, by Application 2019 & 2032
- Table 48: South Africa Artificial Vital Organs and Medical Bionics Industry Volume (Piece) Forecast, by Application 2019 & 2032
- Table 49: Rest of Middle East and Africa Artificial Vital Organs and Medical Bionics Industry Revenue (Million) Forecast, by Application 2019 & 2032
- Table 50: Rest of Middle East and Africa Artificial Vital Organs and Medical Bionics Industry Volume (Piece) Forecast, by Application 2019 & 2032
- Table 51: Global Artificial Vital Organs and Medical Bionics Industry Revenue Million Forecast, by Country 2019 & 2032
- Table 52: Global Artificial Vital Organs and Medical Bionics Industry Volume Piece Forecast, by Country 2019 & 2032
- Table 53: Brazil Artificial Vital Organs and Medical Bionics Industry Revenue (Million) Forecast, by Application 2019 & 2032
- Table 54: Brazil Artificial Vital Organs and Medical Bionics Industry Volume (Piece) Forecast, by Application 2019 & 2032
- Table 55: Argentina Artificial Vital Organs and Medical Bionics Industry Revenue (Million) Forecast, by Application 2019 & 2032
- Table 56: Argentina Artificial Vital Organs and Medical Bionics Industry Volume (Piece) Forecast, by Application 2019 & 2032
- Table 57: Rest of South America Artificial Vital Organs and Medical Bionics Industry Revenue (Million) Forecast, by Application 2019 & 2032
- Table 58: Rest of South America Artificial Vital Organs and Medical Bionics Industry Volume (Piece) Forecast, by Application 2019 & 2032
- Table 59: Global Artificial Vital Organs and Medical Bionics Industry Revenue Million Forecast, by Type 2019 & 2032
- Table 60: Global Artificial Vital Organs and Medical Bionics Industry Volume Piece Forecast, by Type 2019 & 2032
- Table 61: Global Artificial Vital Organs and Medical Bionics Industry Revenue Million Forecast, by Country 2019 & 2032
- Table 62: Global Artificial Vital Organs and Medical Bionics Industry Volume Piece Forecast, by Country 2019 & 2032
- Table 63: United States Artificial Vital Organs and Medical Bionics Industry Revenue (Million) Forecast, by Application 2019 & 2032
- Table 64: United States Artificial Vital Organs and Medical Bionics Industry Volume (Piece) Forecast, by Application 2019 & 2032
- Table 65: Canada Artificial Vital Organs and Medical Bionics Industry Revenue (Million) Forecast, by Application 2019 & 2032
- Table 66: Canada Artificial Vital Organs and Medical Bionics Industry Volume (Piece) Forecast, by Application 2019 & 2032
- Table 67: Mexico Artificial Vital Organs and Medical Bionics Industry Revenue (Million) Forecast, by Application 2019 & 2032
- Table 68: Mexico Artificial Vital Organs and Medical Bionics Industry Volume (Piece) Forecast, by Application 2019 & 2032
- Table 69: Global Artificial Vital Organs and Medical Bionics Industry Revenue Million Forecast, by Type 2019 & 2032
- Table 70: Global Artificial Vital Organs and Medical Bionics Industry Volume Piece Forecast, by Type 2019 & 2032
- Table 71: Global Artificial Vital Organs and Medical Bionics Industry Revenue Million Forecast, by Country 2019 & 2032
- Table 72: Global Artificial Vital Organs and Medical Bionics Industry Volume Piece Forecast, by Country 2019 & 2032
- Table 73: Germany Artificial Vital Organs and Medical Bionics Industry Revenue (Million) Forecast, by Application 2019 & 2032
- Table 74: Germany Artificial Vital Organs and Medical Bionics Industry Volume (Piece) Forecast, by Application 2019 & 2032
- Table 75: United Kingdom Artificial Vital Organs and Medical Bionics Industry Revenue (Million) Forecast, by Application 2019 & 2032
- Table 76: United Kingdom Artificial Vital Organs and Medical Bionics Industry Volume (Piece) Forecast, by Application 2019 & 2032
- Table 77: France Artificial Vital Organs and Medical Bionics Industry Revenue (Million) Forecast, by Application 2019 & 2032
- Table 78: France Artificial Vital Organs and Medical Bionics Industry Volume (Piece) Forecast, by Application 2019 & 2032
- Table 79: Italy Artificial Vital Organs and Medical Bionics Industry Revenue (Million) Forecast, by Application 2019 & 2032
- Table 80: Italy Artificial Vital Organs and Medical Bionics Industry Volume (Piece) Forecast, by Application 2019 & 2032
- Table 81: Spain Artificial Vital Organs and Medical Bionics Industry Revenue (Million) Forecast, by Application 2019 & 2032
- Table 82: Spain Artificial Vital Organs and Medical Bionics Industry Volume (Piece) Forecast, by Application 2019 & 2032
- Table 83: Rest of Europe Artificial Vital Organs and Medical Bionics Industry Revenue (Million) Forecast, by Application 2019 & 2032
- Table 84: Rest of Europe Artificial Vital Organs and Medical Bionics Industry Volume (Piece) Forecast, by Application 2019 & 2032
- Table 85: Global Artificial Vital Organs and Medical Bionics Industry Revenue Million Forecast, by Type 2019 & 2032
- Table 86: Global Artificial Vital Organs and Medical Bionics Industry Volume Piece Forecast, by Type 2019 & 2032
- Table 87: Global Artificial Vital Organs and Medical Bionics Industry Revenue Million Forecast, by Country 2019 & 2032
- Table 88: Global Artificial Vital Organs and Medical Bionics Industry Volume Piece Forecast, by Country 2019 & 2032
- Table 89: China Artificial Vital Organs and Medical Bionics Industry Revenue (Million) Forecast, by Application 2019 & 2032
- Table 90: China Artificial Vital Organs and Medical Bionics Industry Volume (Piece) Forecast, by Application 2019 & 2032
- Table 91: Japan Artificial Vital Organs and Medical Bionics Industry Revenue (Million) Forecast, by Application 2019 & 2032
- Table 92: Japan Artificial Vital Organs and Medical Bionics Industry Volume (Piece) Forecast, by Application 2019 & 2032
- Table 93: India Artificial Vital Organs and Medical Bionics Industry Revenue (Million) Forecast, by Application 2019 & 2032
- Table 94: India Artificial Vital Organs and Medical Bionics Industry Volume (Piece) Forecast, by Application 2019 & 2032
- Table 95: Australia Artificial Vital Organs and Medical Bionics Industry Revenue (Million) Forecast, by Application 2019 & 2032
- Table 96: Australia Artificial Vital Organs and Medical Bionics Industry Volume (Piece) Forecast, by Application 2019 & 2032
- Table 97: South Korea Artificial Vital Organs and Medical Bionics Industry Revenue (Million) Forecast, by Application 2019 & 2032
- Table 98: South Korea Artificial Vital Organs and Medical Bionics Industry Volume (Piece) Forecast, by Application 2019 & 2032
- Table 99: Rest of Asia Pacific Artificial Vital Organs and Medical Bionics Industry Revenue (Million) Forecast, by Application 2019 & 2032
- Table 100: Rest of Asia Pacific Artificial Vital Organs and Medical Bionics Industry Volume (Piece) Forecast, by Application 2019 & 2032
- Table 101: Global Artificial Vital Organs and Medical Bionics Industry Revenue Million Forecast, by Type 2019 & 2032
- Table 102: Global Artificial Vital Organs and Medical Bionics Industry Volume Piece Forecast, by Type 2019 & 2032
- Table 103: Global Artificial Vital Organs and Medical Bionics Industry Revenue Million Forecast, by Country 2019 & 2032
- Table 104: Global Artificial Vital Organs and Medical Bionics Industry Volume Piece Forecast, by Country 2019 & 2032
- Table 105: GCC Artificial Vital Organs and Medical Bionics Industry Revenue (Million) Forecast, by Application 2019 & 2032
- Table 106: GCC Artificial Vital Organs and Medical Bionics Industry Volume (Piece) Forecast, by Application 2019 & 2032
- Table 107: South Africa Artificial Vital Organs and Medical Bionics Industry Revenue (Million) Forecast, by Application 2019 & 2032
- Table 108: South Africa Artificial Vital Organs and Medical Bionics Industry Volume (Piece) Forecast, by Application 2019 & 2032
- Table 109: Rest of Middle East and Africa Artificial Vital Organs and Medical Bionics Industry Revenue (Million) Forecast, by Application 2019 & 2032
- Table 110: Rest of Middle East and Africa Artificial Vital Organs and Medical Bionics Industry Volume (Piece) Forecast, by Application 2019 & 2032
- Table 111: Global Artificial Vital Organs and Medical Bionics Industry Revenue Million Forecast, by Type 2019 & 2032
- Table 112: Global Artificial Vital Organs and Medical Bionics Industry Volume Piece Forecast, by Type 2019 & 2032
- Table 113: Global Artificial Vital Organs and Medical Bionics Industry Revenue Million Forecast, by Country 2019 & 2032
- Table 114: Global Artificial Vital Organs and Medical Bionics Industry Volume Piece Forecast, by Country 2019 & 2032
- Table 115: Brazil Artificial Vital Organs and Medical Bionics Industry Revenue (Million) Forecast, by Application 2019 & 2032
- Table 116: Brazil Artificial Vital Organs and Medical Bionics Industry Volume (Piece) Forecast, by Application 2019 & 2032
- Table 117: Argentina Artificial Vital Organs and Medical Bionics Industry Revenue (Million) Forecast, by Application 2019 & 2032
- Table 118: Argentina Artificial Vital Organs and Medical Bionics Industry Volume (Piece) Forecast, by Application 2019 & 2032
- Table 119: Rest of South America Artificial Vital Organs and Medical Bionics Industry Revenue (Million) Forecast, by Application 2019 & 2032
- Table 120: Rest of South America Artificial Vital Organs and Medical Bionics Industry Volume (Piece) Forecast, by Application 2019 & 2032
Frequently Asked Questions
1. What is the projected Compound Annual Growth Rate (CAGR) of the Artificial Vital Organs and Medical Bionics Industry?
The projected CAGR is approximately 7.20%.
2. Which companies are prominent players in the Artificial Vital Organs and Medical Bionics Industry?
Key companies in the market include Bornlife Prosthetic and Orthotic Inc, Ossur, Abiomed Inc, Cyberonics Inc, Medtronic, Baxter, Asahi Kasei Medical Co Ltd, Getinge AB, Ekso Bionics Holdings Inc, Boston Scientific Corporation, Sonova*List Not Exhaustive, Berlin Heart GmbH.
3. What are the main segments of the Artificial Vital Organs and Medical Bionics Industry?
The market segments include Type.
4. Can you provide details about the market size?
The market size is estimated to be USD 29.84 Million as of 2022.
5. What are some drivers contributing to market growth?
Increased Incidence of Disabilities and Organ Failures; High Incidence of Road Accidents Leading to Amputations; Scarcity of Donor Organs; Technological Advancements in the Artificial Organ and Bionics.
6. What are the notable trends driving market growth?
Artificial Kidney by Artificial Organ Segment is anticipated to Grow Over the Forecast Period.
7. Are there any restraints impacting market growth?
Expensive Procedures; Compatibility Issues and Malfunctions.
8. Can you provide examples of recent developments in the market?
In August 2022, the American Society of Nephrology and the United States Department of Health and Human Services offered USD 10.5 million for a new prize competition from the Kidney Innovation Accelerator. Phase 2 of the Artificial Kidney Prize competition is looking for suggestions for creating prototype bioartificial kidneys, as well as any novel equipment or parts that would make them possible.
9. What pricing options are available for accessing the report?
Pricing options include single-user, multi-user, and enterprise licenses priced at USD 4750, USD 5250, and USD 8750 respectively.
10. Is the market size provided in terms of value or volume?
The market size is provided in terms of value, measured in Million and volume, measured in Piece.
11. Are there any specific market keywords associated with the report?
Yes, the market keyword associated with the report is "Artificial Vital Organs and Medical Bionics Industry," which aids in identifying and referencing the specific market segment covered.
12. How do I determine which pricing option suits my needs best?
The pricing options vary based on user requirements and access needs. Individual users may opt for single-user licenses, while businesses requiring broader access may choose multi-user or enterprise licenses for cost-effective access to the report.
13. Are there any additional resources or data provided in the Artificial Vital Organs and Medical Bionics Industry report?
While the report offers comprehensive insights, it's advisable to review the specific contents or supplementary materials provided to ascertain if additional resources or data are available.
14. How can I stay updated on further developments or reports in the Artificial Vital Organs and Medical Bionics Industry?
To stay informed about further developments, trends, and reports in the Artificial Vital Organs and Medical Bionics Industry, consider subscribing to industry newsletters, following relevant companies and organizations, or regularly checking reputable industry news sources and publications.
Methodology
Step 1 - Identification of Relevant Samples Size from Population Database


Step 2 - Approaches for Defining Global Market Size (Value, Volume* & Price*)

Note*: In applicable scenarios
Step 3 - Data Sources
Primary Research
- Web Analytics
- Survey Reports
- Research Institute
- Latest Research Reports
- Opinion Leaders
Secondary Research
- Annual Reports
- White Paper
- Latest Press Release
- Industry Association
- Paid Database
- Investor Presentations

Step 4 - Data Triangulation
Involves using different sources of information in order to increase the validity of a study
These sources are likely to be stakeholders in a program - participants, other researchers, program staff, other community members, and so on.
Then we put all data in single framework & apply various statistical tools to find out the dynamic on the market.
During the analysis stage, feedback from the stakeholder groups would be compared to determine areas of agreement as well as areas of divergence


