
Key Insights
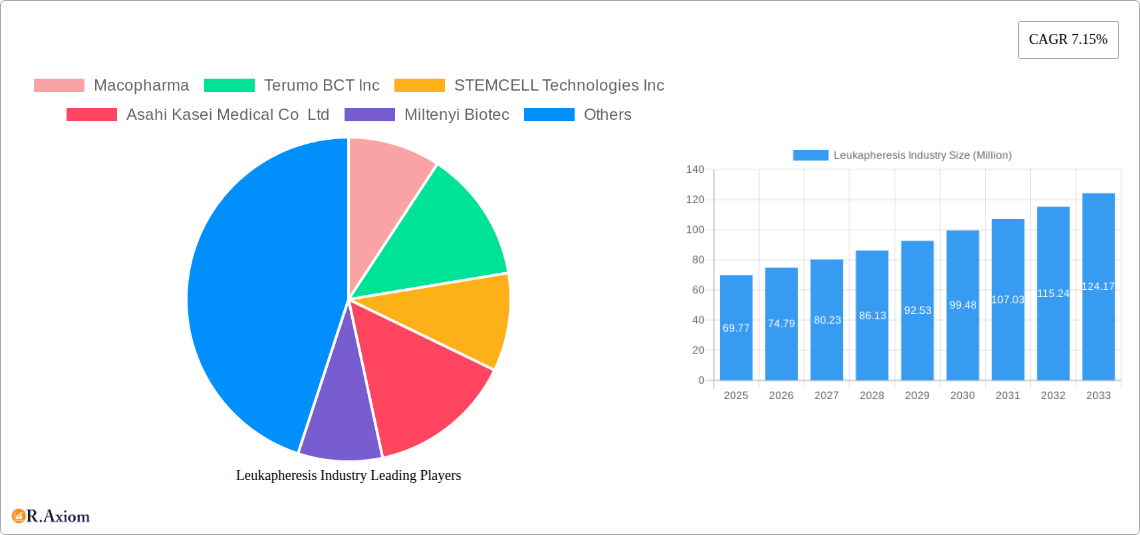
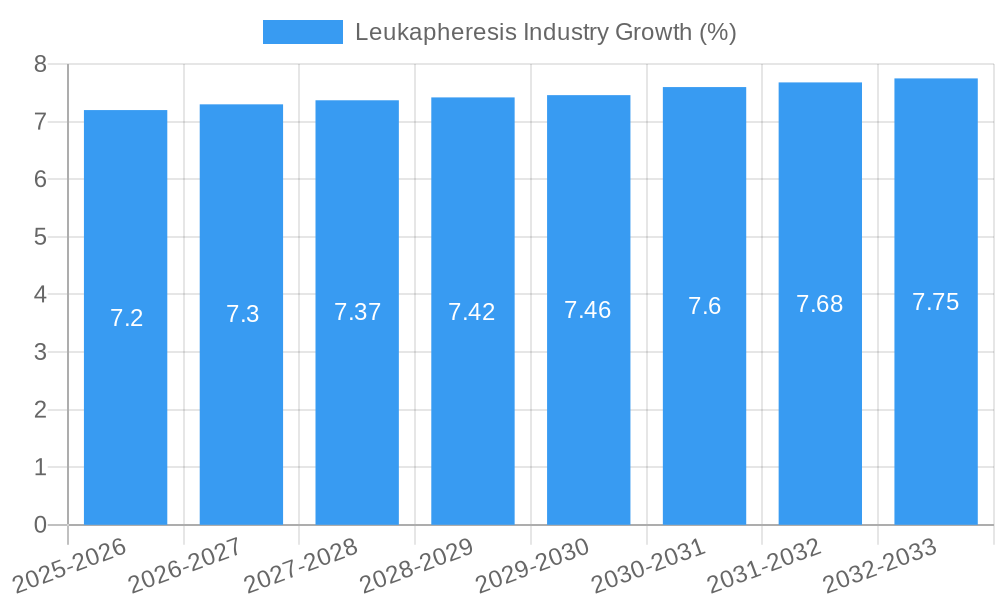
The global leukapheresis market, valued at $69.77 million in 2025, is projected to experience robust growth, driven by a Compound Annual Growth Rate (CAGR) of 7.15% from 2025 to 2033. This expansion is fueled by several key factors. The increasing prevalence of blood-related disorders requiring therapeutic apheresis, coupled with advancements in leukapheresis technologies offering improved efficiency and patient outcomes, are significant drivers. The growing adoption of leukapheresis in research applications, particularly in cell therapy and immunotherapy, further contributes to market growth. Expansion into emerging economies, fueled by rising healthcare expenditure and increasing awareness of advanced medical procedures, also presents substantial opportunities. However, the market faces challenges, including the high cost of equipment and disposables, stringent regulatory approvals, and the potential for procedural complications. The segment encompassing therapeutic applications currently holds the largest market share, reflecting the significant need for effective treatment of hematological malignancies and autoimmune diseases. Key players such as Macopharma, Terumo BCT Inc., and Haemonetics Corporation are strategically investing in research and development to enhance their product portfolios and maintain a competitive edge. Geographic analysis shows North America and Europe currently dominating the market, but the Asia-Pacific region is expected to witness the fastest growth due to rapid economic development and rising healthcare infrastructure.
The forecast period of 2025-2033 anticipates continued market expansion, with the therapeutic applications segment remaining the primary revenue generator. The increasing demand for advanced cell therapies, particularly CAR T-cell therapy, is expected to significantly boost the market for leukapheresis disposables. Furthermore, technological innovations focusing on automated systems and improved safety features will drive market growth. Competitive landscape analysis highlights the strategic importance of mergers and acquisitions, partnerships, and the introduction of innovative products in sustaining growth and market share. However, manufacturers need to address the challenges of cost and access to ensure widespread adoption of leukapheresis technologies, particularly in resource-limited settings. Future projections indicate substantial market potential, driven by continuous technological advancements and increasing healthcare spending globally.
This comprehensive report provides a detailed analysis of the Leukapheresis industry, covering market size, segmentation, growth drivers, challenges, and key players. The study period spans from 2019 to 2033, with 2025 serving as the base and estimated year. The report offers actionable insights for industry stakeholders, including manufacturers, researchers, investors, and regulatory bodies. The global Leukapheresis market is projected to reach xx Million by 2033, exhibiting a CAGR of xx% during the forecast period (2025-2033).
Leukapheresis Industry Market Concentration & Innovation
The Leukapheresis industry exhibits a moderately concentrated market structure, with key players like Terumo BCT Inc, Macopharma, and Fresenius SE & Co KGaA holding significant market share. Precise market share figures are unavailable for this report, but preliminary estimates show that the top five players collectively command approximately xx% of the global market. Innovation within the industry is driven by the rising demand for efficient and safe cell separation technologies, particularly in cell therapy and blood processing. Stringent regulatory frameworks, such as those enforced by the FDA and EMA, guide product development and approval processes. The industry witnesses ongoing M&A activities, with deal values reaching xx Million in recent years. These mergers and acquisitions aim to expand market reach, enhance product portfolios, and gain access to innovative technologies. Substitutes for leukapheresis devices are limited, with the primary competition coming from alternative cell separation technologies, which is gradually losing traction due to the increasing preference for the precision and efficiency of leukapheresis.
- Innovation Drivers: Advancements in cell separation technologies, miniaturization, automation, and improved disposables.
- Regulatory Landscape: Stringent regulatory guidelines and approvals influencing product development.
- M&A Activities: Consolidation in the industry driven by growth strategies of major players.
- End-User Trends: Increasing demand for autologous and allogeneic cell therapies fueling market growth.
Leukapheresis Industry Industry Trends & Insights
The Leukapheresis market is experiencing robust growth driven by the increasing adoption of cell therapies for cancer treatment, autoimmune disorders, and other therapeutic applications. Technological advancements, such as the development of closed-system devices, improved cell processing techniques, and automation are enhancing efficiency, safety, and throughput. Market penetration for automated systems continues to improve, surpassing xx% in developed markets. Consumer preferences are shifting towards user-friendly devices and increased ease of integration in clinical workflows. Competitive dynamics are shaped by innovation, pricing strategies, and market access. The global market is expected to reach xx Million by 2033. The CAGR of the industry is expected to be around xx%.
Dominant Markets & Segments in Leukapheresis Industry
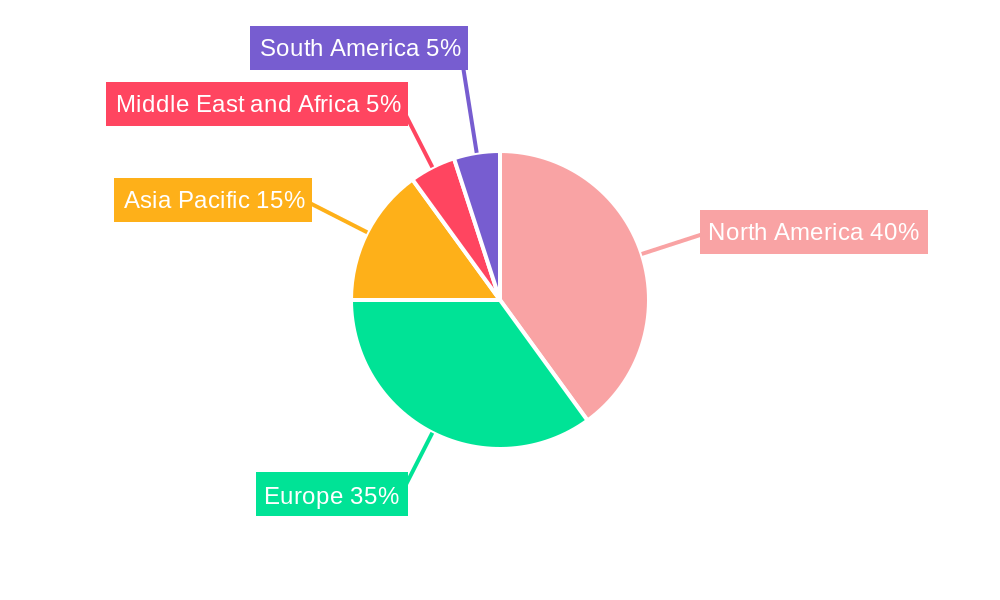
Leading Region/Country: North America currently dominates the Leukapheresis market due to high healthcare expenditure, advanced infrastructure, and a strong focus on cell therapy research. Europe holds the second largest market share. Key factors driving dominance in these regions include robust healthcare systems, advanced research infrastructure, and favorable regulatory environments.
Type: The Leukapheresis Devices segment currently holds the largest market share, driven by the increasing demand for efficient and automated cell separation technologies.
Application: The therapeutic application segment (e.g., cancer treatment, stem cell transplantation) dominates, while research applications are experiencing strong growth, fueled by advancements in cell therapy research. The increasing adoption of CAR T-cell therapy is also driving the growth of this segment.
Leukoreduction Filters/Disposables: This segment is strongly linked to blood transfusion procedures and is witnessing steady growth aligned with the overall growth of the blood banking sector. Growth in this segment is driven by the increased emphasis on blood safety and the development of advanced filtration technologies.
Leukapheresis Industry Product Developments
Recent advancements in leukapheresis technology include the introduction of closed-system devices to minimize the risk of contamination, improved cell recovery rates, and automation to increase throughput. This improves both patient safety and efficiency within clinical settings. These innovations cater to the growing demand for advanced cell separation technologies in various therapeutic and research applications, with a significant focus on improving ease of use and minimizing processing time.
Report Scope & Segmentation Analysis
This report segments the Leukapheresis market based on Type (Leukapheresis Devices, Leukoreduction Filters), Application (Therapeutic Applications, Research Applications), and Geography. The Leukapheresis Devices segment is expected to witness robust growth, driven by advancements in automation and improved safety features. The Therapeutic Applications segment is currently the largest revenue generator, with high growth potential in the forecast period due to increased adoption of cell therapies. The Leukoreduction Filters segment is expected to exhibit moderate growth, driven by advancements in filtration technology and increasing blood transfusion volumes. Market sizes and growth projections are included in the full report for each segment.
Key Drivers of Leukapheresis Industry Growth
The Leukapheresis industry’s growth is fueled by several factors: the increasing prevalence of blood-related diseases and disorders, the growing demand for advanced cell therapy treatments (e.g., CAR T-cell therapy), ongoing technological advancements leading to improved device efficiency and safety, and supportive regulatory frameworks promoting innovation and market access. Government initiatives focusing on the advancement of cell therapies further contribute to the growth of this sector.
Challenges in the Leukapheresis Industry Sector
The Leukapheresis industry faces challenges such as stringent regulatory approvals, potentially resulting in higher research and development costs, and complex supply chain management for specialized components. These challenges can result in delays in product launch and potentially higher costs to end-users. Competitive pressures also exist, particularly from smaller emerging companies developing alternative technologies.
Emerging Opportunities in Leukapheresis Industry
Emerging opportunities lie in the development of portable and point-of-care leukapheresis devices, expanding applications in regenerative medicine, and exploring new markets in developing countries. Further innovation in automation, miniaturization, and closed-system technologies will also create significant opportunities for growth.
Leading Players in the Leukapheresis Industry Market
- Macopharma
- Terumo BCT Inc
- STEMCELL Technologies Inc
- Asahi Kasei Medical Co Ltd
- Miltenyi Biotec
- Fresenius SE & Co KGaA
- StemExpress
- B Braun Melsungen AG
- Haemonetics Corporation
- Medica SPA
- BioIVT LLC
Key Developments in Leukapheresis Industry Industry
February 2022: Cryoport Inc. and Cell Matters SA formed a strategic partnership to offer complete cryopreservation services for therapies derived from leukapheresis, supporting both autologous and allogeneic cell therapies for the life sciences industry. This collaboration expands access to cryopreservation services and enhances the supply chain for cell therapies.
May 2022: Plandai Biotechnology Inc. signed a non-binding letter of intent to establish a new business through a product and technology rights licensing agreement with Puriblood Medical Co., Ltd., the owner of rights to the Puriblood leukocyte reduction blood filtration system. This signifies the potential entry of Plandai into the leukocyte reduction filtration market and enhances product diversification.
Strategic Outlook for Leukapheresis Industry Market
The Leukapheresis market exhibits robust growth potential driven by increased demand for cell therapies and ongoing technological advancements. Future opportunities lie in personalized medicine, innovative device designs, and expanding into emerging markets. Focusing on strategic partnerships, R&D investments, and regulatory compliance will be crucial for success in this dynamic industry.
Leukapheresis Industry Segmentation
-
1. Type
-
1.1. Leukapheresis Devices
- 1.1.1. Apheresis Devices
- 1.1.2. Leukapheresis Columns and Cell Separators
- 1.1.3. Leukoreduction Filters
- 1.2. Leukapheresis Disposables
-
1.1. Leukapheresis Devices
-
2. Application
- 2.1. Therapeutic Applications
- 2.2. Research Applications
Leukapheresis Industry Segmentation By Geography
-
1. North America
- 1.1. United States
- 1.2. Canada
- 1.3. Mexico
-
2. Europe
- 2.1. Germany
- 2.2. United Kingdom
- 2.3. France
- 2.4. Italy
- 2.5. Spain
- 2.6. Rest of Europe
-
3. Asia Pacific
- 3.1. China
- 3.2. Japan
- 3.3. India
- 3.4. Australia
- 3.5. South Korea
- 3.6. Rest of Asia Pacific
-
4. Middle East and Africa
- 4.1. GCC
- 4.2. South Africa
- 4.3. Rest of Middle East and Africa
-
5. South America
- 5.1. Brazil
- 5.2. Argentina
- 5.3. Rest of South America
Leukapheresis Industry REPORT HIGHLIGHTS
| Aspects | Details |
|---|---|
| Study Period | 2019-2033 |
| Base Year | 2024 |
| Estimated Year | 2025 |
| Forecast Period | 2025-2033 |
| Historical Period | 2019-2024 |
| Growth Rate | CAGR of 7.15% from 2019-2033 |
| Segmentation |
|
Table of Contents
- 1. Introduction
- 1.1. Research Scope
- 1.2. Market Segmentation
- 1.3. Research Methodology
- 1.4. Definitions and Assumptions
- 2. Executive Summary
- 2.1. Introduction
- 3. Market Dynamics
- 3.1. Introduction
- 3.2. Market Drivers
- 3.2.1. Increasing Prevalence of Leukemia; Growing Demand for Leukopaks in Clinical Research Activities
- 3.3. Market Restrains
- 3.3.1. High Cost of Therapeutic Leukapheresis; Stringent Regulatory Issues for Donor Recruitment
- 3.4. Market Trends
- 3.4.1. Apheresis Device Segment is Expected to Hold a Significant Share in the Leukapheresis Market
- 4. Market Factor Analysis
- 4.1. Porters Five Forces
- 4.2. Supply/Value Chain
- 4.3. PESTEL analysis
- 4.4. Market Entropy
- 4.5. Patent/Trademark Analysis
- 5. Global Leukapheresis Industry Analysis, Insights and Forecast, 2019-2031
- 5.1. Market Analysis, Insights and Forecast - by Type
- 5.1.1. Leukapheresis Devices
- 5.1.1.1. Apheresis Devices
- 5.1.1.2. Leukapheresis Columns and Cell Separators
- 5.1.1.3. Leukoreduction Filters
- 5.1.2. Leukapheresis Disposables
- 5.1.1. Leukapheresis Devices
- 5.2. Market Analysis, Insights and Forecast - by Application
- 5.2.1. Therapeutic Applications
- 5.2.2. Research Applications
- 5.3. Market Analysis, Insights and Forecast - by Region
- 5.3.1. North America
- 5.3.2. Europe
- 5.3.3. Asia Pacific
- 5.3.4. Middle East and Africa
- 5.3.5. South America
- 5.1. Market Analysis, Insights and Forecast - by Type
- 6. North America Leukapheresis Industry Analysis, Insights and Forecast, 2019-2031
- 6.1. Market Analysis, Insights and Forecast - by Type
- 6.1.1. Leukapheresis Devices
- 6.1.1.1. Apheresis Devices
- 6.1.1.2. Leukapheresis Columns and Cell Separators
- 6.1.1.3. Leukoreduction Filters
- 6.1.2. Leukapheresis Disposables
- 6.1.1. Leukapheresis Devices
- 6.2. Market Analysis, Insights and Forecast - by Application
- 6.2.1. Therapeutic Applications
- 6.2.2. Research Applications
- 6.1. Market Analysis, Insights and Forecast - by Type
- 7. Europe Leukapheresis Industry Analysis, Insights and Forecast, 2019-2031
- 7.1. Market Analysis, Insights and Forecast - by Type
- 7.1.1. Leukapheresis Devices
- 7.1.1.1. Apheresis Devices
- 7.1.1.2. Leukapheresis Columns and Cell Separators
- 7.1.1.3. Leukoreduction Filters
- 7.1.2. Leukapheresis Disposables
- 7.1.1. Leukapheresis Devices
- 7.2. Market Analysis, Insights and Forecast - by Application
- 7.2.1. Therapeutic Applications
- 7.2.2. Research Applications
- 7.1. Market Analysis, Insights and Forecast - by Type
- 8. Asia Pacific Leukapheresis Industry Analysis, Insights and Forecast, 2019-2031
- 8.1. Market Analysis, Insights and Forecast - by Type
- 8.1.1. Leukapheresis Devices
- 8.1.1.1. Apheresis Devices
- 8.1.1.2. Leukapheresis Columns and Cell Separators
- 8.1.1.3. Leukoreduction Filters
- 8.1.2. Leukapheresis Disposables
- 8.1.1. Leukapheresis Devices
- 8.2. Market Analysis, Insights and Forecast - by Application
- 8.2.1. Therapeutic Applications
- 8.2.2. Research Applications
- 8.1. Market Analysis, Insights and Forecast - by Type
- 9. Middle East and Africa Leukapheresis Industry Analysis, Insights and Forecast, 2019-2031
- 9.1. Market Analysis, Insights and Forecast - by Type
- 9.1.1. Leukapheresis Devices
- 9.1.1.1. Apheresis Devices
- 9.1.1.2. Leukapheresis Columns and Cell Separators
- 9.1.1.3. Leukoreduction Filters
- 9.1.2. Leukapheresis Disposables
- 9.1.1. Leukapheresis Devices
- 9.2. Market Analysis, Insights and Forecast - by Application
- 9.2.1. Therapeutic Applications
- 9.2.2. Research Applications
- 9.1. Market Analysis, Insights and Forecast - by Type
- 10. South America Leukapheresis Industry Analysis, Insights and Forecast, 2019-2031
- 10.1. Market Analysis, Insights and Forecast - by Type
- 10.1.1. Leukapheresis Devices
- 10.1.1.1. Apheresis Devices
- 10.1.1.2. Leukapheresis Columns and Cell Separators
- 10.1.1.3. Leukoreduction Filters
- 10.1.2. Leukapheresis Disposables
- 10.1.1. Leukapheresis Devices
- 10.2. Market Analysis, Insights and Forecast - by Application
- 10.2.1. Therapeutic Applications
- 10.2.2. Research Applications
- 10.1. Market Analysis, Insights and Forecast - by Type
- 11. North America Leukapheresis Industry Analysis, Insights and Forecast, 2019-2031
- 11.1. Market Analysis, Insights and Forecast - By Country/Sub-region
- 11.1.1. undefined
- 12. Europe Leukapheresis Industry Analysis, Insights and Forecast, 2019-2031
- 12.1. Market Analysis, Insights and Forecast - By Country/Sub-region
- 12.1.1. undefined
- 13. Asia Pacific Leukapheresis Industry Analysis, Insights and Forecast, 2019-2031
- 13.1. Market Analysis, Insights and Forecast - By Country/Sub-region
- 13.1.1. undefined
- 14. Middle East and Africa Leukapheresis Industry Analysis, Insights and Forecast, 2019-2031
- 14.1. Market Analysis, Insights and Forecast - By Country/Sub-region
- 14.1.1. undefined
- 15. South America Leukapheresis Industry Analysis, Insights and Forecast, 2019-2031
- 15.1. Market Analysis, Insights and Forecast - By Country/Sub-region
- 15.1.1. undefined
- 16. Competitive Analysis
- 16.1. Global Market Share Analysis 2024
- 16.2. Company Profiles
- 16.2.1 Macopharma
- 16.2.1.1. Overview
- 16.2.1.2. Products
- 16.2.1.3. SWOT Analysis
- 16.2.1.4. Recent Developments
- 16.2.1.5. Financials (Based on Availability)
- 16.2.2 Terumo BCT Inc
- 16.2.2.1. Overview
- 16.2.2.2. Products
- 16.2.2.3. SWOT Analysis
- 16.2.2.4. Recent Developments
- 16.2.2.5. Financials (Based on Availability)
- 16.2.3 STEMCELL Technologies Inc
- 16.2.3.1. Overview
- 16.2.3.2. Products
- 16.2.3.3. SWOT Analysis
- 16.2.3.4. Recent Developments
- 16.2.3.5. Financials (Based on Availability)
- 16.2.4 Asahi Kasei Medical Co Ltd
- 16.2.4.1. Overview
- 16.2.4.2. Products
- 16.2.4.3. SWOT Analysis
- 16.2.4.4. Recent Developments
- 16.2.4.5. Financials (Based on Availability)
- 16.2.5 Miltenyi Biotec
- 16.2.5.1. Overview
- 16.2.5.2. Products
- 16.2.5.3. SWOT Analysis
- 16.2.5.4. Recent Developments
- 16.2.5.5. Financials (Based on Availability)
- 16.2.6 Fresenius SE & Co KGaA
- 16.2.6.1. Overview
- 16.2.6.2. Products
- 16.2.6.3. SWOT Analysis
- 16.2.6.4. Recent Developments
- 16.2.6.5. Financials (Based on Availability)
- 16.2.7 StemExpress
- 16.2.7.1. Overview
- 16.2.7.2. Products
- 16.2.7.3. SWOT Analysis
- 16.2.7.4. Recent Developments
- 16.2.7.5. Financials (Based on Availability)
- 16.2.8 B Braun Melsungen AG
- 16.2.8.1. Overview
- 16.2.8.2. Products
- 16.2.8.3. SWOT Analysis
- 16.2.8.4. Recent Developments
- 16.2.8.5. Financials (Based on Availability)
- 16.2.9 Haemonetics Corporation
- 16.2.9.1. Overview
- 16.2.9.2. Products
- 16.2.9.3. SWOT Analysis
- 16.2.9.4. Recent Developments
- 16.2.9.5. Financials (Based on Availability)
- 16.2.10 Medica SPA
- 16.2.10.1. Overview
- 16.2.10.2. Products
- 16.2.10.3. SWOT Analysis
- 16.2.10.4. Recent Developments
- 16.2.10.5. Financials (Based on Availability)
- 16.2.11 BioIVT LLC
- 16.2.11.1. Overview
- 16.2.11.2. Products
- 16.2.11.3. SWOT Analysis
- 16.2.11.4. Recent Developments
- 16.2.11.5. Financials (Based on Availability)
- 16.2.1 Macopharma
List of Figures
- Figure 1: Global Leukapheresis Industry Revenue Breakdown (Million, %) by Region 2024 & 2032
- Figure 2: Global Leukapheresis Industry Volume Breakdown (K Unit, %) by Region 2024 & 2032
- Figure 3: North America Leukapheresis Industry Revenue (Million), by Country 2024 & 2032
- Figure 4: North America Leukapheresis Industry Volume (K Unit), by Country 2024 & 2032
- Figure 5: North America Leukapheresis Industry Revenue Share (%), by Country 2024 & 2032
- Figure 6: North America Leukapheresis Industry Volume Share (%), by Country 2024 & 2032
- Figure 7: Europe Leukapheresis Industry Revenue (Million), by Country 2024 & 2032
- Figure 8: Europe Leukapheresis Industry Volume (K Unit), by Country 2024 & 2032
- Figure 9: Europe Leukapheresis Industry Revenue Share (%), by Country 2024 & 2032
- Figure 10: Europe Leukapheresis Industry Volume Share (%), by Country 2024 & 2032
- Figure 11: Asia Pacific Leukapheresis Industry Revenue (Million), by Country 2024 & 2032
- Figure 12: Asia Pacific Leukapheresis Industry Volume (K Unit), by Country 2024 & 2032
- Figure 13: Asia Pacific Leukapheresis Industry Revenue Share (%), by Country 2024 & 2032
- Figure 14: Asia Pacific Leukapheresis Industry Volume Share (%), by Country 2024 & 2032
- Figure 15: Middle East and Africa Leukapheresis Industry Revenue (Million), by Country 2024 & 2032
- Figure 16: Middle East and Africa Leukapheresis Industry Volume (K Unit), by Country 2024 & 2032
- Figure 17: Middle East and Africa Leukapheresis Industry Revenue Share (%), by Country 2024 & 2032
- Figure 18: Middle East and Africa Leukapheresis Industry Volume Share (%), by Country 2024 & 2032
- Figure 19: South America Leukapheresis Industry Revenue (Million), by Country 2024 & 2032
- Figure 20: South America Leukapheresis Industry Volume (K Unit), by Country 2024 & 2032
- Figure 21: South America Leukapheresis Industry Revenue Share (%), by Country 2024 & 2032
- Figure 22: South America Leukapheresis Industry Volume Share (%), by Country 2024 & 2032
- Figure 23: North America Leukapheresis Industry Revenue (Million), by Type 2024 & 2032
- Figure 24: North America Leukapheresis Industry Volume (K Unit), by Type 2024 & 2032
- Figure 25: North America Leukapheresis Industry Revenue Share (%), by Type 2024 & 2032
- Figure 26: North America Leukapheresis Industry Volume Share (%), by Type 2024 & 2032
- Figure 27: North America Leukapheresis Industry Revenue (Million), by Application 2024 & 2032
- Figure 28: North America Leukapheresis Industry Volume (K Unit), by Application 2024 & 2032
- Figure 29: North America Leukapheresis Industry Revenue Share (%), by Application 2024 & 2032
- Figure 30: North America Leukapheresis Industry Volume Share (%), by Application 2024 & 2032
- Figure 31: North America Leukapheresis Industry Revenue (Million), by Country 2024 & 2032
- Figure 32: North America Leukapheresis Industry Volume (K Unit), by Country 2024 & 2032
- Figure 33: North America Leukapheresis Industry Revenue Share (%), by Country 2024 & 2032
- Figure 34: North America Leukapheresis Industry Volume Share (%), by Country 2024 & 2032
- Figure 35: Europe Leukapheresis Industry Revenue (Million), by Type 2024 & 2032
- Figure 36: Europe Leukapheresis Industry Volume (K Unit), by Type 2024 & 2032
- Figure 37: Europe Leukapheresis Industry Revenue Share (%), by Type 2024 & 2032
- Figure 38: Europe Leukapheresis Industry Volume Share (%), by Type 2024 & 2032
- Figure 39: Europe Leukapheresis Industry Revenue (Million), by Application 2024 & 2032
- Figure 40: Europe Leukapheresis Industry Volume (K Unit), by Application 2024 & 2032
- Figure 41: Europe Leukapheresis Industry Revenue Share (%), by Application 2024 & 2032
- Figure 42: Europe Leukapheresis Industry Volume Share (%), by Application 2024 & 2032
- Figure 43: Europe Leukapheresis Industry Revenue (Million), by Country 2024 & 2032
- Figure 44: Europe Leukapheresis Industry Volume (K Unit), by Country 2024 & 2032
- Figure 45: Europe Leukapheresis Industry Revenue Share (%), by Country 2024 & 2032
- Figure 46: Europe Leukapheresis Industry Volume Share (%), by Country 2024 & 2032
- Figure 47: Asia Pacific Leukapheresis Industry Revenue (Million), by Type 2024 & 2032
- Figure 48: Asia Pacific Leukapheresis Industry Volume (K Unit), by Type 2024 & 2032
- Figure 49: Asia Pacific Leukapheresis Industry Revenue Share (%), by Type 2024 & 2032
- Figure 50: Asia Pacific Leukapheresis Industry Volume Share (%), by Type 2024 & 2032
- Figure 51: Asia Pacific Leukapheresis Industry Revenue (Million), by Application 2024 & 2032
- Figure 52: Asia Pacific Leukapheresis Industry Volume (K Unit), by Application 2024 & 2032
- Figure 53: Asia Pacific Leukapheresis Industry Revenue Share (%), by Application 2024 & 2032
- Figure 54: Asia Pacific Leukapheresis Industry Volume Share (%), by Application 2024 & 2032
- Figure 55: Asia Pacific Leukapheresis Industry Revenue (Million), by Country 2024 & 2032
- Figure 56: Asia Pacific Leukapheresis Industry Volume (K Unit), by Country 2024 & 2032
- Figure 57: Asia Pacific Leukapheresis Industry Revenue Share (%), by Country 2024 & 2032
- Figure 58: Asia Pacific Leukapheresis Industry Volume Share (%), by Country 2024 & 2032
- Figure 59: Middle East and Africa Leukapheresis Industry Revenue (Million), by Type 2024 & 2032
- Figure 60: Middle East and Africa Leukapheresis Industry Volume (K Unit), by Type 2024 & 2032
- Figure 61: Middle East and Africa Leukapheresis Industry Revenue Share (%), by Type 2024 & 2032
- Figure 62: Middle East and Africa Leukapheresis Industry Volume Share (%), by Type 2024 & 2032
- Figure 63: Middle East and Africa Leukapheresis Industry Revenue (Million), by Application 2024 & 2032
- Figure 64: Middle East and Africa Leukapheresis Industry Volume (K Unit), by Application 2024 & 2032
- Figure 65: Middle East and Africa Leukapheresis Industry Revenue Share (%), by Application 2024 & 2032
- Figure 66: Middle East and Africa Leukapheresis Industry Volume Share (%), by Application 2024 & 2032
- Figure 67: Middle East and Africa Leukapheresis Industry Revenue (Million), by Country 2024 & 2032
- Figure 68: Middle East and Africa Leukapheresis Industry Volume (K Unit), by Country 2024 & 2032
- Figure 69: Middle East and Africa Leukapheresis Industry Revenue Share (%), by Country 2024 & 2032
- Figure 70: Middle East and Africa Leukapheresis Industry Volume Share (%), by Country 2024 & 2032
- Figure 71: South America Leukapheresis Industry Revenue (Million), by Type 2024 & 2032
- Figure 72: South America Leukapheresis Industry Volume (K Unit), by Type 2024 & 2032
- Figure 73: South America Leukapheresis Industry Revenue Share (%), by Type 2024 & 2032
- Figure 74: South America Leukapheresis Industry Volume Share (%), by Type 2024 & 2032
- Figure 75: South America Leukapheresis Industry Revenue (Million), by Application 2024 & 2032
- Figure 76: South America Leukapheresis Industry Volume (K Unit), by Application 2024 & 2032
- Figure 77: South America Leukapheresis Industry Revenue Share (%), by Application 2024 & 2032
- Figure 78: South America Leukapheresis Industry Volume Share (%), by Application 2024 & 2032
- Figure 79: South America Leukapheresis Industry Revenue (Million), by Country 2024 & 2032
- Figure 80: South America Leukapheresis Industry Volume (K Unit), by Country 2024 & 2032
- Figure 81: South America Leukapheresis Industry Revenue Share (%), by Country 2024 & 2032
- Figure 82: South America Leukapheresis Industry Volume Share (%), by Country 2024 & 2032
List of Tables
- Table 1: Global Leukapheresis Industry Revenue Million Forecast, by Region 2019 & 2032
- Table 2: Global Leukapheresis Industry Volume K Unit Forecast, by Region 2019 & 2032
- Table 3: Global Leukapheresis Industry Revenue Million Forecast, by Type 2019 & 2032
- Table 4: Global Leukapheresis Industry Volume K Unit Forecast, by Type 2019 & 2032
- Table 5: Global Leukapheresis Industry Revenue Million Forecast, by Application 2019 & 2032
- Table 6: Global Leukapheresis Industry Volume K Unit Forecast, by Application 2019 & 2032
- Table 7: Global Leukapheresis Industry Revenue Million Forecast, by Region 2019 & 2032
- Table 8: Global Leukapheresis Industry Volume K Unit Forecast, by Region 2019 & 2032
- Table 9: Global Leukapheresis Industry Revenue Million Forecast, by Country 2019 & 2032
- Table 10: Global Leukapheresis Industry Volume K Unit Forecast, by Country 2019 & 2032
- Table 11: Global Leukapheresis Industry Revenue Million Forecast, by Country 2019 & 2032
- Table 12: Global Leukapheresis Industry Volume K Unit Forecast, by Country 2019 & 2032
- Table 13: Global Leukapheresis Industry Revenue Million Forecast, by Country 2019 & 2032
- Table 14: Global Leukapheresis Industry Volume K Unit Forecast, by Country 2019 & 2032
- Table 15: Global Leukapheresis Industry Revenue Million Forecast, by Country 2019 & 2032
- Table 16: Global Leukapheresis Industry Volume K Unit Forecast, by Country 2019 & 2032
- Table 17: Global Leukapheresis Industry Revenue Million Forecast, by Country 2019 & 2032
- Table 18: Global Leukapheresis Industry Volume K Unit Forecast, by Country 2019 & 2032
- Table 19: Global Leukapheresis Industry Revenue Million Forecast, by Type 2019 & 2032
- Table 20: Global Leukapheresis Industry Volume K Unit Forecast, by Type 2019 & 2032
- Table 21: Global Leukapheresis Industry Revenue Million Forecast, by Application 2019 & 2032
- Table 22: Global Leukapheresis Industry Volume K Unit Forecast, by Application 2019 & 2032
- Table 23: Global Leukapheresis Industry Revenue Million Forecast, by Country 2019 & 2032
- Table 24: Global Leukapheresis Industry Volume K Unit Forecast, by Country 2019 & 2032
- Table 25: United States Leukapheresis Industry Revenue (Million) Forecast, by Application 2019 & 2032
- Table 26: United States Leukapheresis Industry Volume (K Unit) Forecast, by Application 2019 & 2032
- Table 27: Canada Leukapheresis Industry Revenue (Million) Forecast, by Application 2019 & 2032
- Table 28: Canada Leukapheresis Industry Volume (K Unit) Forecast, by Application 2019 & 2032
- Table 29: Mexico Leukapheresis Industry Revenue (Million) Forecast, by Application 2019 & 2032
- Table 30: Mexico Leukapheresis Industry Volume (K Unit) Forecast, by Application 2019 & 2032
- Table 31: Global Leukapheresis Industry Revenue Million Forecast, by Type 2019 & 2032
- Table 32: Global Leukapheresis Industry Volume K Unit Forecast, by Type 2019 & 2032
- Table 33: Global Leukapheresis Industry Revenue Million Forecast, by Application 2019 & 2032
- Table 34: Global Leukapheresis Industry Volume K Unit Forecast, by Application 2019 & 2032
- Table 35: Global Leukapheresis Industry Revenue Million Forecast, by Country 2019 & 2032
- Table 36: Global Leukapheresis Industry Volume K Unit Forecast, by Country 2019 & 2032
- Table 37: Germany Leukapheresis Industry Revenue (Million) Forecast, by Application 2019 & 2032
- Table 38: Germany Leukapheresis Industry Volume (K Unit) Forecast, by Application 2019 & 2032
- Table 39: United Kingdom Leukapheresis Industry Revenue (Million) Forecast, by Application 2019 & 2032
- Table 40: United Kingdom Leukapheresis Industry Volume (K Unit) Forecast, by Application 2019 & 2032
- Table 41: France Leukapheresis Industry Revenue (Million) Forecast, by Application 2019 & 2032
- Table 42: France Leukapheresis Industry Volume (K Unit) Forecast, by Application 2019 & 2032
- Table 43: Italy Leukapheresis Industry Revenue (Million) Forecast, by Application 2019 & 2032
- Table 44: Italy Leukapheresis Industry Volume (K Unit) Forecast, by Application 2019 & 2032
- Table 45: Spain Leukapheresis Industry Revenue (Million) Forecast, by Application 2019 & 2032
- Table 46: Spain Leukapheresis Industry Volume (K Unit) Forecast, by Application 2019 & 2032
- Table 47: Rest of Europe Leukapheresis Industry Revenue (Million) Forecast, by Application 2019 & 2032
- Table 48: Rest of Europe Leukapheresis Industry Volume (K Unit) Forecast, by Application 2019 & 2032
- Table 49: Global Leukapheresis Industry Revenue Million Forecast, by Type 2019 & 2032
- Table 50: Global Leukapheresis Industry Volume K Unit Forecast, by Type 2019 & 2032
- Table 51: Global Leukapheresis Industry Revenue Million Forecast, by Application 2019 & 2032
- Table 52: Global Leukapheresis Industry Volume K Unit Forecast, by Application 2019 & 2032
- Table 53: Global Leukapheresis Industry Revenue Million Forecast, by Country 2019 & 2032
- Table 54: Global Leukapheresis Industry Volume K Unit Forecast, by Country 2019 & 2032
- Table 55: China Leukapheresis Industry Revenue (Million) Forecast, by Application 2019 & 2032
- Table 56: China Leukapheresis Industry Volume (K Unit) Forecast, by Application 2019 & 2032
- Table 57: Japan Leukapheresis Industry Revenue (Million) Forecast, by Application 2019 & 2032
- Table 58: Japan Leukapheresis Industry Volume (K Unit) Forecast, by Application 2019 & 2032
- Table 59: India Leukapheresis Industry Revenue (Million) Forecast, by Application 2019 & 2032
- Table 60: India Leukapheresis Industry Volume (K Unit) Forecast, by Application 2019 & 2032
- Table 61: Australia Leukapheresis Industry Revenue (Million) Forecast, by Application 2019 & 2032
- Table 62: Australia Leukapheresis Industry Volume (K Unit) Forecast, by Application 2019 & 2032
- Table 63: South Korea Leukapheresis Industry Revenue (Million) Forecast, by Application 2019 & 2032
- Table 64: South Korea Leukapheresis Industry Volume (K Unit) Forecast, by Application 2019 & 2032
- Table 65: Rest of Asia Pacific Leukapheresis Industry Revenue (Million) Forecast, by Application 2019 & 2032
- Table 66: Rest of Asia Pacific Leukapheresis Industry Volume (K Unit) Forecast, by Application 2019 & 2032
- Table 67: Global Leukapheresis Industry Revenue Million Forecast, by Type 2019 & 2032
- Table 68: Global Leukapheresis Industry Volume K Unit Forecast, by Type 2019 & 2032
- Table 69: Global Leukapheresis Industry Revenue Million Forecast, by Application 2019 & 2032
- Table 70: Global Leukapheresis Industry Volume K Unit Forecast, by Application 2019 & 2032
- Table 71: Global Leukapheresis Industry Revenue Million Forecast, by Country 2019 & 2032
- Table 72: Global Leukapheresis Industry Volume K Unit Forecast, by Country 2019 & 2032
- Table 73: GCC Leukapheresis Industry Revenue (Million) Forecast, by Application 2019 & 2032
- Table 74: GCC Leukapheresis Industry Volume (K Unit) Forecast, by Application 2019 & 2032
- Table 75: South Africa Leukapheresis Industry Revenue (Million) Forecast, by Application 2019 & 2032
- Table 76: South Africa Leukapheresis Industry Volume (K Unit) Forecast, by Application 2019 & 2032
- Table 77: Rest of Middle East and Africa Leukapheresis Industry Revenue (Million) Forecast, by Application 2019 & 2032
- Table 78: Rest of Middle East and Africa Leukapheresis Industry Volume (K Unit) Forecast, by Application 2019 & 2032
- Table 79: Global Leukapheresis Industry Revenue Million Forecast, by Type 2019 & 2032
- Table 80: Global Leukapheresis Industry Volume K Unit Forecast, by Type 2019 & 2032
- Table 81: Global Leukapheresis Industry Revenue Million Forecast, by Application 2019 & 2032
- Table 82: Global Leukapheresis Industry Volume K Unit Forecast, by Application 2019 & 2032
- Table 83: Global Leukapheresis Industry Revenue Million Forecast, by Country 2019 & 2032
- Table 84: Global Leukapheresis Industry Volume K Unit Forecast, by Country 2019 & 2032
- Table 85: Brazil Leukapheresis Industry Revenue (Million) Forecast, by Application 2019 & 2032
- Table 86: Brazil Leukapheresis Industry Volume (K Unit) Forecast, by Application 2019 & 2032
- Table 87: Argentina Leukapheresis Industry Revenue (Million) Forecast, by Application 2019 & 2032
- Table 88: Argentina Leukapheresis Industry Volume (K Unit) Forecast, by Application 2019 & 2032
- Table 89: Rest of South America Leukapheresis Industry Revenue (Million) Forecast, by Application 2019 & 2032
- Table 90: Rest of South America Leukapheresis Industry Volume (K Unit) Forecast, by Application 2019 & 2032
Frequently Asked Questions
1. What is the projected Compound Annual Growth Rate (CAGR) of the Leukapheresis Industry?
The projected CAGR is approximately 7.15%.
2. Which companies are prominent players in the Leukapheresis Industry?
Key companies in the market include Macopharma, Terumo BCT Inc, STEMCELL Technologies Inc, Asahi Kasei Medical Co Ltd, Miltenyi Biotec, Fresenius SE & Co KGaA, StemExpress, B Braun Melsungen AG, Haemonetics Corporation, Medica SPA, BioIVT LLC.
3. What are the main segments of the Leukapheresis Industry?
The market segments include Type, Application.
4. Can you provide details about the market size?
The market size is estimated to be USD 69.77 Million as of 2022.
5. What are some drivers contributing to market growth?
Increasing Prevalence of Leukemia; Growing Demand for Leukopaks in Clinical Research Activities.
6. What are the notable trends driving market growth?
Apheresis Device Segment is Expected to Hold a Significant Share in the Leukapheresis Market.
7. Are there any restraints impacting market growth?
High Cost of Therapeutic Leukapheresis; Stringent Regulatory Issues for Donor Recruitment.
8. Can you provide examples of recent developments in the market?
May 2022: Plandai Biotechnology Inc. signed a strategic non-binding letter of intent to enter into a new business through a proposed product and technology rights licensing agreement with the holder of rights to the unique Puriblood leukocyte reduction blood filtration system. Puriblood Medical Co., Ltd. develops and sells blood cell separation products, including its leukocyte reduction filters.
9. What pricing options are available for accessing the report?
Pricing options include single-user, multi-user, and enterprise licenses priced at USD 4750, USD 5250, and USD 8750 respectively.
10. Is the market size provided in terms of value or volume?
The market size is provided in terms of value, measured in Million and volume, measured in K Unit.
11. Are there any specific market keywords associated with the report?
Yes, the market keyword associated with the report is "Leukapheresis Industry," which aids in identifying and referencing the specific market segment covered.
12. How do I determine which pricing option suits my needs best?
The pricing options vary based on user requirements and access needs. Individual users may opt for single-user licenses, while businesses requiring broader access may choose multi-user or enterprise licenses for cost-effective access to the report.
13. Are there any additional resources or data provided in the Leukapheresis Industry report?
While the report offers comprehensive insights, it's advisable to review the specific contents or supplementary materials provided to ascertain if additional resources or data are available.
14. How can I stay updated on further developments or reports in the Leukapheresis Industry?
To stay informed about further developments, trends, and reports in the Leukapheresis Industry, consider subscribing to industry newsletters, following relevant companies and organizations, or regularly checking reputable industry news sources and publications.
Methodology
Step 1 - Identification of Relevant Samples Size from Population Database


Step 2 - Approaches for Defining Global Market Size (Value, Volume* & Price*)

Note*: In applicable scenarios
Step 3 - Data Sources
Primary Research
- Web Analytics
- Survey Reports
- Research Institute
- Latest Research Reports
- Opinion Leaders
Secondary Research
- Annual Reports
- White Paper
- Latest Press Release
- Industry Association
- Paid Database
- Investor Presentations

Step 4 - Data Triangulation
Involves using different sources of information in order to increase the validity of a study
These sources are likely to be stakeholders in a program - participants, other researchers, program staff, other community members, and so on.
Then we put all data in single framework & apply various statistical tools to find out the dynamic on the market.
During the analysis stage, feedback from the stakeholder groups would be compared to determine areas of agreement as well as areas of divergence


