
Key Insights
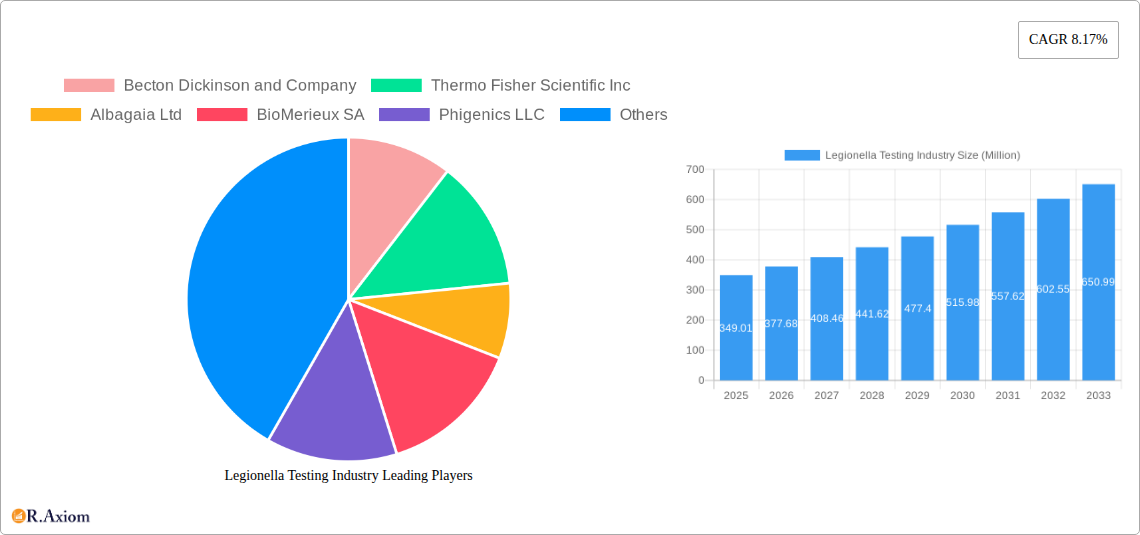
The Legionella testing market, valued at $349.01 million in 2025, is projected to experience robust growth, driven by increasing awareness of Legionnaires' disease, stricter regulations regarding water safety, and advancements in testing technologies. The market's compound annual growth rate (CAGR) of 8.17% from 2019 to 2024 suggests a continued upward trajectory through 2033. Key drivers include the rising prevalence of Legionella infections in healthcare facilities, commercial buildings, and industrial settings, necessitating comprehensive testing programs. Furthermore, the development and adoption of more sensitive and rapid testing methods like PCR, alongside the increasing use of point-of-care testing, are fueling market expansion. The segment encompassing clinical testing methods within hospitals and diagnostic laboratories holds a significant market share, reflecting the critical role of early detection and treatment in managing Legionnaires' disease outbreaks. Technological advancements, particularly in PCR technology which offers high sensitivity and specificity, contribute significantly to market growth. Conversely, factors such as high testing costs, especially for advanced techniques, and the need for skilled personnel to operate sophisticated equipment can potentially act as market restraints. However, the increasing focus on preventive measures and public health initiatives is anticipated to outweigh these limitations.
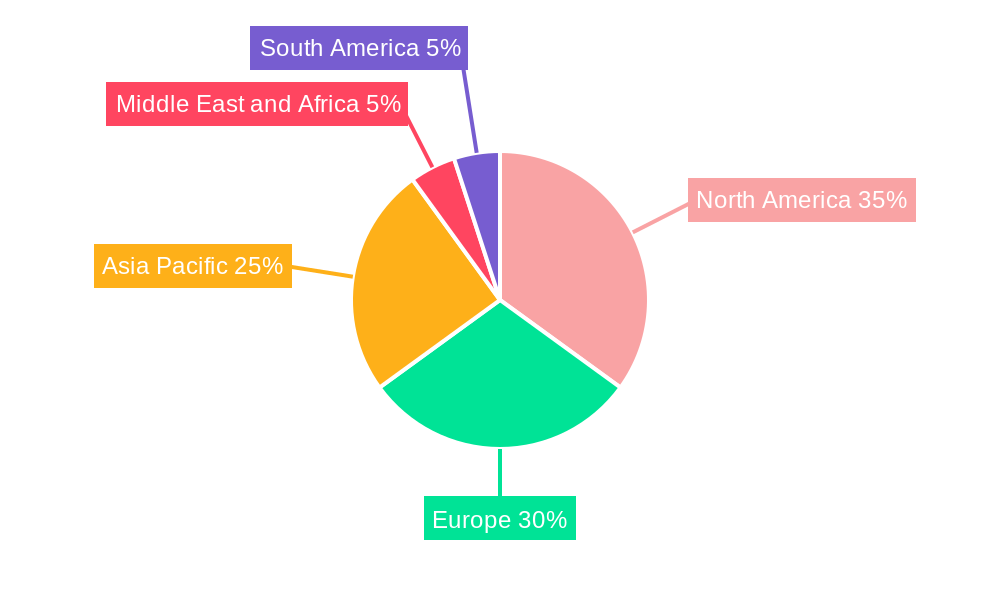
Growth is expected to be particularly strong in regions like Asia-Pacific, fueled by rapid urbanization, rising infrastructure development, and growing awareness of waterborne diseases. North America and Europe, while already established markets, will continue to contribute significantly, driven by stringent regulations and advanced healthcare infrastructure. The competitive landscape comprises established players like Becton Dickinson, Thermo Fisher Scientific, and BioMerieux, alongside several specialized companies offering innovative testing solutions. The market's future growth will depend on continued technological innovation, expansion into emerging markets, and the ongoing implementation of stricter water quality regulations globally. The evolution of testing methods towards rapid, sensitive, and cost-effective solutions will be a key factor shaping the industry's trajectory.
This comprehensive report provides a detailed analysis of the Legionella testing industry, covering market size, segmentation, growth drivers, challenges, and key players. The study period spans from 2019 to 2033, with 2025 serving as the base and estimated year. The forecast period is 2025-2033, and the historical period covers 2019-2024. The global market value is projected to reach xx Million by 2033.
Legionella Testing Industry Market Concentration & Innovation
The Legionella testing market exhibits a moderately concentrated landscape, with several major players holding significant market share. Becton Dickinson and Company, Thermo Fisher Scientific Inc., and BioMérieux SA are among the leading companies, collectively accounting for an estimated xx% of the global market in 2025. Smaller players like Albagaia Ltd, Phigenics LLC, and Aquacert Ltd, contribute to the remaining market share. Market concentration is influenced by factors such as technological advancements, regulatory approvals, and the cost of developing and marketing advanced tests.
Innovation is a crucial driver within the industry, spurred by the need for faster, more accurate, and cost-effective Legionella detection methods. Significant investments in R&D have led to the development of PCR-based tests, which offer superior sensitivity and specificity compared to traditional culture methods. The regulatory environment plays a crucial role, influencing the adoption of new technologies and the availability of testing services. The presence of substitute testing methods and the changing needs of end-users also drive innovation. Mergers and acquisitions (M&A) contribute significantly to market consolidation and technological advancements. In recent years, the value of M&A deals in the Legionella testing sector has reached approximately xx Million, indicating considerable market dynamism.
- Market Share (2025 Estimate):
- Becton Dickinson and Company: xx%
- Thermo Fisher Scientific Inc.: xx%
- BioMérieux SA: xx%
- Others: xx%
- M&A Deal Value (2019-2024): xx Million
Legionella Testing Industry Industry Trends & Insights
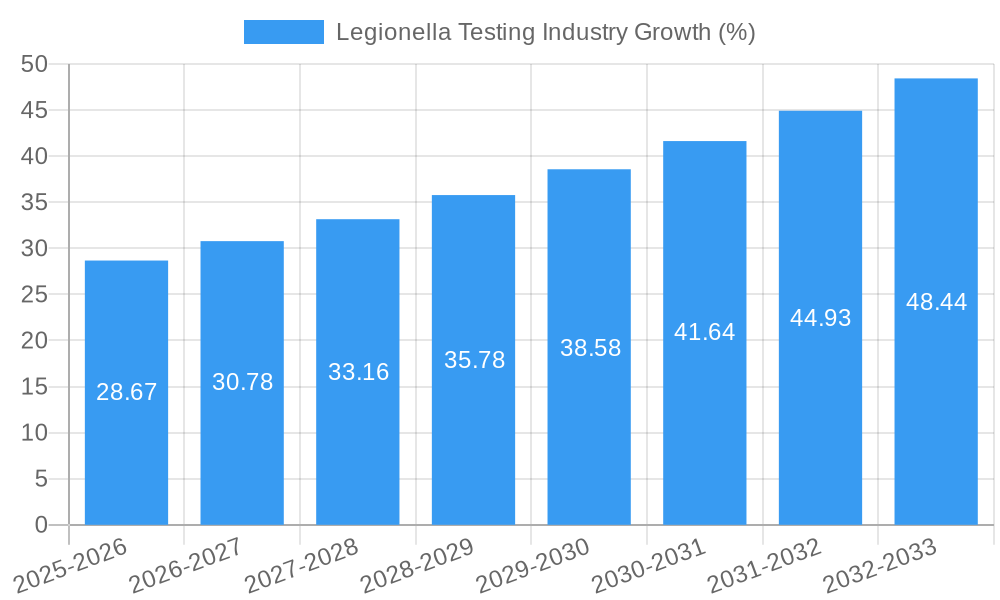
The Legionella testing market is experiencing robust growth, driven by increasing awareness of Legionnaires' disease, stringent regulatory requirements, and technological advancements that have led to more sensitive and rapid testing methods. The market's Compound Annual Growth Rate (CAGR) during the forecast period (2025-2033) is estimated to be xx%. This growth is propelled by factors such as the rising prevalence of Legionnaires' disease globally, increased healthcare spending, and growing investments in infrastructure to combat waterborne diseases. Technological advancements, such as the development of PCR-based tests and automated systems, have significantly improved testing accuracy and reduced turnaround times. Consumer preferences are shifting towards rapid and reliable testing methods, leading to increased adoption of newer technologies. The competitive landscape remains dynamic, with companies constantly striving to improve their testing solutions and expand their market presence. The market penetration of PCR-based tests is growing steadily, driven by the high accuracy of this technology, and currently stands at approximately xx% in 2025.
Dominant Markets & Segments in Legionella Testing Industry
The North American region currently holds the largest market share in the global Legionella testing market, driven by factors such as high healthcare expenditure, stringent regulations, and a well-established healthcare infrastructure. Europe follows as the second largest market. Within the types of tests available, PCR-based tests are gaining significant traction due to their superior sensitivity and speed, while culture methods, although still important, are gradually losing market share due to their relatively longer turnaround times. Regarding applications, clinical testing methods dominate the market, with Environmental testing method market being driven by increasing regulations on water systems in commercial and public buildings. Hospitals and clinics remain the primary end-users for Legionella testing services.
- Key Drivers for North American Dominance:
- Stringent regulations
- High healthcare expenditure
- Advanced healthcare infrastructure
- Key Drivers for PCR test growth:
- High accuracy
- Reduced turnaround times
- Increased sensitivity and specificity
Legionella Testing Industry Product Developments
Recent years have witnessed significant advancements in Legionella testing technology, with a focus on developing rapid, accurate, and easy-to-use diagnostic tools. This includes the introduction of improved PCR-based tests, automated testing systems, and point-of-care testing solutions. These advancements aim to improve the efficiency and speed of diagnosis while reducing the associated costs. New product offerings are continually entering the market, meeting the demands for higher sensitivity, lower turnaround times and simpler usage. This increase in product development strengthens the industry's competitive edge.
Report Scope & Segmentation Analysis
This report segments the Legionella testing market based on test type and application.
Test Type:
- Culture Method: This traditional method remains significant, but its growth is slower compared to newer technologies. Market size in 2025: xx Million.
- Urinary Antigen Test (UAT): A rapid method used in diagnosing Legionnaires' disease. Market size in 2025: xx Million.
- Direct Fluorescent Antibody (DFA) Test: Another rapid test, gaining traction but behind PCR in growth. Market size in 2025: xx Million.
- Polymerase Chain Reaction (PCR): The fastest-growing segment, expected to dominate the market in the coming years. Market size in 2025: xx Million.
- Other Test Types: Includes other emerging technologies. Market size in 2025: xx Million.
Application:
- Clinical Testing Method: Dominates the market due to increased testing of suspected Legionnaires' disease patients. Market size in 2025: xx Million.
- Environmental Testing Method: Growing steadily due to increased regulations and awareness of Legionella in water systems. Market size in 2025: xx Million.
- Hospital and Clinic: The largest end-user segment. Market size in 2025: xx Million.
- Diagnostic Laboratory: Significant market share, providing testing services to hospitals and clinics. Market size in 2025: xx Million.
Key Drivers of Legionella Testing Industry Growth
The growth of the Legionella testing industry is driven by several key factors:
- Rising prevalence of Legionnaires' disease: An increase in cases globally fuels the demand for testing.
- Stringent regulations and guidelines: Government mandates drive testing for water quality.
- Technological advancements: Improved test accuracy and speed lead to wider adoption.
- Increased healthcare spending: Higher investment in diagnostics supports market growth.
Challenges in the Legionella Testing Industry Sector
Several challenges impede the growth of the Legionella testing industry:
- High cost of advanced testing technologies: Limiting accessibility in some regions.
- Complex regulatory frameworks: Varying standards across different regions complicate market entry.
- Supply chain disruptions: Impacting the availability of testing reagents and equipment.
- Competition from established players: Creating a challenging market entry for new companies.
Emerging Opportunities in Legionella Testing Industry
Opportunities abound within the Legionella testing industry:
- Development of point-of-care testing devices: Enabling rapid diagnosis in various settings.
- Expansion into emerging markets: Untapped potential in developing countries with limited testing infrastructure.
- Integration of AI and big data analytics: Improving diagnostics and predicting outbreaks.
- Focus on developing cost-effective testing solutions: Increasing accessibility.
Leading Players in the Legionella Testing Industry Market
- Becton Dickinson and Company
- Thermo Fisher Scientific Inc.
- Albagaia Ltd
- BioMérieux SA
- Phigenics LLC
- Evoqua Water Technologies (Pacific Water Technology)
- Aquacert Ltd
- Merck KgaA
- Qiagen NV
- Danaher Corporation (Pall Corporation)
Key Developments in Legionella Testing Industry Industry
- May 2022: ChemREADY launches new Legionella testing services and product line.
- March 2022: IDEXX's Legiolert test published as ASTM D8429-21 standard test method.
Strategic Outlook for Legionella Testing Industry Market
The Legionella testing market is poised for continued growth, driven by technological innovations, increasing disease prevalence, and stricter regulatory landscapes. Opportunities exist in developing rapid, point-of-care diagnostics, expanding into emerging markets, and integrating advanced analytical tools. Strategic partnerships and acquisitions will continue to shape the competitive landscape, ultimately benefiting both providers and patients through improved disease detection and management.
Legionella Testing Industry Segmentation
- 1. Production Analysis
- 2. Consumption Analysis
- 3. Import Market Analysis (Value & Volume)
- 4. Export Market Analysis (Value & Volume)
- 5. Price Trend Analysis
Legionella Testing Industry Segmentation By Geography
-
1. North America
- 1.1. United States
- 1.2. Canada
- 1.3. Mexico
-
2. Europe
- 2.1. Germany
- 2.2. United Kingdom
- 2.3. France
- 2.4. Italy
- 2.5. Spain
- 2.6. Rest of Europe
-
3. Asia Pacific
- 3.1. China
- 3.2. Japan
- 3.3. India
- 3.4. Australia
- 3.5. South Korea
- 3.6. Rest of Asia Pacific
-
4. Middle East and Africa
- 4.1. GCC
- 4.2. South Africa
- 4.3. Rest of Middle East and Africa
-
5. South America
- 5.1. Brazil
- 5.2. Argentina
- 5.3. Rest of South America
Legionella Testing Industry REPORT HIGHLIGHTS
| Aspects | Details |
|---|---|
| Study Period | 2019-2033 |
| Base Year | 2024 |
| Estimated Year | 2025 |
| Forecast Period | 2025-2033 |
| Historical Period | 2019-2024 |
| Growth Rate | CAGR of 8.17% from 2019-2033 |
| Segmentation |
|
Table of Contents
- 1. Introduction
- 1.1. Research Scope
- 1.2. Market Segmentation
- 1.3. Research Methodology
- 1.4. Definitions and Assumptions
- 2. Executive Summary
- 2.1. Introduction
- 3. Market Dynamics
- 3.1. Introduction
- 3.2. Market Drivers
- 3.2.1. Rising Incidence of Pneumonia and Legionella-related Illnesses; Increasing Demand for Rapid and Advanced Diagnostic Techniques; Technological Advancements in the Field of Bacterial Testing
- 3.3. Market Restrains
- 3.3.1. Issues in Sensitivity of Diagnostic Tests
- 3.4. Market Trends
- 3.4.1. Urinary Antigen Test (UAT) Segment is Expected to Hold a Major Market Share in the Legionella Testing Market
- 4. Market Factor Analysis
- 4.1. Porters Five Forces
- 4.2. Supply/Value Chain
- 4.3. PESTEL analysis
- 4.4. Market Entropy
- 4.5. Patent/Trademark Analysis
- 5. Global Legionella Testing Industry Analysis, Insights and Forecast, 2019-2031
- 5.1. Market Analysis, Insights and Forecast - by Production Analysis
- 5.2. Market Analysis, Insights and Forecast - by Consumption Analysis
- 5.3. Market Analysis, Insights and Forecast - by Import Market Analysis (Value & Volume)
- 5.4. Market Analysis, Insights and Forecast - by Export Market Analysis (Value & Volume)
- 5.5. Market Analysis, Insights and Forecast - by Price Trend Analysis
- 5.6. Market Analysis, Insights and Forecast - by Region
- 5.6.1. North America
- 5.6.2. Europe
- 5.6.3. Asia Pacific
- 5.6.4. Middle East and Africa
- 5.6.5. South America
- 5.1. Market Analysis, Insights and Forecast - by Production Analysis
- 6. North America Legionella Testing Industry Analysis, Insights and Forecast, 2019-2031
- 6.1. Market Analysis, Insights and Forecast - by Production Analysis
- 6.2. Market Analysis, Insights and Forecast - by Consumption Analysis
- 6.3. Market Analysis, Insights and Forecast - by Import Market Analysis (Value & Volume)
- 6.4. Market Analysis, Insights and Forecast - by Export Market Analysis (Value & Volume)
- 6.5. Market Analysis, Insights and Forecast - by Price Trend Analysis
- 6.1. Market Analysis, Insights and Forecast - by Production Analysis
- 7. Europe Legionella Testing Industry Analysis, Insights and Forecast, 2019-2031
- 7.1. Market Analysis, Insights and Forecast - by Production Analysis
- 7.2. Market Analysis, Insights and Forecast - by Consumption Analysis
- 7.3. Market Analysis, Insights and Forecast - by Import Market Analysis (Value & Volume)
- 7.4. Market Analysis, Insights and Forecast - by Export Market Analysis (Value & Volume)
- 7.5. Market Analysis, Insights and Forecast - by Price Trend Analysis
- 7.1. Market Analysis, Insights and Forecast - by Production Analysis
- 8. Asia Pacific Legionella Testing Industry Analysis, Insights and Forecast, 2019-2031
- 8.1. Market Analysis, Insights and Forecast - by Production Analysis
- 8.2. Market Analysis, Insights and Forecast - by Consumption Analysis
- 8.3. Market Analysis, Insights and Forecast - by Import Market Analysis (Value & Volume)
- 8.4. Market Analysis, Insights and Forecast - by Export Market Analysis (Value & Volume)
- 8.5. Market Analysis, Insights and Forecast - by Price Trend Analysis
- 8.1. Market Analysis, Insights and Forecast - by Production Analysis
- 9. Middle East and Africa Legionella Testing Industry Analysis, Insights and Forecast, 2019-2031
- 9.1. Market Analysis, Insights and Forecast - by Production Analysis
- 9.2. Market Analysis, Insights and Forecast - by Consumption Analysis
- 9.3. Market Analysis, Insights and Forecast - by Import Market Analysis (Value & Volume)
- 9.4. Market Analysis, Insights and Forecast - by Export Market Analysis (Value & Volume)
- 9.5. Market Analysis, Insights and Forecast - by Price Trend Analysis
- 9.1. Market Analysis, Insights and Forecast - by Production Analysis
- 10. South America Legionella Testing Industry Analysis, Insights and Forecast, 2019-2031
- 10.1. Market Analysis, Insights and Forecast - by Production Analysis
- 10.2. Market Analysis, Insights and Forecast - by Consumption Analysis
- 10.3. Market Analysis, Insights and Forecast - by Import Market Analysis (Value & Volume)
- 10.4. Market Analysis, Insights and Forecast - by Export Market Analysis (Value & Volume)
- 10.5. Market Analysis, Insights and Forecast - by Price Trend Analysis
- 10.1. Market Analysis, Insights and Forecast - by Production Analysis
- 11. North Americ Legionella Testing Industry Analysis, Insights and Forecast, 2019-2031
- 11.1. Market Analysis, Insights and Forecast - By Country/Sub-region
- 11.1.1. undefined
- 12. Europe Legionella Testing Industry Analysis, Insights and Forecast, 2019-2031
- 12.1. Market Analysis, Insights and Forecast - By Country/Sub-region
- 12.1.1. undefined
- 13. Asia Pacific Legionella Testing Industry Analysis, Insights and Forecast, 2019-2031
- 13.1. Market Analysis, Insights and Forecast - By Country/Sub-region
- 13.1.1. undefined
- 14. Middle East and Africa Legionella Testing Industry Analysis, Insights and Forecast, 2019-2031
- 14.1. Market Analysis, Insights and Forecast - By Country/Sub-region
- 14.1.1. undefined
- 15. South America Legionella Testing Industry Analysis, Insights and Forecast, 2019-2031
- 15.1. Market Analysis, Insights and Forecast - By Country/Sub-region
- 15.1.1. undefined
- 16. Competitive Analysis
- 16.1. Global Market Share Analysis 2024
- 16.2. Company Profiles
- 16.2.1 Becton Dickinson and Company
- 16.2.1.1. Overview
- 16.2.1.2. Products
- 16.2.1.3. SWOT Analysis
- 16.2.1.4. Recent Developments
- 16.2.1.5. Financials (Based on Availability)
- 16.2.2 Thermo Fisher Scientific Inc
- 16.2.2.1. Overview
- 16.2.2.2. Products
- 16.2.2.3. SWOT Analysis
- 16.2.2.4. Recent Developments
- 16.2.2.5. Financials (Based on Availability)
- 16.2.3 Albagaia Ltd
- 16.2.3.1. Overview
- 16.2.3.2. Products
- 16.2.3.3. SWOT Analysis
- 16.2.3.4. Recent Developments
- 16.2.3.5. Financials (Based on Availability)
- 16.2.4 BioMerieux SA
- 16.2.4.1. Overview
- 16.2.4.2. Products
- 16.2.4.3. SWOT Analysis
- 16.2.4.4. Recent Developments
- 16.2.4.5. Financials (Based on Availability)
- 16.2.5 Phigenics LLC
- 16.2.5.1. Overview
- 16.2.5.2. Products
- 16.2.5.3. SWOT Analysis
- 16.2.5.4. Recent Developments
- 16.2.5.5. Financials (Based on Availability)
- 16.2.6 Evoqua Water Technologies (Pacific Water Technology)
- 16.2.6.1. Overview
- 16.2.6.2. Products
- 16.2.6.3. SWOT Analysis
- 16.2.6.4. Recent Developments
- 16.2.6.5. Financials (Based on Availability)
- 16.2.7 Aquacert Ltd
- 16.2.7.1. Overview
- 16.2.7.2. Products
- 16.2.7.3. SWOT Analysis
- 16.2.7.4. Recent Developments
- 16.2.7.5. Financials (Based on Availability)
- 16.2.8 Merck KgaA
- 16.2.8.1. Overview
- 16.2.8.2. Products
- 16.2.8.3. SWOT Analysis
- 16.2.8.4. Recent Developments
- 16.2.8.5. Financials (Based on Availability)
- 16.2.9 Qiagen NV
- 16.2.9.1. Overview
- 16.2.9.2. Products
- 16.2.9.3. SWOT Analysis
- 16.2.9.4. Recent Developments
- 16.2.9.5. Financials (Based on Availability)
- 16.2.10 Danaher Corporation (Pall Corporation)
- 16.2.10.1. Overview
- 16.2.10.2. Products
- 16.2.10.3. SWOT Analysis
- 16.2.10.4. Recent Developments
- 16.2.10.5. Financials (Based on Availability)
- 16.2.1 Becton Dickinson and Company
List of Figures
- Figure 1: Global Legionella Testing Industry Revenue Breakdown (Million, %) by Region 2024 & 2032
- Figure 2: Global Legionella Testing Industry Volume Breakdown (K Unit, %) by Region 2024 & 2032
- Figure 3: North Americ Legionella Testing Industry Revenue (Million), by Country 2024 & 2032
- Figure 4: North Americ Legionella Testing Industry Volume (K Unit), by Country 2024 & 2032
- Figure 5: North Americ Legionella Testing Industry Revenue Share (%), by Country 2024 & 2032
- Figure 6: North Americ Legionella Testing Industry Volume Share (%), by Country 2024 & 2032
- Figure 7: Europe Legionella Testing Industry Revenue (Million), by Country 2024 & 2032
- Figure 8: Europe Legionella Testing Industry Volume (K Unit), by Country 2024 & 2032
- Figure 9: Europe Legionella Testing Industry Revenue Share (%), by Country 2024 & 2032
- Figure 10: Europe Legionella Testing Industry Volume Share (%), by Country 2024 & 2032
- Figure 11: Asia Pacific Legionella Testing Industry Revenue (Million), by Country 2024 & 2032
- Figure 12: Asia Pacific Legionella Testing Industry Volume (K Unit), by Country 2024 & 2032
- Figure 13: Asia Pacific Legionella Testing Industry Revenue Share (%), by Country 2024 & 2032
- Figure 14: Asia Pacific Legionella Testing Industry Volume Share (%), by Country 2024 & 2032
- Figure 15: Middle East and Africa Legionella Testing Industry Revenue (Million), by Country 2024 & 2032
- Figure 16: Middle East and Africa Legionella Testing Industry Volume (K Unit), by Country 2024 & 2032
- Figure 17: Middle East and Africa Legionella Testing Industry Revenue Share (%), by Country 2024 & 2032
- Figure 18: Middle East and Africa Legionella Testing Industry Volume Share (%), by Country 2024 & 2032
- Figure 19: South America Legionella Testing Industry Revenue (Million), by Country 2024 & 2032
- Figure 20: South America Legionella Testing Industry Volume (K Unit), by Country 2024 & 2032
- Figure 21: South America Legionella Testing Industry Revenue Share (%), by Country 2024 & 2032
- Figure 22: South America Legionella Testing Industry Volume Share (%), by Country 2024 & 2032
- Figure 23: North America Legionella Testing Industry Revenue (Million), by Production Analysis 2024 & 2032
- Figure 24: North America Legionella Testing Industry Volume (K Unit), by Production Analysis 2024 & 2032
- Figure 25: North America Legionella Testing Industry Revenue Share (%), by Production Analysis 2024 & 2032
- Figure 26: North America Legionella Testing Industry Volume Share (%), by Production Analysis 2024 & 2032
- Figure 27: North America Legionella Testing Industry Revenue (Million), by Consumption Analysis 2024 & 2032
- Figure 28: North America Legionella Testing Industry Volume (K Unit), by Consumption Analysis 2024 & 2032
- Figure 29: North America Legionella Testing Industry Revenue Share (%), by Consumption Analysis 2024 & 2032
- Figure 30: North America Legionella Testing Industry Volume Share (%), by Consumption Analysis 2024 & 2032
- Figure 31: North America Legionella Testing Industry Revenue (Million), by Import Market Analysis (Value & Volume) 2024 & 2032
- Figure 32: North America Legionella Testing Industry Volume (K Unit), by Import Market Analysis (Value & Volume) 2024 & 2032
- Figure 33: North America Legionella Testing Industry Revenue Share (%), by Import Market Analysis (Value & Volume) 2024 & 2032
- Figure 34: North America Legionella Testing Industry Volume Share (%), by Import Market Analysis (Value & Volume) 2024 & 2032
- Figure 35: North America Legionella Testing Industry Revenue (Million), by Export Market Analysis (Value & Volume) 2024 & 2032
- Figure 36: North America Legionella Testing Industry Volume (K Unit), by Export Market Analysis (Value & Volume) 2024 & 2032
- Figure 37: North America Legionella Testing Industry Revenue Share (%), by Export Market Analysis (Value & Volume) 2024 & 2032
- Figure 38: North America Legionella Testing Industry Volume Share (%), by Export Market Analysis (Value & Volume) 2024 & 2032
- Figure 39: North America Legionella Testing Industry Revenue (Million), by Price Trend Analysis 2024 & 2032
- Figure 40: North America Legionella Testing Industry Volume (K Unit), by Price Trend Analysis 2024 & 2032
- Figure 41: North America Legionella Testing Industry Revenue Share (%), by Price Trend Analysis 2024 & 2032
- Figure 42: North America Legionella Testing Industry Volume Share (%), by Price Trend Analysis 2024 & 2032
- Figure 43: North America Legionella Testing Industry Revenue (Million), by Country 2024 & 2032
- Figure 44: North America Legionella Testing Industry Volume (K Unit), by Country 2024 & 2032
- Figure 45: North America Legionella Testing Industry Revenue Share (%), by Country 2024 & 2032
- Figure 46: North America Legionella Testing Industry Volume Share (%), by Country 2024 & 2032
- Figure 47: Europe Legionella Testing Industry Revenue (Million), by Production Analysis 2024 & 2032
- Figure 48: Europe Legionella Testing Industry Volume (K Unit), by Production Analysis 2024 & 2032
- Figure 49: Europe Legionella Testing Industry Revenue Share (%), by Production Analysis 2024 & 2032
- Figure 50: Europe Legionella Testing Industry Volume Share (%), by Production Analysis 2024 & 2032
- Figure 51: Europe Legionella Testing Industry Revenue (Million), by Consumption Analysis 2024 & 2032
- Figure 52: Europe Legionella Testing Industry Volume (K Unit), by Consumption Analysis 2024 & 2032
- Figure 53: Europe Legionella Testing Industry Revenue Share (%), by Consumption Analysis 2024 & 2032
- Figure 54: Europe Legionella Testing Industry Volume Share (%), by Consumption Analysis 2024 & 2032
- Figure 55: Europe Legionella Testing Industry Revenue (Million), by Import Market Analysis (Value & Volume) 2024 & 2032
- Figure 56: Europe Legionella Testing Industry Volume (K Unit), by Import Market Analysis (Value & Volume) 2024 & 2032
- Figure 57: Europe Legionella Testing Industry Revenue Share (%), by Import Market Analysis (Value & Volume) 2024 & 2032
- Figure 58: Europe Legionella Testing Industry Volume Share (%), by Import Market Analysis (Value & Volume) 2024 & 2032
- Figure 59: Europe Legionella Testing Industry Revenue (Million), by Export Market Analysis (Value & Volume) 2024 & 2032
- Figure 60: Europe Legionella Testing Industry Volume (K Unit), by Export Market Analysis (Value & Volume) 2024 & 2032
- Figure 61: Europe Legionella Testing Industry Revenue Share (%), by Export Market Analysis (Value & Volume) 2024 & 2032
- Figure 62: Europe Legionella Testing Industry Volume Share (%), by Export Market Analysis (Value & Volume) 2024 & 2032
- Figure 63: Europe Legionella Testing Industry Revenue (Million), by Price Trend Analysis 2024 & 2032
- Figure 64: Europe Legionella Testing Industry Volume (K Unit), by Price Trend Analysis 2024 & 2032
- Figure 65: Europe Legionella Testing Industry Revenue Share (%), by Price Trend Analysis 2024 & 2032
- Figure 66: Europe Legionella Testing Industry Volume Share (%), by Price Trend Analysis 2024 & 2032
- Figure 67: Europe Legionella Testing Industry Revenue (Million), by Country 2024 & 2032
- Figure 68: Europe Legionella Testing Industry Volume (K Unit), by Country 2024 & 2032
- Figure 69: Europe Legionella Testing Industry Revenue Share (%), by Country 2024 & 2032
- Figure 70: Europe Legionella Testing Industry Volume Share (%), by Country 2024 & 2032
- Figure 71: Asia Pacific Legionella Testing Industry Revenue (Million), by Production Analysis 2024 & 2032
- Figure 72: Asia Pacific Legionella Testing Industry Volume (K Unit), by Production Analysis 2024 & 2032
- Figure 73: Asia Pacific Legionella Testing Industry Revenue Share (%), by Production Analysis 2024 & 2032
- Figure 74: Asia Pacific Legionella Testing Industry Volume Share (%), by Production Analysis 2024 & 2032
- Figure 75: Asia Pacific Legionella Testing Industry Revenue (Million), by Consumption Analysis 2024 & 2032
- Figure 76: Asia Pacific Legionella Testing Industry Volume (K Unit), by Consumption Analysis 2024 & 2032
- Figure 77: Asia Pacific Legionella Testing Industry Revenue Share (%), by Consumption Analysis 2024 & 2032
- Figure 78: Asia Pacific Legionella Testing Industry Volume Share (%), by Consumption Analysis 2024 & 2032
- Figure 79: Asia Pacific Legionella Testing Industry Revenue (Million), by Import Market Analysis (Value & Volume) 2024 & 2032
- Figure 80: Asia Pacific Legionella Testing Industry Volume (K Unit), by Import Market Analysis (Value & Volume) 2024 & 2032
- Figure 81: Asia Pacific Legionella Testing Industry Revenue Share (%), by Import Market Analysis (Value & Volume) 2024 & 2032
- Figure 82: Asia Pacific Legionella Testing Industry Volume Share (%), by Import Market Analysis (Value & Volume) 2024 & 2032
- Figure 83: Asia Pacific Legionella Testing Industry Revenue (Million), by Export Market Analysis (Value & Volume) 2024 & 2032
- Figure 84: Asia Pacific Legionella Testing Industry Volume (K Unit), by Export Market Analysis (Value & Volume) 2024 & 2032
- Figure 85: Asia Pacific Legionella Testing Industry Revenue Share (%), by Export Market Analysis (Value & Volume) 2024 & 2032
- Figure 86: Asia Pacific Legionella Testing Industry Volume Share (%), by Export Market Analysis (Value & Volume) 2024 & 2032
- Figure 87: Asia Pacific Legionella Testing Industry Revenue (Million), by Price Trend Analysis 2024 & 2032
- Figure 88: Asia Pacific Legionella Testing Industry Volume (K Unit), by Price Trend Analysis 2024 & 2032
- Figure 89: Asia Pacific Legionella Testing Industry Revenue Share (%), by Price Trend Analysis 2024 & 2032
- Figure 90: Asia Pacific Legionella Testing Industry Volume Share (%), by Price Trend Analysis 2024 & 2032
- Figure 91: Asia Pacific Legionella Testing Industry Revenue (Million), by Country 2024 & 2032
- Figure 92: Asia Pacific Legionella Testing Industry Volume (K Unit), by Country 2024 & 2032
- Figure 93: Asia Pacific Legionella Testing Industry Revenue Share (%), by Country 2024 & 2032
- Figure 94: Asia Pacific Legionella Testing Industry Volume Share (%), by Country 2024 & 2032
- Figure 95: Middle East and Africa Legionella Testing Industry Revenue (Million), by Production Analysis 2024 & 2032
- Figure 96: Middle East and Africa Legionella Testing Industry Volume (K Unit), by Production Analysis 2024 & 2032
- Figure 97: Middle East and Africa Legionella Testing Industry Revenue Share (%), by Production Analysis 2024 & 2032
- Figure 98: Middle East and Africa Legionella Testing Industry Volume Share (%), by Production Analysis 2024 & 2032
- Figure 99: Middle East and Africa Legionella Testing Industry Revenue (Million), by Consumption Analysis 2024 & 2032
- Figure 100: Middle East and Africa Legionella Testing Industry Volume (K Unit), by Consumption Analysis 2024 & 2032
- Figure 101: Middle East and Africa Legionella Testing Industry Revenue Share (%), by Consumption Analysis 2024 & 2032
- Figure 102: Middle East and Africa Legionella Testing Industry Volume Share (%), by Consumption Analysis 2024 & 2032
- Figure 103: Middle East and Africa Legionella Testing Industry Revenue (Million), by Import Market Analysis (Value & Volume) 2024 & 2032
- Figure 104: Middle East and Africa Legionella Testing Industry Volume (K Unit), by Import Market Analysis (Value & Volume) 2024 & 2032
- Figure 105: Middle East and Africa Legionella Testing Industry Revenue Share (%), by Import Market Analysis (Value & Volume) 2024 & 2032
- Figure 106: Middle East and Africa Legionella Testing Industry Volume Share (%), by Import Market Analysis (Value & Volume) 2024 & 2032
- Figure 107: Middle East and Africa Legionella Testing Industry Revenue (Million), by Export Market Analysis (Value & Volume) 2024 & 2032
- Figure 108: Middle East and Africa Legionella Testing Industry Volume (K Unit), by Export Market Analysis (Value & Volume) 2024 & 2032
- Figure 109: Middle East and Africa Legionella Testing Industry Revenue Share (%), by Export Market Analysis (Value & Volume) 2024 & 2032
- Figure 110: Middle East and Africa Legionella Testing Industry Volume Share (%), by Export Market Analysis (Value & Volume) 2024 & 2032
- Figure 111: Middle East and Africa Legionella Testing Industry Revenue (Million), by Price Trend Analysis 2024 & 2032
- Figure 112: Middle East and Africa Legionella Testing Industry Volume (K Unit), by Price Trend Analysis 2024 & 2032
- Figure 113: Middle East and Africa Legionella Testing Industry Revenue Share (%), by Price Trend Analysis 2024 & 2032
- Figure 114: Middle East and Africa Legionella Testing Industry Volume Share (%), by Price Trend Analysis 2024 & 2032
- Figure 115: Middle East and Africa Legionella Testing Industry Revenue (Million), by Country 2024 & 2032
- Figure 116: Middle East and Africa Legionella Testing Industry Volume (K Unit), by Country 2024 & 2032
- Figure 117: Middle East and Africa Legionella Testing Industry Revenue Share (%), by Country 2024 & 2032
- Figure 118: Middle East and Africa Legionella Testing Industry Volume Share (%), by Country 2024 & 2032
- Figure 119: South America Legionella Testing Industry Revenue (Million), by Production Analysis 2024 & 2032
- Figure 120: South America Legionella Testing Industry Volume (K Unit), by Production Analysis 2024 & 2032
- Figure 121: South America Legionella Testing Industry Revenue Share (%), by Production Analysis 2024 & 2032
- Figure 122: South America Legionella Testing Industry Volume Share (%), by Production Analysis 2024 & 2032
- Figure 123: South America Legionella Testing Industry Revenue (Million), by Consumption Analysis 2024 & 2032
- Figure 124: South America Legionella Testing Industry Volume (K Unit), by Consumption Analysis 2024 & 2032
- Figure 125: South America Legionella Testing Industry Revenue Share (%), by Consumption Analysis 2024 & 2032
- Figure 126: South America Legionella Testing Industry Volume Share (%), by Consumption Analysis 2024 & 2032
- Figure 127: South America Legionella Testing Industry Revenue (Million), by Import Market Analysis (Value & Volume) 2024 & 2032
- Figure 128: South America Legionella Testing Industry Volume (K Unit), by Import Market Analysis (Value & Volume) 2024 & 2032
- Figure 129: South America Legionella Testing Industry Revenue Share (%), by Import Market Analysis (Value & Volume) 2024 & 2032
- Figure 130: South America Legionella Testing Industry Volume Share (%), by Import Market Analysis (Value & Volume) 2024 & 2032
- Figure 131: South America Legionella Testing Industry Revenue (Million), by Export Market Analysis (Value & Volume) 2024 & 2032
- Figure 132: South America Legionella Testing Industry Volume (K Unit), by Export Market Analysis (Value & Volume) 2024 & 2032
- Figure 133: South America Legionella Testing Industry Revenue Share (%), by Export Market Analysis (Value & Volume) 2024 & 2032
- Figure 134: South America Legionella Testing Industry Volume Share (%), by Export Market Analysis (Value & Volume) 2024 & 2032
- Figure 135: South America Legionella Testing Industry Revenue (Million), by Price Trend Analysis 2024 & 2032
- Figure 136: South America Legionella Testing Industry Volume (K Unit), by Price Trend Analysis 2024 & 2032
- Figure 137: South America Legionella Testing Industry Revenue Share (%), by Price Trend Analysis 2024 & 2032
- Figure 138: South America Legionella Testing Industry Volume Share (%), by Price Trend Analysis 2024 & 2032
- Figure 139: South America Legionella Testing Industry Revenue (Million), by Country 2024 & 2032
- Figure 140: South America Legionella Testing Industry Volume (K Unit), by Country 2024 & 2032
- Figure 141: South America Legionella Testing Industry Revenue Share (%), by Country 2024 & 2032
- Figure 142: South America Legionella Testing Industry Volume Share (%), by Country 2024 & 2032
List of Tables
- Table 1: Global Legionella Testing Industry Revenue Million Forecast, by Region 2019 & 2032
- Table 2: Global Legionella Testing Industry Volume K Unit Forecast, by Region 2019 & 2032
- Table 3: Global Legionella Testing Industry Revenue Million Forecast, by Production Analysis 2019 & 2032
- Table 4: Global Legionella Testing Industry Volume K Unit Forecast, by Production Analysis 2019 & 2032
- Table 5: Global Legionella Testing Industry Revenue Million Forecast, by Consumption Analysis 2019 & 2032
- Table 6: Global Legionella Testing Industry Volume K Unit Forecast, by Consumption Analysis 2019 & 2032
- Table 7: Global Legionella Testing Industry Revenue Million Forecast, by Import Market Analysis (Value & Volume) 2019 & 2032
- Table 8: Global Legionella Testing Industry Volume K Unit Forecast, by Import Market Analysis (Value & Volume) 2019 & 2032
- Table 9: Global Legionella Testing Industry Revenue Million Forecast, by Export Market Analysis (Value & Volume) 2019 & 2032
- Table 10: Global Legionella Testing Industry Volume K Unit Forecast, by Export Market Analysis (Value & Volume) 2019 & 2032
- Table 11: Global Legionella Testing Industry Revenue Million Forecast, by Price Trend Analysis 2019 & 2032
- Table 12: Global Legionella Testing Industry Volume K Unit Forecast, by Price Trend Analysis 2019 & 2032
- Table 13: Global Legionella Testing Industry Revenue Million Forecast, by Region 2019 & 2032
- Table 14: Global Legionella Testing Industry Volume K Unit Forecast, by Region 2019 & 2032
- Table 15: Global Legionella Testing Industry Revenue Million Forecast, by Country 2019 & 2032
- Table 16: Global Legionella Testing Industry Volume K Unit Forecast, by Country 2019 & 2032
- Table 17: Global Legionella Testing Industry Revenue Million Forecast, by Country 2019 & 2032
- Table 18: Global Legionella Testing Industry Volume K Unit Forecast, by Country 2019 & 2032
- Table 19: Global Legionella Testing Industry Revenue Million Forecast, by Country 2019 & 2032
- Table 20: Global Legionella Testing Industry Volume K Unit Forecast, by Country 2019 & 2032
- Table 21: Global Legionella Testing Industry Revenue Million Forecast, by Country 2019 & 2032
- Table 22: Global Legionella Testing Industry Volume K Unit Forecast, by Country 2019 & 2032
- Table 23: Global Legionella Testing Industry Revenue Million Forecast, by Country 2019 & 2032
- Table 24: Global Legionella Testing Industry Volume K Unit Forecast, by Country 2019 & 2032
- Table 25: Global Legionella Testing Industry Revenue Million Forecast, by Production Analysis 2019 & 2032
- Table 26: Global Legionella Testing Industry Volume K Unit Forecast, by Production Analysis 2019 & 2032
- Table 27: Global Legionella Testing Industry Revenue Million Forecast, by Consumption Analysis 2019 & 2032
- Table 28: Global Legionella Testing Industry Volume K Unit Forecast, by Consumption Analysis 2019 & 2032
- Table 29: Global Legionella Testing Industry Revenue Million Forecast, by Import Market Analysis (Value & Volume) 2019 & 2032
- Table 30: Global Legionella Testing Industry Volume K Unit Forecast, by Import Market Analysis (Value & Volume) 2019 & 2032
- Table 31: Global Legionella Testing Industry Revenue Million Forecast, by Export Market Analysis (Value & Volume) 2019 & 2032
- Table 32: Global Legionella Testing Industry Volume K Unit Forecast, by Export Market Analysis (Value & Volume) 2019 & 2032
- Table 33: Global Legionella Testing Industry Revenue Million Forecast, by Price Trend Analysis 2019 & 2032
- Table 34: Global Legionella Testing Industry Volume K Unit Forecast, by Price Trend Analysis 2019 & 2032
- Table 35: Global Legionella Testing Industry Revenue Million Forecast, by Country 2019 & 2032
- Table 36: Global Legionella Testing Industry Volume K Unit Forecast, by Country 2019 & 2032
- Table 37: United States Legionella Testing Industry Revenue (Million) Forecast, by Application 2019 & 2032
- Table 38: United States Legionella Testing Industry Volume (K Unit) Forecast, by Application 2019 & 2032
- Table 39: Canada Legionella Testing Industry Revenue (Million) Forecast, by Application 2019 & 2032
- Table 40: Canada Legionella Testing Industry Volume (K Unit) Forecast, by Application 2019 & 2032
- Table 41: Mexico Legionella Testing Industry Revenue (Million) Forecast, by Application 2019 & 2032
- Table 42: Mexico Legionella Testing Industry Volume (K Unit) Forecast, by Application 2019 & 2032
- Table 43: Global Legionella Testing Industry Revenue Million Forecast, by Production Analysis 2019 & 2032
- Table 44: Global Legionella Testing Industry Volume K Unit Forecast, by Production Analysis 2019 & 2032
- Table 45: Global Legionella Testing Industry Revenue Million Forecast, by Consumption Analysis 2019 & 2032
- Table 46: Global Legionella Testing Industry Volume K Unit Forecast, by Consumption Analysis 2019 & 2032
- Table 47: Global Legionella Testing Industry Revenue Million Forecast, by Import Market Analysis (Value & Volume) 2019 & 2032
- Table 48: Global Legionella Testing Industry Volume K Unit Forecast, by Import Market Analysis (Value & Volume) 2019 & 2032
- Table 49: Global Legionella Testing Industry Revenue Million Forecast, by Export Market Analysis (Value & Volume) 2019 & 2032
- Table 50: Global Legionella Testing Industry Volume K Unit Forecast, by Export Market Analysis (Value & Volume) 2019 & 2032
- Table 51: Global Legionella Testing Industry Revenue Million Forecast, by Price Trend Analysis 2019 & 2032
- Table 52: Global Legionella Testing Industry Volume K Unit Forecast, by Price Trend Analysis 2019 & 2032
- Table 53: Global Legionella Testing Industry Revenue Million Forecast, by Country 2019 & 2032
- Table 54: Global Legionella Testing Industry Volume K Unit Forecast, by Country 2019 & 2032
- Table 55: Germany Legionella Testing Industry Revenue (Million) Forecast, by Application 2019 & 2032
- Table 56: Germany Legionella Testing Industry Volume (K Unit) Forecast, by Application 2019 & 2032
- Table 57: United Kingdom Legionella Testing Industry Revenue (Million) Forecast, by Application 2019 & 2032
- Table 58: United Kingdom Legionella Testing Industry Volume (K Unit) Forecast, by Application 2019 & 2032
- Table 59: France Legionella Testing Industry Revenue (Million) Forecast, by Application 2019 & 2032
- Table 60: France Legionella Testing Industry Volume (K Unit) Forecast, by Application 2019 & 2032
- Table 61: Italy Legionella Testing Industry Revenue (Million) Forecast, by Application 2019 & 2032
- Table 62: Italy Legionella Testing Industry Volume (K Unit) Forecast, by Application 2019 & 2032
- Table 63: Spain Legionella Testing Industry Revenue (Million) Forecast, by Application 2019 & 2032
- Table 64: Spain Legionella Testing Industry Volume (K Unit) Forecast, by Application 2019 & 2032
- Table 65: Rest of Europe Legionella Testing Industry Revenue (Million) Forecast, by Application 2019 & 2032
- Table 66: Rest of Europe Legionella Testing Industry Volume (K Unit) Forecast, by Application 2019 & 2032
- Table 67: Global Legionella Testing Industry Revenue Million Forecast, by Production Analysis 2019 & 2032
- Table 68: Global Legionella Testing Industry Volume K Unit Forecast, by Production Analysis 2019 & 2032
- Table 69: Global Legionella Testing Industry Revenue Million Forecast, by Consumption Analysis 2019 & 2032
- Table 70: Global Legionella Testing Industry Volume K Unit Forecast, by Consumption Analysis 2019 & 2032
- Table 71: Global Legionella Testing Industry Revenue Million Forecast, by Import Market Analysis (Value & Volume) 2019 & 2032
- Table 72: Global Legionella Testing Industry Volume K Unit Forecast, by Import Market Analysis (Value & Volume) 2019 & 2032
- Table 73: Global Legionella Testing Industry Revenue Million Forecast, by Export Market Analysis (Value & Volume) 2019 & 2032
- Table 74: Global Legionella Testing Industry Volume K Unit Forecast, by Export Market Analysis (Value & Volume) 2019 & 2032
- Table 75: Global Legionella Testing Industry Revenue Million Forecast, by Price Trend Analysis 2019 & 2032
- Table 76: Global Legionella Testing Industry Volume K Unit Forecast, by Price Trend Analysis 2019 & 2032
- Table 77: Global Legionella Testing Industry Revenue Million Forecast, by Country 2019 & 2032
- Table 78: Global Legionella Testing Industry Volume K Unit Forecast, by Country 2019 & 2032
- Table 79: China Legionella Testing Industry Revenue (Million) Forecast, by Application 2019 & 2032
- Table 80: China Legionella Testing Industry Volume (K Unit) Forecast, by Application 2019 & 2032
- Table 81: Japan Legionella Testing Industry Revenue (Million) Forecast, by Application 2019 & 2032
- Table 82: Japan Legionella Testing Industry Volume (K Unit) Forecast, by Application 2019 & 2032
- Table 83: India Legionella Testing Industry Revenue (Million) Forecast, by Application 2019 & 2032
- Table 84: India Legionella Testing Industry Volume (K Unit) Forecast, by Application 2019 & 2032
- Table 85: Australia Legionella Testing Industry Revenue (Million) Forecast, by Application 2019 & 2032
- Table 86: Australia Legionella Testing Industry Volume (K Unit) Forecast, by Application 2019 & 2032
- Table 87: South Korea Legionella Testing Industry Revenue (Million) Forecast, by Application 2019 & 2032
- Table 88: South Korea Legionella Testing Industry Volume (K Unit) Forecast, by Application 2019 & 2032
- Table 89: Rest of Asia Pacific Legionella Testing Industry Revenue (Million) Forecast, by Application 2019 & 2032
- Table 90: Rest of Asia Pacific Legionella Testing Industry Volume (K Unit) Forecast, by Application 2019 & 2032
- Table 91: Global Legionella Testing Industry Revenue Million Forecast, by Production Analysis 2019 & 2032
- Table 92: Global Legionella Testing Industry Volume K Unit Forecast, by Production Analysis 2019 & 2032
- Table 93: Global Legionella Testing Industry Revenue Million Forecast, by Consumption Analysis 2019 & 2032
- Table 94: Global Legionella Testing Industry Volume K Unit Forecast, by Consumption Analysis 2019 & 2032
- Table 95: Global Legionella Testing Industry Revenue Million Forecast, by Import Market Analysis (Value & Volume) 2019 & 2032
- Table 96: Global Legionella Testing Industry Volume K Unit Forecast, by Import Market Analysis (Value & Volume) 2019 & 2032
- Table 97: Global Legionella Testing Industry Revenue Million Forecast, by Export Market Analysis (Value & Volume) 2019 & 2032
- Table 98: Global Legionella Testing Industry Volume K Unit Forecast, by Export Market Analysis (Value & Volume) 2019 & 2032
- Table 99: Global Legionella Testing Industry Revenue Million Forecast, by Price Trend Analysis 2019 & 2032
- Table 100: Global Legionella Testing Industry Volume K Unit Forecast, by Price Trend Analysis 2019 & 2032
- Table 101: Global Legionella Testing Industry Revenue Million Forecast, by Country 2019 & 2032
- Table 102: Global Legionella Testing Industry Volume K Unit Forecast, by Country 2019 & 2032
- Table 103: GCC Legionella Testing Industry Revenue (Million) Forecast, by Application 2019 & 2032
- Table 104: GCC Legionella Testing Industry Volume (K Unit) Forecast, by Application 2019 & 2032
- Table 105: South Africa Legionella Testing Industry Revenue (Million) Forecast, by Application 2019 & 2032
- Table 106: South Africa Legionella Testing Industry Volume (K Unit) Forecast, by Application 2019 & 2032
- Table 107: Rest of Middle East and Africa Legionella Testing Industry Revenue (Million) Forecast, by Application 2019 & 2032
- Table 108: Rest of Middle East and Africa Legionella Testing Industry Volume (K Unit) Forecast, by Application 2019 & 2032
- Table 109: Global Legionella Testing Industry Revenue Million Forecast, by Production Analysis 2019 & 2032
- Table 110: Global Legionella Testing Industry Volume K Unit Forecast, by Production Analysis 2019 & 2032
- Table 111: Global Legionella Testing Industry Revenue Million Forecast, by Consumption Analysis 2019 & 2032
- Table 112: Global Legionella Testing Industry Volume K Unit Forecast, by Consumption Analysis 2019 & 2032
- Table 113: Global Legionella Testing Industry Revenue Million Forecast, by Import Market Analysis (Value & Volume) 2019 & 2032
- Table 114: Global Legionella Testing Industry Volume K Unit Forecast, by Import Market Analysis (Value & Volume) 2019 & 2032
- Table 115: Global Legionella Testing Industry Revenue Million Forecast, by Export Market Analysis (Value & Volume) 2019 & 2032
- Table 116: Global Legionella Testing Industry Volume K Unit Forecast, by Export Market Analysis (Value & Volume) 2019 & 2032
- Table 117: Global Legionella Testing Industry Revenue Million Forecast, by Price Trend Analysis 2019 & 2032
- Table 118: Global Legionella Testing Industry Volume K Unit Forecast, by Price Trend Analysis 2019 & 2032
- Table 119: Global Legionella Testing Industry Revenue Million Forecast, by Country 2019 & 2032
- Table 120: Global Legionella Testing Industry Volume K Unit Forecast, by Country 2019 & 2032
- Table 121: Brazil Legionella Testing Industry Revenue (Million) Forecast, by Application 2019 & 2032
- Table 122: Brazil Legionella Testing Industry Volume (K Unit) Forecast, by Application 2019 & 2032
- Table 123: Argentina Legionella Testing Industry Revenue (Million) Forecast, by Application 2019 & 2032
- Table 124: Argentina Legionella Testing Industry Volume (K Unit) Forecast, by Application 2019 & 2032
- Table 125: Rest of South America Legionella Testing Industry Revenue (Million) Forecast, by Application 2019 & 2032
- Table 126: Rest of South America Legionella Testing Industry Volume (K Unit) Forecast, by Application 2019 & 2032
Frequently Asked Questions
1. What is the projected Compound Annual Growth Rate (CAGR) of the Legionella Testing Industry?
The projected CAGR is approximately 8.17%.
2. Which companies are prominent players in the Legionella Testing Industry?
Key companies in the market include Becton Dickinson and Company, Thermo Fisher Scientific Inc , Albagaia Ltd, BioMerieux SA, Phigenics LLC, Evoqua Water Technologies (Pacific Water Technology), Aquacert Ltd, Merck KgaA, Qiagen NV, Danaher Corporation (Pall Corporation).
3. What are the main segments of the Legionella Testing Industry?
The market segments include Production Analysis, Consumption Analysis, Import Market Analysis (Value & Volume), Export Market Analysis (Value & Volume), Price Trend Analysis.
4. Can you provide details about the market size?
The market size is estimated to be USD 349.01 Million as of 2022.
5. What are some drivers contributing to market growth?
Rising Incidence of Pneumonia and Legionella-related Illnesses; Increasing Demand for Rapid and Advanced Diagnostic Techniques; Technological Advancements in the Field of Bacterial Testing.
6. What are the notable trends driving market growth?
Urinary Antigen Test (UAT) Segment is Expected to Hold a Major Market Share in the Legionella Testing Market.
7. Are there any restraints impacting market growth?
Issues in Sensitivity of Diagnostic Tests.
8. Can you provide examples of recent developments in the market?
In May 2022, ChemREADY, manufacturer of water and wastewater treatment chemicals, announced the debut of its new Legionella testing services and product line to battle the water-borne infection in building water systems.
9. What pricing options are available for accessing the report?
Pricing options include single-user, multi-user, and enterprise licenses priced at USD 4750, USD 5250, and USD 8750 respectively.
10. Is the market size provided in terms of value or volume?
The market size is provided in terms of value, measured in Million and volume, measured in K Unit.
11. Are there any specific market keywords associated with the report?
Yes, the market keyword associated with the report is "Legionella Testing Industry," which aids in identifying and referencing the specific market segment covered.
12. How do I determine which pricing option suits my needs best?
The pricing options vary based on user requirements and access needs. Individual users may opt for single-user licenses, while businesses requiring broader access may choose multi-user or enterprise licenses for cost-effective access to the report.
13. Are there any additional resources or data provided in the Legionella Testing Industry report?
While the report offers comprehensive insights, it's advisable to review the specific contents or supplementary materials provided to ascertain if additional resources or data are available.
14. How can I stay updated on further developments or reports in the Legionella Testing Industry?
To stay informed about further developments, trends, and reports in the Legionella Testing Industry, consider subscribing to industry newsletters, following relevant companies and organizations, or regularly checking reputable industry news sources and publications.
Methodology
Step 1 - Identification of Relevant Samples Size from Population Database


Step 2 - Approaches for Defining Global Market Size (Value, Volume* & Price*)

Note*: In applicable scenarios
Step 3 - Data Sources
Primary Research
- Web Analytics
- Survey Reports
- Research Institute
- Latest Research Reports
- Opinion Leaders
Secondary Research
- Annual Reports
- White Paper
- Latest Press Release
- Industry Association
- Paid Database
- Investor Presentations

Step 4 - Data Triangulation
Involves using different sources of information in order to increase the validity of a study
These sources are likely to be stakeholders in a program - participants, other researchers, program staff, other community members, and so on.
Then we put all data in single framework & apply various statistical tools to find out the dynamic on the market.
During the analysis stage, feedback from the stakeholder groups would be compared to determine areas of agreement as well as areas of divergence


