
Key Insights
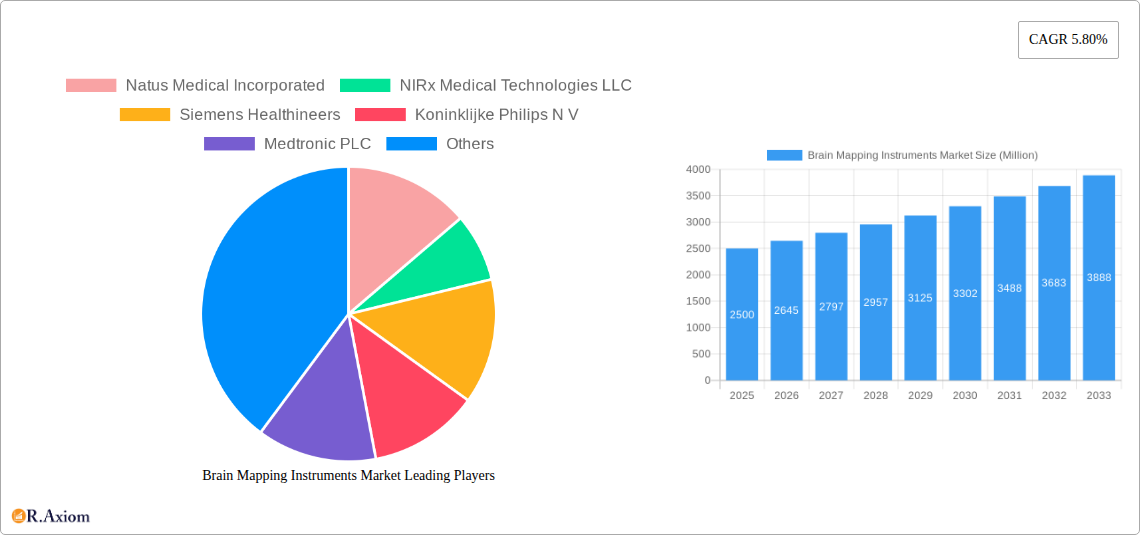
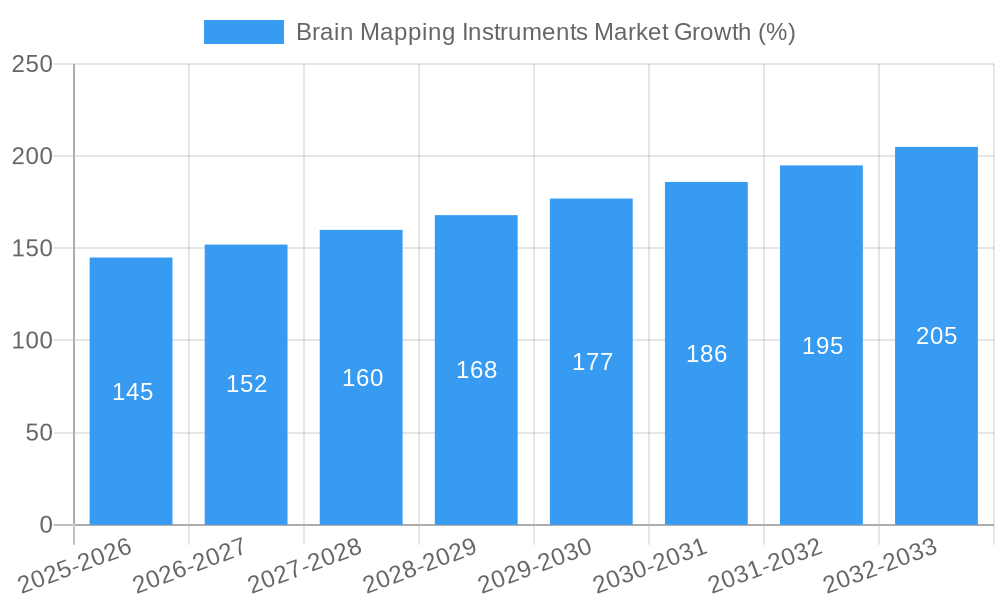
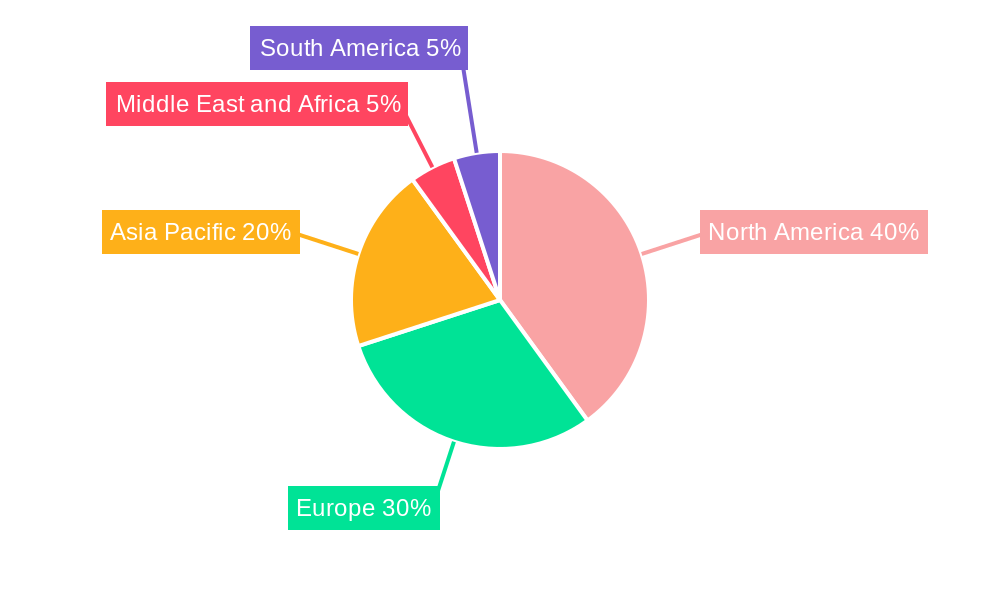
The global brain mapping instruments market is experiencing robust growth, driven by the increasing prevalence of neurological disorders, advancements in neuroimaging technologies, and rising research and development activities in neuroscience. The market, estimated at XX million in 2025, is projected to expand at a compound annual growth rate (CAGR) of 5.80% from 2025 to 2033. This growth is fueled by several factors. The aging global population is leading to a surge in neurodegenerative diseases like Alzheimer's and Parkinson's, increasing the demand for accurate diagnostic tools. Technological advancements, such as the development of more portable and user-friendly EEG and fNIRS systems, are making brain mapping more accessible and affordable, expanding market penetration beyond specialized research facilities to clinical settings. Furthermore, the rising adoption of brain-computer interfaces (BCIs) and the growing interest in personalized medicine are also contributing to market expansion. While regulatory hurdles and high costs associated with advanced imaging techniques like fMRI pose certain restraints, the overall market outlook remains positive. The market is segmented by product type (Computed Axial Tomography (CAT), Position Emission Tomography (PET), Electroencephalography (EEG), Functional Near-Infrared Spectroscopy (fNIRS), Functional Magnetic Resonance Imaging (fMRI), and other products) and end-user (hospitals, diagnostic centers, and other end-users). North America currently holds a significant market share, owing to the presence of advanced healthcare infrastructure and a strong research base, but regions like Asia-Pacific are expected to witness significant growth in the coming years due to rising healthcare spending and increasing awareness of neurological disorders. The competitive landscape is characterized by a mix of established players like Siemens Healthineers and Philips and smaller innovative companies focusing on niche technologies, driving innovation and competition in the market.
The segment analysis reveals that EEG and fNIRS are gaining significant traction due to their relative affordability and portability compared to fMRI and PET. Hospitals are the largest end-users, reflecting the importance of accurate brain mapping in diagnosis and treatment planning. However, the increasing demand for remote patient monitoring and point-of-care diagnostics is expected to drive growth in the "other end-users" segment, encompassing ambulatory care settings and home healthcare. The geographic analysis indicates that while North America and Europe currently dominate, Asia-Pacific is poised for substantial growth driven by increasing healthcare investment, particularly in countries like China and India. This growth will be further propelled by collaborations between international companies and local players, fostering technology transfer and market expansion. Strategic partnerships, acquisitions, and continuous innovation will shape the competitive landscape in the coming years.
Brain Mapping Instruments Market: A Comprehensive Report (2019-2033)
This in-depth report provides a comprehensive analysis of the Brain Mapping Instruments market, covering market size, growth projections, segmentation, key players, and future trends. The study period spans from 2019 to 2033, with 2025 as the base and estimated year. The report utilizes data from the historical period (2019-2024) to forecast market dynamics from 2025 to 2033. This report is crucial for industry stakeholders seeking actionable insights to navigate the evolving landscape of brain mapping technologies.
Brain Mapping Instruments Market Concentration & Innovation
The Brain Mapping Instruments market exhibits a moderately concentrated landscape, with key players holding significant market share. However, the emergence of innovative technologies and smaller, specialized companies is fostering increased competition. The market share held by the top five players is estimated at xx%, indicating room for both expansion and disruption. Mergers and acquisitions (M&A) activity has been moderate, with deal values averaging approximately xx Million USD in recent years. Innovation is driven by advancements in neuroimaging techniques, miniaturization of devices, and the increasing demand for non-invasive brain mapping solutions. Regulatory frameworks vary across regions, impacting market access and adoption rates. Substitute technologies, while existing, often lack the specificity and detail offered by advanced brain mapping instruments. End-user trends highlight a growing preference for more portable and user-friendly devices, particularly in outpatient settings.
- Market Share: Top 5 players: xx%
- Average M&A Deal Value (recent years): xx Million USD
- Key Innovation Drivers: Miniaturization, non-invasive techniques, improved image resolution.
- Regulatory Impact: Varying approval processes across geographies.
- Substitute Technologies: Limited in terms of accuracy and detail.
Brain Mapping Instruments Market Industry Trends & Insights
The Brain Mapping Instruments market is projected to experience a Compound Annual Growth Rate (CAGR) of xx% during the forecast period (2025-2033). This growth is primarily driven by the rising prevalence of neurological disorders, increasing investments in neuroscience research, and technological advancements leading to more accurate and efficient brain mapping techniques. The market penetration of fNIRS and EEG systems is increasing significantly, driven by their affordability and portability compared to fMRI and PET. Technological disruptions, such as the development of AI-powered image analysis tools, are enhancing the diagnostic capabilities of these instruments. Consumer preferences are shifting towards non-invasive, minimally disruptive procedures, driving demand for technologies like fNIRS and EEG. The competitive landscape is characterized by both established players and emerging companies, leading to product diversification and price competition.
Dominant Markets & Segments in Brain Mapping Instruments Market
The North American region currently dominates the Brain Mapping Instruments market, driven by high healthcare expenditure, advanced infrastructure, and a large number of research institutions. Within the product segment, fMRI holds the largest market share due to its high resolution and detailed functional information. However, the fNIRS segment is experiencing rapid growth owing to its portability, affordability, and non-invasive nature. Hospitals remain the largest end-user segment, followed by diagnostic centers.
- Leading Region: North America
- Dominant Product Segment: fMRI
- Fastest-Growing Product Segment: fNIRS
- Largest End-User Segment: Hospitals
- Key Drivers (North America): High healthcare spending, advanced research infrastructure.
Brain Mapping Instruments Market Product Developments
Recent advancements in brain mapping instruments focus on enhancing image resolution, improving portability, and integrating AI for faster and more accurate analysis. New applications are emerging in areas such as neurorehabilitation, brain-computer interfaces, and personalized medicine. The competitive advantage increasingly relies on offering high-quality imaging, user-friendly interfaces, and comprehensive data analysis capabilities. These developments are aligning with the market’s increasing demand for non-invasive, precise, and efficient brain mapping solutions.
Report Scope & Segmentation Analysis
This report segments the Brain Mapping Instruments market based on product type (Computed Axial Tomography (CAT), Position Emission Tomography, Electroencephalography (EEG), Functional Near-Infrared Spectroscopy (fNIRS), Functional Magnetic Resonance Imaging (fMRI), Other Products) and end-user (Hospitals, Diagnostic Centers, Other End Users). Each segment’s growth trajectory is analyzed, considering market size, competitive intensity, and future prospects. The detailed analysis provides insights into the specific dynamics driving the growth of each segment. For instance, the EEG segment is expected to show steady growth due to its affordability and wide range of applications, while the fMRI market benefits from its high-resolution imaging capabilities, albeit at a higher cost.
Key Drivers of Brain Mapping Instruments Market Growth
The Brain Mapping Instruments market is propelled by several key factors: the increasing prevalence of neurological and psychiatric disorders, escalating research funding in neuroscience, technological advancements leading to improved imaging techniques and data analysis capabilities, and the growing demand for personalized medicine approaches. Regulatory support for advanced medical technologies in several regions also contributes to the market’s expansion.
Challenges in the Brain Mapping Instruments Market Sector
The Brain Mapping Instruments market faces several challenges, including high equipment costs, the need for specialized personnel, and the complexity of data analysis. Regulatory hurdles related to product approvals and reimbursement policies can also impede market growth. Supply chain disruptions and the intense competition from established players can impact profitability.
Emerging Opportunities in Brain Mapping Instruments Market
Emerging opportunities lie in the development of more portable and user-friendly devices, the integration of artificial intelligence and machine learning for improved data analysis, and the expansion into new applications such as brain-computer interfaces and personalized medicine. The increasing focus on early diagnosis and preventative care also presents a significant opportunity for market expansion.
Leading Players in the Brain Mapping Instruments Market Market
- Natus Medical Incorporated
- NIRx Medical Technologies LLC
- Siemens Healthineers
- Koninklijke Philips N.V.
- Medtronic PLC
- Artinis Medical Systems
- Advanced Brain Monitoring Inc
- Soterix Medical Inc
- Gowerlabs Ltd
- Nihon Kohden Corporation
- General Electric Company
- Canon Medical Systems Corp
Key Developments in Brain Mapping Instruments Market Industry
- March 2022: Kernel launched Kernel Flow, a wearable TD-fNIRS headset for high-resolution brain measurement. This signifies a move towards more accessible and user-friendly brain mapping technologies.
- September 2022: The Allen Institute launched the Brain Genome Project, a global initiative to map the human brain's cells. This ambitious project is expected to fuel further innovation and investment in brain mapping technologies.
Strategic Outlook for Brain Mapping Instruments Market Market
The Brain Mapping Instruments market is poised for significant growth in the coming years, driven by technological advancements, increasing research funding, and the growing demand for accurate and efficient brain mapping solutions. Opportunities abound in developing portable devices, integrating AI for better data analysis, and expanding applications into new clinical areas. Strategic partnerships, technological innovation, and a focus on user-friendliness will be crucial for success in this dynamic and rapidly evolving market.
Brain Mapping Instruments Market Segmentation
-
1. Product
- 1.1. Computed Axial Tomography (CAT)
- 1.2. Position Emission Tomography
- 1.3. Electroencephalography (EEG)
- 1.4. Functional Near-Infrared Spectroscopy (fNIRS)
- 1.5. Functional Magnetic Resonance Imaging (fMRI)
- 1.6. Other Products
-
2. End User
- 2.1. Hospitals
- 2.2. Diagnostic Centers
- 2.3. Other End Users
Brain Mapping Instruments Market Segmentation By Geography
-
1. North America
- 1.1. United States
- 1.2. Canada
- 1.3. Mexico
-
2. Europe
- 2.1. Germany
- 2.2. United Kingdom
- 2.3. France
- 2.4. Italy
- 2.5. Spain
- 2.6. Rest of Europe
-
3. Asia Pacific
- 3.1. China
- 3.2. Japan
- 3.3. India
- 3.4. Australia
- 3.5. South Korea
- 3.6. Rest of Asia Pacific
-
4. Middle East and Africa
- 4.1. GCC
- 4.2. South Africa
- 4.3. Rest of Middle East and Africa
-
5. South America
- 5.1. Brazil
- 5.2. Argentina
- 5.3. Rest of South America
Brain Mapping Instruments Market REPORT HIGHLIGHTS
| Aspects | Details |
|---|---|
| Study Period | 2019-2033 |
| Base Year | 2024 |
| Estimated Year | 2025 |
| Forecast Period | 2025-2033 |
| Historical Period | 2019-2024 |
| Growth Rate | CAGR of 5.80% from 2019-2033 |
| Segmentation |
|
Table of Contents
- 1. Introduction
- 1.1. Research Scope
- 1.2. Market Segmentation
- 1.3. Research Methodology
- 1.4. Definitions and Assumptions
- 2. Executive Summary
- 2.1. Introduction
- 3. Market Dynamics
- 3.1. Introduction
- 3.2. Market Drivers
- 3.2.1. Increasing Prevalence of Neurological Disorders; Rising Technological Advancements; Rise in Geriatric Population
- 3.3. Market Restrains
- 3.3.1. High Cost of the Brain Mapping Instruments; Poor Healthcare Insurance Coverage
- 3.4. Market Trends
- 3.4.1. Hospitals Segment is Expected to Grow Faster and Dominate the Market Over the Forecast Period
- 4. Market Factor Analysis
- 4.1. Porters Five Forces
- 4.2. Supply/Value Chain
- 4.3. PESTEL analysis
- 4.4. Market Entropy
- 4.5. Patent/Trademark Analysis
- 5. Global Brain Mapping Instruments Market Analysis, Insights and Forecast, 2019-2031
- 5.1. Market Analysis, Insights and Forecast - by Product
- 5.1.1. Computed Axial Tomography (CAT)
- 5.1.2. Position Emission Tomography
- 5.1.3. Electroencephalography (EEG)
- 5.1.4. Functional Near-Infrared Spectroscopy (fNIRS)
- 5.1.5. Functional Magnetic Resonance Imaging (fMRI)
- 5.1.6. Other Products
- 5.2. Market Analysis, Insights and Forecast - by End User
- 5.2.1. Hospitals
- 5.2.2. Diagnostic Centers
- 5.2.3. Other End Users
- 5.3. Market Analysis, Insights and Forecast - by Region
- 5.3.1. North America
- 5.3.2. Europe
- 5.3.3. Asia Pacific
- 5.3.4. Middle East and Africa
- 5.3.5. South America
- 5.1. Market Analysis, Insights and Forecast - by Product
- 6. North America Brain Mapping Instruments Market Analysis, Insights and Forecast, 2019-2031
- 6.1. Market Analysis, Insights and Forecast - by Product
- 6.1.1. Computed Axial Tomography (CAT)
- 6.1.2. Position Emission Tomography
- 6.1.3. Electroencephalography (EEG)
- 6.1.4. Functional Near-Infrared Spectroscopy (fNIRS)
- 6.1.5. Functional Magnetic Resonance Imaging (fMRI)
- 6.1.6. Other Products
- 6.2. Market Analysis, Insights and Forecast - by End User
- 6.2.1. Hospitals
- 6.2.2. Diagnostic Centers
- 6.2.3. Other End Users
- 6.1. Market Analysis, Insights and Forecast - by Product
- 7. Europe Brain Mapping Instruments Market Analysis, Insights and Forecast, 2019-2031
- 7.1. Market Analysis, Insights and Forecast - by Product
- 7.1.1. Computed Axial Tomography (CAT)
- 7.1.2. Position Emission Tomography
- 7.1.3. Electroencephalography (EEG)
- 7.1.4. Functional Near-Infrared Spectroscopy (fNIRS)
- 7.1.5. Functional Magnetic Resonance Imaging (fMRI)
- 7.1.6. Other Products
- 7.2. Market Analysis, Insights and Forecast - by End User
- 7.2.1. Hospitals
- 7.2.2. Diagnostic Centers
- 7.2.3. Other End Users
- 7.1. Market Analysis, Insights and Forecast - by Product
- 8. Asia Pacific Brain Mapping Instruments Market Analysis, Insights and Forecast, 2019-2031
- 8.1. Market Analysis, Insights and Forecast - by Product
- 8.1.1. Computed Axial Tomography (CAT)
- 8.1.2. Position Emission Tomography
- 8.1.3. Electroencephalography (EEG)
- 8.1.4. Functional Near-Infrared Spectroscopy (fNIRS)
- 8.1.5. Functional Magnetic Resonance Imaging (fMRI)
- 8.1.6. Other Products
- 8.2. Market Analysis, Insights and Forecast - by End User
- 8.2.1. Hospitals
- 8.2.2. Diagnostic Centers
- 8.2.3. Other End Users
- 8.1. Market Analysis, Insights and Forecast - by Product
- 9. Middle East and Africa Brain Mapping Instruments Market Analysis, Insights and Forecast, 2019-2031
- 9.1. Market Analysis, Insights and Forecast - by Product
- 9.1.1. Computed Axial Tomography (CAT)
- 9.1.2. Position Emission Tomography
- 9.1.3. Electroencephalography (EEG)
- 9.1.4. Functional Near-Infrared Spectroscopy (fNIRS)
- 9.1.5. Functional Magnetic Resonance Imaging (fMRI)
- 9.1.6. Other Products
- 9.2. Market Analysis, Insights and Forecast - by End User
- 9.2.1. Hospitals
- 9.2.2. Diagnostic Centers
- 9.2.3. Other End Users
- 9.1. Market Analysis, Insights and Forecast - by Product
- 10. South America Brain Mapping Instruments Market Analysis, Insights and Forecast, 2019-2031
- 10.1. Market Analysis, Insights and Forecast - by Product
- 10.1.1. Computed Axial Tomography (CAT)
- 10.1.2. Position Emission Tomography
- 10.1.3. Electroencephalography (EEG)
- 10.1.4. Functional Near-Infrared Spectroscopy (fNIRS)
- 10.1.5. Functional Magnetic Resonance Imaging (fMRI)
- 10.1.6. Other Products
- 10.2. Market Analysis, Insights and Forecast - by End User
- 10.2.1. Hospitals
- 10.2.2. Diagnostic Centers
- 10.2.3. Other End Users
- 10.1. Market Analysis, Insights and Forecast - by Product
- 11. North America Brain Mapping Instruments Market Analysis, Insights and Forecast, 2019-2031
- 11.1. Market Analysis, Insights and Forecast - By Country/Sub-region
- 11.1.1 United States
- 11.1.2 Canada
- 11.1.3 Mexico
- 12. Europe Brain Mapping Instruments Market Analysis, Insights and Forecast, 2019-2031
- 12.1. Market Analysis, Insights and Forecast - By Country/Sub-region
- 12.1.1 Germany
- 12.1.2 United Kingdom
- 12.1.3 France
- 12.1.4 Italy
- 12.1.5 Spain
- 12.1.6 Rest of Europe
- 13. Asia Pacific Brain Mapping Instruments Market Analysis, Insights and Forecast, 2019-2031
- 13.1. Market Analysis, Insights and Forecast - By Country/Sub-region
- 13.1.1 China
- 13.1.2 Japan
- 13.1.3 India
- 13.1.4 Australia
- 13.1.5 South Korea
- 13.1.6 Rest of Asia Pacific
- 14. Middle East and Africa Brain Mapping Instruments Market Analysis, Insights and Forecast, 2019-2031
- 14.1. Market Analysis, Insights and Forecast - By Country/Sub-region
- 14.1.1 GCC
- 14.1.2 South Africa
- 14.1.3 Rest of Middle East and Africa
- 15. South America Brain Mapping Instruments Market Analysis, Insights and Forecast, 2019-2031
- 15.1. Market Analysis, Insights and Forecast - By Country/Sub-region
- 15.1.1 Brazil
- 15.1.2 Argentina
- 15.1.3 Rest of South America
- 16. Competitive Analysis
- 16.1. Global Market Share Analysis 2024
- 16.2. Company Profiles
- 16.2.1 Natus Medical Incorporated
- 16.2.1.1. Overview
- 16.2.1.2. Products
- 16.2.1.3. SWOT Analysis
- 16.2.1.4. Recent Developments
- 16.2.1.5. Financials (Based on Availability)
- 16.2.2 NIRx Medical Technologies LLC
- 16.2.2.1. Overview
- 16.2.2.2. Products
- 16.2.2.3. SWOT Analysis
- 16.2.2.4. Recent Developments
- 16.2.2.5. Financials (Based on Availability)
- 16.2.3 Siemens Healthineers
- 16.2.3.1. Overview
- 16.2.3.2. Products
- 16.2.3.3. SWOT Analysis
- 16.2.3.4. Recent Developments
- 16.2.3.5. Financials (Based on Availability)
- 16.2.4 Koninklijke Philips N V
- 16.2.4.1. Overview
- 16.2.4.2. Products
- 16.2.4.3. SWOT Analysis
- 16.2.4.4. Recent Developments
- 16.2.4.5. Financials (Based on Availability)
- 16.2.5 Medtronic PLC
- 16.2.5.1. Overview
- 16.2.5.2. Products
- 16.2.5.3. SWOT Analysis
- 16.2.5.4. Recent Developments
- 16.2.5.5. Financials (Based on Availability)
- 16.2.6 Artinis Medical Systems
- 16.2.6.1. Overview
- 16.2.6.2. Products
- 16.2.6.3. SWOT Analysis
- 16.2.6.4. Recent Developments
- 16.2.6.5. Financials (Based on Availability)
- 16.2.7 Advanced Brain Monitoring Inc
- 16.2.7.1. Overview
- 16.2.7.2. Products
- 16.2.7.3. SWOT Analysis
- 16.2.7.4. Recent Developments
- 16.2.7.5. Financials (Based on Availability)
- 16.2.8 Soterix Medical Inc
- 16.2.8.1. Overview
- 16.2.8.2. Products
- 16.2.8.3. SWOT Analysis
- 16.2.8.4. Recent Developments
- 16.2.8.5. Financials (Based on Availability)
- 16.2.9 Gowerlabs Ltd
- 16.2.9.1. Overview
- 16.2.9.2. Products
- 16.2.9.3. SWOT Analysis
- 16.2.9.4. Recent Developments
- 16.2.9.5. Financials (Based on Availability)
- 16.2.10 Nihon Kohden Corporation
- 16.2.10.1. Overview
- 16.2.10.2. Products
- 16.2.10.3. SWOT Analysis
- 16.2.10.4. Recent Developments
- 16.2.10.5. Financials (Based on Availability)
- 16.2.11 General Electric Company
- 16.2.11.1. Overview
- 16.2.11.2. Products
- 16.2.11.3. SWOT Analysis
- 16.2.11.4. Recent Developments
- 16.2.11.5. Financials (Based on Availability)
- 16.2.12 Canon Medical Systems Corp
- 16.2.12.1. Overview
- 16.2.12.2. Products
- 16.2.12.3. SWOT Analysis
- 16.2.12.4. Recent Developments
- 16.2.12.5. Financials (Based on Availability)
- 16.2.1 Natus Medical Incorporated
List of Figures
- Figure 1: Global Brain Mapping Instruments Market Revenue Breakdown (Million, %) by Region 2024 & 2032
- Figure 2: North America Brain Mapping Instruments Market Revenue (Million), by Country 2024 & 2032
- Figure 3: North America Brain Mapping Instruments Market Revenue Share (%), by Country 2024 & 2032
- Figure 4: Europe Brain Mapping Instruments Market Revenue (Million), by Country 2024 & 2032
- Figure 5: Europe Brain Mapping Instruments Market Revenue Share (%), by Country 2024 & 2032
- Figure 6: Asia Pacific Brain Mapping Instruments Market Revenue (Million), by Country 2024 & 2032
- Figure 7: Asia Pacific Brain Mapping Instruments Market Revenue Share (%), by Country 2024 & 2032
- Figure 8: Middle East and Africa Brain Mapping Instruments Market Revenue (Million), by Country 2024 & 2032
- Figure 9: Middle East and Africa Brain Mapping Instruments Market Revenue Share (%), by Country 2024 & 2032
- Figure 10: South America Brain Mapping Instruments Market Revenue (Million), by Country 2024 & 2032
- Figure 11: South America Brain Mapping Instruments Market Revenue Share (%), by Country 2024 & 2032
- Figure 12: North America Brain Mapping Instruments Market Revenue (Million), by Product 2024 & 2032
- Figure 13: North America Brain Mapping Instruments Market Revenue Share (%), by Product 2024 & 2032
- Figure 14: North America Brain Mapping Instruments Market Revenue (Million), by End User 2024 & 2032
- Figure 15: North America Brain Mapping Instruments Market Revenue Share (%), by End User 2024 & 2032
- Figure 16: North America Brain Mapping Instruments Market Revenue (Million), by Country 2024 & 2032
- Figure 17: North America Brain Mapping Instruments Market Revenue Share (%), by Country 2024 & 2032
- Figure 18: Europe Brain Mapping Instruments Market Revenue (Million), by Product 2024 & 2032
- Figure 19: Europe Brain Mapping Instruments Market Revenue Share (%), by Product 2024 & 2032
- Figure 20: Europe Brain Mapping Instruments Market Revenue (Million), by End User 2024 & 2032
- Figure 21: Europe Brain Mapping Instruments Market Revenue Share (%), by End User 2024 & 2032
- Figure 22: Europe Brain Mapping Instruments Market Revenue (Million), by Country 2024 & 2032
- Figure 23: Europe Brain Mapping Instruments Market Revenue Share (%), by Country 2024 & 2032
- Figure 24: Asia Pacific Brain Mapping Instruments Market Revenue (Million), by Product 2024 & 2032
- Figure 25: Asia Pacific Brain Mapping Instruments Market Revenue Share (%), by Product 2024 & 2032
- Figure 26: Asia Pacific Brain Mapping Instruments Market Revenue (Million), by End User 2024 & 2032
- Figure 27: Asia Pacific Brain Mapping Instruments Market Revenue Share (%), by End User 2024 & 2032
- Figure 28: Asia Pacific Brain Mapping Instruments Market Revenue (Million), by Country 2024 & 2032
- Figure 29: Asia Pacific Brain Mapping Instruments Market Revenue Share (%), by Country 2024 & 2032
- Figure 30: Middle East and Africa Brain Mapping Instruments Market Revenue (Million), by Product 2024 & 2032
- Figure 31: Middle East and Africa Brain Mapping Instruments Market Revenue Share (%), by Product 2024 & 2032
- Figure 32: Middle East and Africa Brain Mapping Instruments Market Revenue (Million), by End User 2024 & 2032
- Figure 33: Middle East and Africa Brain Mapping Instruments Market Revenue Share (%), by End User 2024 & 2032
- Figure 34: Middle East and Africa Brain Mapping Instruments Market Revenue (Million), by Country 2024 & 2032
- Figure 35: Middle East and Africa Brain Mapping Instruments Market Revenue Share (%), by Country 2024 & 2032
- Figure 36: South America Brain Mapping Instruments Market Revenue (Million), by Product 2024 & 2032
- Figure 37: South America Brain Mapping Instruments Market Revenue Share (%), by Product 2024 & 2032
- Figure 38: South America Brain Mapping Instruments Market Revenue (Million), by End User 2024 & 2032
- Figure 39: South America Brain Mapping Instruments Market Revenue Share (%), by End User 2024 & 2032
- Figure 40: South America Brain Mapping Instruments Market Revenue (Million), by Country 2024 & 2032
- Figure 41: South America Brain Mapping Instruments Market Revenue Share (%), by Country 2024 & 2032
List of Tables
- Table 1: Global Brain Mapping Instruments Market Revenue Million Forecast, by Region 2019 & 2032
- Table 2: Global Brain Mapping Instruments Market Revenue Million Forecast, by Product 2019 & 2032
- Table 3: Global Brain Mapping Instruments Market Revenue Million Forecast, by End User 2019 & 2032
- Table 4: Global Brain Mapping Instruments Market Revenue Million Forecast, by Region 2019 & 2032
- Table 5: Global Brain Mapping Instruments Market Revenue Million Forecast, by Country 2019 & 2032
- Table 6: United States Brain Mapping Instruments Market Revenue (Million) Forecast, by Application 2019 & 2032
- Table 7: Canada Brain Mapping Instruments Market Revenue (Million) Forecast, by Application 2019 & 2032
- Table 8: Mexico Brain Mapping Instruments Market Revenue (Million) Forecast, by Application 2019 & 2032
- Table 9: Global Brain Mapping Instruments Market Revenue Million Forecast, by Country 2019 & 2032
- Table 10: Germany Brain Mapping Instruments Market Revenue (Million) Forecast, by Application 2019 & 2032
- Table 11: United Kingdom Brain Mapping Instruments Market Revenue (Million) Forecast, by Application 2019 & 2032
- Table 12: France Brain Mapping Instruments Market Revenue (Million) Forecast, by Application 2019 & 2032
- Table 13: Italy Brain Mapping Instruments Market Revenue (Million) Forecast, by Application 2019 & 2032
- Table 14: Spain Brain Mapping Instruments Market Revenue (Million) Forecast, by Application 2019 & 2032
- Table 15: Rest of Europe Brain Mapping Instruments Market Revenue (Million) Forecast, by Application 2019 & 2032
- Table 16: Global Brain Mapping Instruments Market Revenue Million Forecast, by Country 2019 & 2032
- Table 17: China Brain Mapping Instruments Market Revenue (Million) Forecast, by Application 2019 & 2032
- Table 18: Japan Brain Mapping Instruments Market Revenue (Million) Forecast, by Application 2019 & 2032
- Table 19: India Brain Mapping Instruments Market Revenue (Million) Forecast, by Application 2019 & 2032
- Table 20: Australia Brain Mapping Instruments Market Revenue (Million) Forecast, by Application 2019 & 2032
- Table 21: South Korea Brain Mapping Instruments Market Revenue (Million) Forecast, by Application 2019 & 2032
- Table 22: Rest of Asia Pacific Brain Mapping Instruments Market Revenue (Million) Forecast, by Application 2019 & 2032
- Table 23: Global Brain Mapping Instruments Market Revenue Million Forecast, by Country 2019 & 2032
- Table 24: GCC Brain Mapping Instruments Market Revenue (Million) Forecast, by Application 2019 & 2032
- Table 25: South Africa Brain Mapping Instruments Market Revenue (Million) Forecast, by Application 2019 & 2032
- Table 26: Rest of Middle East and Africa Brain Mapping Instruments Market Revenue (Million) Forecast, by Application 2019 & 2032
- Table 27: Global Brain Mapping Instruments Market Revenue Million Forecast, by Country 2019 & 2032
- Table 28: Brazil Brain Mapping Instruments Market Revenue (Million) Forecast, by Application 2019 & 2032
- Table 29: Argentina Brain Mapping Instruments Market Revenue (Million) Forecast, by Application 2019 & 2032
- Table 30: Rest of South America Brain Mapping Instruments Market Revenue (Million) Forecast, by Application 2019 & 2032
- Table 31: Global Brain Mapping Instruments Market Revenue Million Forecast, by Product 2019 & 2032
- Table 32: Global Brain Mapping Instruments Market Revenue Million Forecast, by End User 2019 & 2032
- Table 33: Global Brain Mapping Instruments Market Revenue Million Forecast, by Country 2019 & 2032
- Table 34: United States Brain Mapping Instruments Market Revenue (Million) Forecast, by Application 2019 & 2032
- Table 35: Canada Brain Mapping Instruments Market Revenue (Million) Forecast, by Application 2019 & 2032
- Table 36: Mexico Brain Mapping Instruments Market Revenue (Million) Forecast, by Application 2019 & 2032
- Table 37: Global Brain Mapping Instruments Market Revenue Million Forecast, by Product 2019 & 2032
- Table 38: Global Brain Mapping Instruments Market Revenue Million Forecast, by End User 2019 & 2032
- Table 39: Global Brain Mapping Instruments Market Revenue Million Forecast, by Country 2019 & 2032
- Table 40: Germany Brain Mapping Instruments Market Revenue (Million) Forecast, by Application 2019 & 2032
- Table 41: United Kingdom Brain Mapping Instruments Market Revenue (Million) Forecast, by Application 2019 & 2032
- Table 42: France Brain Mapping Instruments Market Revenue (Million) Forecast, by Application 2019 & 2032
- Table 43: Italy Brain Mapping Instruments Market Revenue (Million) Forecast, by Application 2019 & 2032
- Table 44: Spain Brain Mapping Instruments Market Revenue (Million) Forecast, by Application 2019 & 2032
- Table 45: Rest of Europe Brain Mapping Instruments Market Revenue (Million) Forecast, by Application 2019 & 2032
- Table 46: Global Brain Mapping Instruments Market Revenue Million Forecast, by Product 2019 & 2032
- Table 47: Global Brain Mapping Instruments Market Revenue Million Forecast, by End User 2019 & 2032
- Table 48: Global Brain Mapping Instruments Market Revenue Million Forecast, by Country 2019 & 2032
- Table 49: China Brain Mapping Instruments Market Revenue (Million) Forecast, by Application 2019 & 2032
- Table 50: Japan Brain Mapping Instruments Market Revenue (Million) Forecast, by Application 2019 & 2032
- Table 51: India Brain Mapping Instruments Market Revenue (Million) Forecast, by Application 2019 & 2032
- Table 52: Australia Brain Mapping Instruments Market Revenue (Million) Forecast, by Application 2019 & 2032
- Table 53: South Korea Brain Mapping Instruments Market Revenue (Million) Forecast, by Application 2019 & 2032
- Table 54: Rest of Asia Pacific Brain Mapping Instruments Market Revenue (Million) Forecast, by Application 2019 & 2032
- Table 55: Global Brain Mapping Instruments Market Revenue Million Forecast, by Product 2019 & 2032
- Table 56: Global Brain Mapping Instruments Market Revenue Million Forecast, by End User 2019 & 2032
- Table 57: Global Brain Mapping Instruments Market Revenue Million Forecast, by Country 2019 & 2032
- Table 58: GCC Brain Mapping Instruments Market Revenue (Million) Forecast, by Application 2019 & 2032
- Table 59: South Africa Brain Mapping Instruments Market Revenue (Million) Forecast, by Application 2019 & 2032
- Table 60: Rest of Middle East and Africa Brain Mapping Instruments Market Revenue (Million) Forecast, by Application 2019 & 2032
- Table 61: Global Brain Mapping Instruments Market Revenue Million Forecast, by Product 2019 & 2032
- Table 62: Global Brain Mapping Instruments Market Revenue Million Forecast, by End User 2019 & 2032
- Table 63: Global Brain Mapping Instruments Market Revenue Million Forecast, by Country 2019 & 2032
- Table 64: Brazil Brain Mapping Instruments Market Revenue (Million) Forecast, by Application 2019 & 2032
- Table 65: Argentina Brain Mapping Instruments Market Revenue (Million) Forecast, by Application 2019 & 2032
- Table 66: Rest of South America Brain Mapping Instruments Market Revenue (Million) Forecast, by Application 2019 & 2032
Frequently Asked Questions
1. What is the projected Compound Annual Growth Rate (CAGR) of the Brain Mapping Instruments Market?
The projected CAGR is approximately 5.80%.
2. Which companies are prominent players in the Brain Mapping Instruments Market?
Key companies in the market include Natus Medical Incorporated, NIRx Medical Technologies LLC, Siemens Healthineers, Koninklijke Philips N V, Medtronic PLC, Artinis Medical Systems, Advanced Brain Monitoring Inc, Soterix Medical Inc, Gowerlabs Ltd, Nihon Kohden Corporation, General Electric Company, Canon Medical Systems Corp.
3. What are the main segments of the Brain Mapping Instruments Market?
The market segments include Product, End User.
4. Can you provide details about the market size?
The market size is estimated to be USD XX Million as of 2022.
5. What are some drivers contributing to market growth?
Increasing Prevalence of Neurological Disorders; Rising Technological Advancements; Rise in Geriatric Population.
6. What are the notable trends driving market growth?
Hospitals Segment is Expected to Grow Faster and Dominate the Market Over the Forecast Period.
7. Are there any restraints impacting market growth?
High Cost of the Brain Mapping Instruments; Poor Healthcare Insurance Coverage.
8. Can you provide examples of recent developments in the market?
September 2022: Scientists at the Allen Institute established the Brain Genome Project, a new global partnership to map approximately 200 billion cells in the human brain by type and function.
9. What pricing options are available for accessing the report?
Pricing options include single-user, multi-user, and enterprise licenses priced at USD 4750, USD 5250, and USD 8750 respectively.
10. Is the market size provided in terms of value or volume?
The market size is provided in terms of value, measured in Million.
11. Are there any specific market keywords associated with the report?
Yes, the market keyword associated with the report is "Brain Mapping Instruments Market," which aids in identifying and referencing the specific market segment covered.
12. How do I determine which pricing option suits my needs best?
The pricing options vary based on user requirements and access needs. Individual users may opt for single-user licenses, while businesses requiring broader access may choose multi-user or enterprise licenses for cost-effective access to the report.
13. Are there any additional resources or data provided in the Brain Mapping Instruments Market report?
While the report offers comprehensive insights, it's advisable to review the specific contents or supplementary materials provided to ascertain if additional resources or data are available.
14. How can I stay updated on further developments or reports in the Brain Mapping Instruments Market?
To stay informed about further developments, trends, and reports in the Brain Mapping Instruments Market, consider subscribing to industry newsletters, following relevant companies and organizations, or regularly checking reputable industry news sources and publications.
Methodology
Step 1 - Identification of Relevant Samples Size from Population Database


Step 2 - Approaches for Defining Global Market Size (Value, Volume* & Price*)

Note*: In applicable scenarios
Step 3 - Data Sources
Primary Research
- Web Analytics
- Survey Reports
- Research Institute
- Latest Research Reports
- Opinion Leaders
Secondary Research
- Annual Reports
- White Paper
- Latest Press Release
- Industry Association
- Paid Database
- Investor Presentations

Step 4 - Data Triangulation
Involves using different sources of information in order to increase the validity of a study
These sources are likely to be stakeholders in a program - participants, other researchers, program staff, other community members, and so on.
Then we put all data in single framework & apply various statistical tools to find out the dynamic on the market.
During the analysis stage, feedback from the stakeholder groups would be compared to determine areas of agreement as well as areas of divergence


