
Key Insights
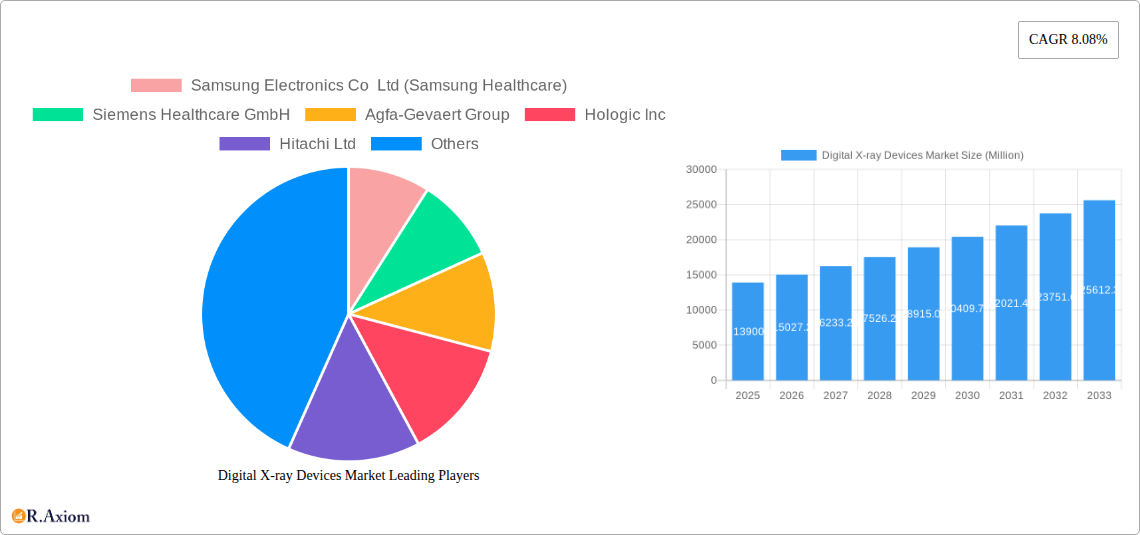
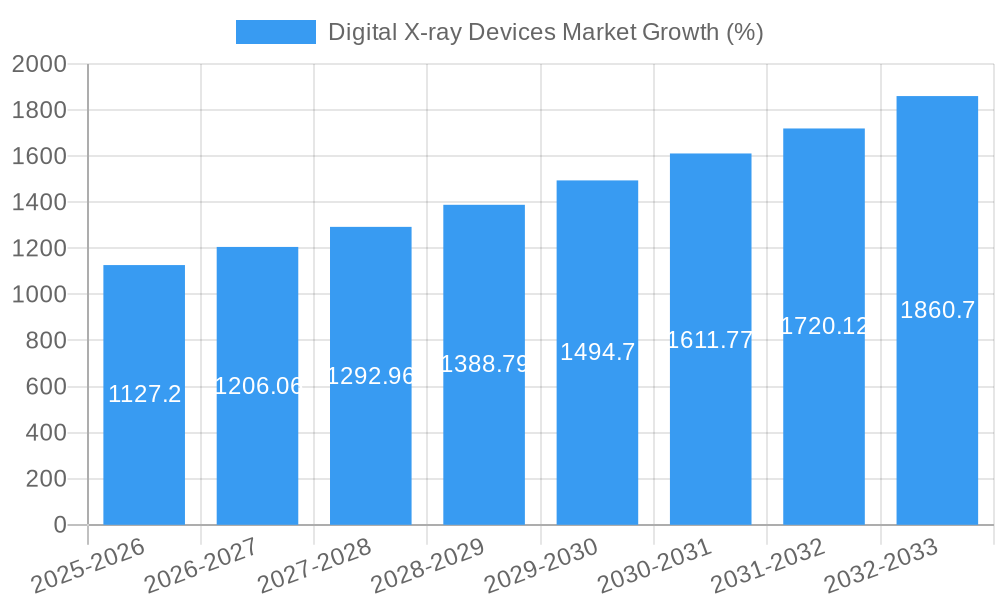
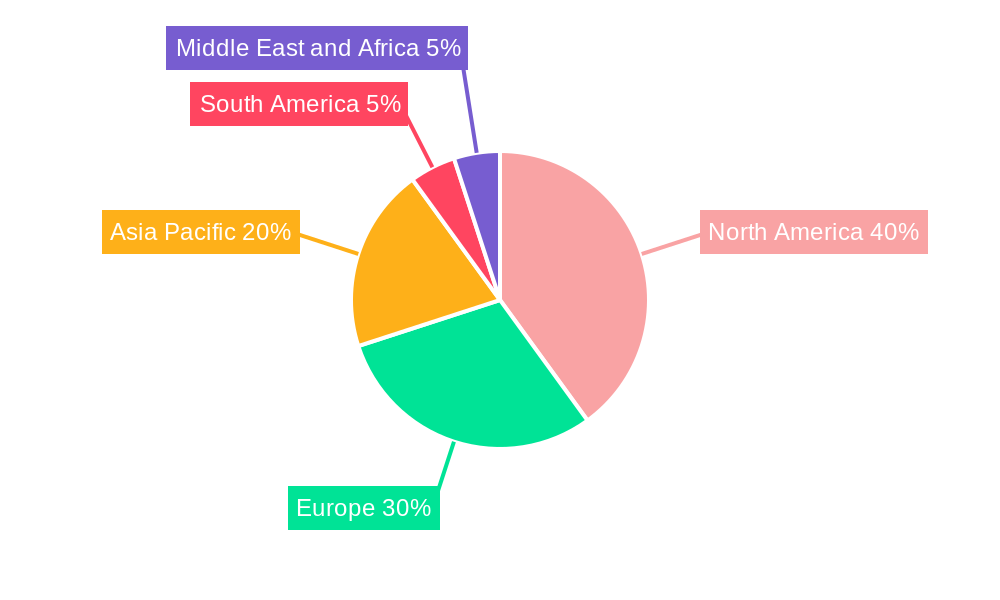
The global digital X-ray devices market, valued at $13.90 billion in 2025, is projected to experience robust growth, driven by a compound annual growth rate (CAGR) of 8.08% from 2025 to 2033. This expansion is fueled by several key factors. Technological advancements in computed radiography (CR) and direct radiography (DR) are significantly improving image quality, reducing exposure times, and enhancing diagnostic accuracy. The increasing prevalence of chronic diseases like cancer and cardiovascular conditions, coupled with a rising geriatric population requiring more frequent diagnostic imaging, is driving demand. Furthermore, the growing adoption of portable X-ray systems in remote areas and ambulances expands accessibility, contributing to market growth. The market is segmented across various applications (orthopedic, cancer, dental, cardiovascular, and others), technologies (CR and DR), portability (fixed and portable systems), and end-users (hospitals, diagnostic centers, and others). North America and Europe currently hold significant market shares, but the Asia-Pacific region is expected to witness the fastest growth due to increasing healthcare infrastructure development and rising disposable incomes. Competitive landscape includes established players like Samsung Healthcare, Siemens Healthcare, Agfa-Gevaert, and others, constantly innovating to offer advanced features and improve patient care.
Despite the positive growth outlook, the market faces certain challenges. High initial investment costs associated with advanced digital X-ray systems can be a barrier to entry for smaller healthcare facilities, particularly in developing regions. Stringent regulatory approvals and compliance requirements for medical devices also present hurdles for market entrants. However, ongoing technological advancements, coupled with increasing government initiatives to improve healthcare infrastructure and expanding access to diagnostic imaging, are expected to mitigate these restraints and further fuel market expansion throughout the forecast period. The integration of AI and machine learning in image analysis is an emerging trend, promising to further enhance diagnostic capabilities and market growth in the coming years.
This comprehensive report provides a detailed analysis of the global Digital X-ray Devices market, covering the period 2019-2033. It offers invaluable insights into market dynamics, competitive landscapes, technological advancements, and future growth prospects. The report utilizes a robust methodology, incorporating extensive primary and secondary research to provide accurate and reliable data. This report is essential for industry stakeholders, investors, and market entrants seeking to understand and capitalize on opportunities within this dynamic sector. The market is expected to reach xx Million by 2033, showcasing substantial growth potential.
Digital X-ray Devices Market Market Concentration & Innovation
The global digital X-ray devices market exhibits a moderately concentrated landscape, dominated by established players like Samsung Electronics Co Ltd (Samsung Healthcare), Siemens Healthcare GmbH, Agfa-Gevaert Group, Hologic Inc, Hitachi Ltd, Koninklijke Philips N V, Canon Medical Systems Corporation (Toshiba Corporation), Carestream Health, General Electric Company (GE Healthcare), Shimadzu Corporation, and Fujifilm Holdings Corporation. These companies collectively hold a significant market share, estimated at approximately 70% in 2024. However, the market also accommodates several smaller players, fostering competition and innovation.
Market concentration is influenced by factors such as technological advancements, regulatory approvals, and strategic mergers and acquisitions (M&A). Recent M&A activity has been moderate, with deal values averaging around xx Million per transaction in the past five years. Innovation is a key driver, with companies investing heavily in R&D to develop advanced features such as improved image quality, portability, and integration with other medical imaging systems. Stringent regulatory frameworks governing medical devices necessitate significant investments in compliance, influencing market dynamics. Furthermore, the emergence of alternative imaging technologies, such as ultrasound and MRI, presents a degree of substitution pressure. End-user trends toward minimally invasive procedures and personalized medicine are shaping product development and market demand.
Digital X-ray Devices Market Industry Trends & Insights
The digital X-ray devices market is experiencing robust growth, driven by several key factors. The increasing prevalence of chronic diseases, particularly cardiovascular and orthopedic conditions, fuels demand for diagnostic imaging solutions. Technological advancements, such as the development of wireless and portable systems, are expanding accessibility and improving efficiency in healthcare settings. Consumer preferences are shifting towards advanced features, such as improved image quality, reduced radiation exposure, and faster processing times. These factors contribute to a compound annual growth rate (CAGR) of approximately xx% during the forecast period (2025-2033). Market penetration of digital X-ray systems is steadily increasing, particularly in developing economies where healthcare infrastructure is expanding. The competitive dynamics are characterized by intense rivalry among established players and emerging innovators. Strategic partnerships, product launches, and geographic expansion are key strategies employed by market participants to gain a competitive edge. The market is also witnessing a rising adoption of AI-powered image analysis tools, promising to enhance diagnostic accuracy and efficiency. The adoption of cloud-based solutions for image storage and sharing is also gaining traction, further driving industry transformation. Finally, government initiatives promoting digital healthcare are providing additional support for market growth.
Dominant Markets & Segments in Digital X-ray Devices Market
The North American region currently dominates the digital X-ray devices market, driven by factors such as high healthcare expenditure, advanced healthcare infrastructure, and strong adoption rates of advanced imaging technologies. Within applications, the orthopedic segment holds the largest market share due to the high incidence of musculoskeletal disorders. Direct radiography (DR) technology leads in market penetration due to its superior image quality and speed compared to computed radiography (CR). Hospitals form the largest end-user segment, due to their significant volume of diagnostic procedures.
Key Drivers for North American Dominance:
- High healthcare expenditure
- Advanced healthcare infrastructure
- Strong regulatory framework supporting technological advancements
- High adoption rate of advanced imaging technologies.
Key Drivers for Orthopedic Application Dominance:
- High prevalence of musculoskeletal disorders
- Increasing aging population
- Rising demand for minimally invasive orthopedic procedures
Key Drivers for Direct Radiography Technology Dominance:
- Superior image quality compared to CR
- Faster image acquisition time
- Improved workflow efficiency.
Key Drivers for Hospital Segment Dominance:
- High volume of diagnostic procedures
- Established healthcare infrastructure
- Availability of trained professionals.
Digital X-ray Devices Market Product Developments
Recent product innovations focus on enhancing portability, image quality, and workflow efficiency. Manufacturers are integrating advanced features such as AI-powered image analysis, wireless connectivity, and cloud-based solutions. The market is seeing a growing demand for hybrid systems, combining the capabilities of both portable and fixed systems. These innovations aim to improve diagnostic accuracy, reduce radiation exposure, and streamline clinical workflows, resulting in better patient outcomes and increased operational efficiency for healthcare providers. The ability to integrate seamlessly with existing hospital information systems (HIS) is a key differentiator in the market.
Report Scope & Segmentation Analysis
This report segments the digital X-ray devices market by application (orthopedic, cancer, dental, cardiovascular, other applications), technology (computed radiography, direct radiography), portability (fixed systems, portable systems), and end-user (hospitals, diagnostic centers, other end users). Each segment presents unique growth projections, market sizes, and competitive dynamics. The orthopedic segment is expected to experience significant growth due to the rising prevalence of musculoskeletal disorders, while direct radiography technology is anticipated to dominate the market due to its advantages in image quality and speed. Hospitals represent the largest end-user segment, driven by their high volume of diagnostic imaging procedures.
Key Drivers of Digital X-ray Devices Market Growth
Several key factors propel growth in the digital X-ray devices market. These include the rising prevalence of chronic diseases necessitating frequent imaging, advancements in digital X-ray technology offering improved image quality and reduced radiation exposure, the increasing adoption of digital X-ray systems in emerging markets, and the growing demand for portable and wireless systems for improved patient care and convenience. Government initiatives promoting digital healthcare and the increasing use of AI-powered image analysis tools also contribute to market expansion.
Challenges in the Digital X-ray Devices Market Sector
The digital X-ray devices market faces several challenges. Stringent regulatory approvals and compliance requirements increase the cost and time associated with bringing new products to market. Supply chain disruptions and fluctuating raw material prices impact production costs and profitability. Intense competition from established players and new entrants necessitates continuous innovation and investment in R&D. Finally, concerns about radiation exposure and the high cost of advanced systems can limit market penetration in certain regions. These factors collectively pose significant obstacles to market growth.
Emerging Opportunities in Digital X-ray Devices Market
Emerging trends and opportunities abound within the digital X-ray devices market. The adoption of AI-powered image analysis tools for enhanced diagnostic accuracy is creating significant opportunities. The growing demand for portable and wireless systems in remote and underserved areas expands market reach. Integration with other medical imaging modalities and the development of hybrid systems are further avenues for innovation. Furthermore, the increasing adoption of cloud-based solutions for image storage and sharing opens new possibilities for data management and collaboration.
Leading Players in the Digital X-ray Devices Market Market
- Samsung Electronics Co Ltd (Samsung Healthcare)
- Siemens Healthcare GmbH
- Agfa-Gevaert Group
- Hologic Inc
- Hitachi Ltd
- Koninklijke Philips N V
- Canon Medical Systems Corporation (Toshiba Corporation)
- Carestream Health
- General Electric Company (GE Healthcare)
- Shimadzu Corporation
- Fujifilm Holdings Corporation
Key Developments in Digital X-ray Devices Market Industry
- July 2022: Fujifilm launched the FDR Cross, a hybrid c-arm and portable X-ray solution in the US.
- March 2022: Konica Minolta, Inc. launched the AeroDR TX m01, a wireless mobile X-ray system in Japan.
These launches demonstrate the ongoing innovation and expansion within the digital X-ray devices market.
Strategic Outlook for Digital X-ray Devices Market Market
The future of the digital X-ray devices market appears bright, driven by continuous technological advancements, increasing healthcare spending, and a growing demand for improved diagnostic capabilities. The integration of AI and cloud technologies will further enhance image analysis and workflow efficiency. The expansion into emerging markets and the development of specialized applications will contribute to market growth. Focusing on innovation, strategic partnerships, and effective regulatory compliance will be crucial for success in this dynamic and competitive market.
Digital X-ray Devices Market Segmentation
-
1. Application
- 1.1. Orthopedic
- 1.2. Cancer
- 1.3. Dental
- 1.4. Cardiovascular
- 1.5. Other Applications
-
2. Technology
- 2.1. Computed Radiography
- 2.2. Direct Radiography
-
3. Portability
- 3.1. Fixed Systems
- 3.2. Portable Systems
-
4. End User
- 4.1. Hospitals
- 4.2. Diagnostic Centers
- 4.3. Other End Users
Digital X-ray Devices Market Segmentation By Geography
-
1. North America
- 1.1. United States
- 1.2. Canada
- 1.3. Mexico
-
2. Europe
- 2.1. Germany
- 2.2. United Kingdom
- 2.3. France
- 2.4. Italy
- 2.5. Spain
- 2.6. Rest of Europe
-
3. Asia Pacific
- 3.1. China
- 3.2. Japan
- 3.3. India
- 3.4. Australia
- 3.5. South Korea
- 3.6. Rest of Asia Pacific
-
4. Middle East and Africa
- 4.1. GCC
- 4.2. South Africa
- 4.3. Rest of Middle East and Africa
-
5. South America
- 5.1. Brazil
- 5.2. Argentina
- 5.3. Rest of South America
Digital X-ray Devices Market REPORT HIGHLIGHTS
| Aspects | Details |
|---|---|
| Study Period | 2019-2033 |
| Base Year | 2024 |
| Estimated Year | 2025 |
| Forecast Period | 2025-2033 |
| Historical Period | 2019-2024 |
| Growth Rate | CAGR of 8.08% from 2019-2033 |
| Segmentation |
|
Table of Contents
- 1. Introduction
- 1.1. Research Scope
- 1.2. Market Segmentation
- 1.3. Research Methodology
- 1.4. Definitions and Assumptions
- 2. Executive Summary
- 2.1. Introduction
- 3. Market Dynamics
- 3.1. Introduction
- 3.2. Market Drivers
- 3.2.1. Increasing Occurrence of Orthopedic and other Chronic Diseases; Advantages of Digital X-ray Systems Over Conventional X-rays; Technological Advancements
- 3.3. Market Restrains
- 3.3.1. High Initial Cost of Installation and High Device Cost
- 3.4. Market Trends
- 3.4.1. Portable Systems Segment is Expected to Dominate the Market Over the Forecast Period
- 4. Market Factor Analysis
- 4.1. Porters Five Forces
- 4.2. Supply/Value Chain
- 4.3. PESTEL analysis
- 4.4. Market Entropy
- 4.5. Patent/Trademark Analysis
- 5. Global Digital X-ray Devices Market Analysis, Insights and Forecast, 2019-2031
- 5.1. Market Analysis, Insights and Forecast - by Application
- 5.1.1. Orthopedic
- 5.1.2. Cancer
- 5.1.3. Dental
- 5.1.4. Cardiovascular
- 5.1.5. Other Applications
- 5.2. Market Analysis, Insights and Forecast - by Technology
- 5.2.1. Computed Radiography
- 5.2.2. Direct Radiography
- 5.3. Market Analysis, Insights and Forecast - by Portability
- 5.3.1. Fixed Systems
- 5.3.2. Portable Systems
- 5.4. Market Analysis, Insights and Forecast - by End User
- 5.4.1. Hospitals
- 5.4.2. Diagnostic Centers
- 5.4.3. Other End Users
- 5.5. Market Analysis, Insights and Forecast - by Region
- 5.5.1. North America
- 5.5.2. Europe
- 5.5.3. Asia Pacific
- 5.5.4. Middle East and Africa
- 5.5.5. South America
- 5.1. Market Analysis, Insights and Forecast - by Application
- 6. North America Digital X-ray Devices Market Analysis, Insights and Forecast, 2019-2031
- 6.1. Market Analysis, Insights and Forecast - by Application
- 6.1.1. Orthopedic
- 6.1.2. Cancer
- 6.1.3. Dental
- 6.1.4. Cardiovascular
- 6.1.5. Other Applications
- 6.2. Market Analysis, Insights and Forecast - by Technology
- 6.2.1. Computed Radiography
- 6.2.2. Direct Radiography
- 6.3. Market Analysis, Insights and Forecast - by Portability
- 6.3.1. Fixed Systems
- 6.3.2. Portable Systems
- 6.4. Market Analysis, Insights and Forecast - by End User
- 6.4.1. Hospitals
- 6.4.2. Diagnostic Centers
- 6.4.3. Other End Users
- 6.1. Market Analysis, Insights and Forecast - by Application
- 7. Europe Digital X-ray Devices Market Analysis, Insights and Forecast, 2019-2031
- 7.1. Market Analysis, Insights and Forecast - by Application
- 7.1.1. Orthopedic
- 7.1.2. Cancer
- 7.1.3. Dental
- 7.1.4. Cardiovascular
- 7.1.5. Other Applications
- 7.2. Market Analysis, Insights and Forecast - by Technology
- 7.2.1. Computed Radiography
- 7.2.2. Direct Radiography
- 7.3. Market Analysis, Insights and Forecast - by Portability
- 7.3.1. Fixed Systems
- 7.3.2. Portable Systems
- 7.4. Market Analysis, Insights and Forecast - by End User
- 7.4.1. Hospitals
- 7.4.2. Diagnostic Centers
- 7.4.3. Other End Users
- 7.1. Market Analysis, Insights and Forecast - by Application
- 8. Asia Pacific Digital X-ray Devices Market Analysis, Insights and Forecast, 2019-2031
- 8.1. Market Analysis, Insights and Forecast - by Application
- 8.1.1. Orthopedic
- 8.1.2. Cancer
- 8.1.3. Dental
- 8.1.4. Cardiovascular
- 8.1.5. Other Applications
- 8.2. Market Analysis, Insights and Forecast - by Technology
- 8.2.1. Computed Radiography
- 8.2.2. Direct Radiography
- 8.3. Market Analysis, Insights and Forecast - by Portability
- 8.3.1. Fixed Systems
- 8.3.2. Portable Systems
- 8.4. Market Analysis, Insights and Forecast - by End User
- 8.4.1. Hospitals
- 8.4.2. Diagnostic Centers
- 8.4.3. Other End Users
- 8.1. Market Analysis, Insights and Forecast - by Application
- 9. Middle East and Africa Digital X-ray Devices Market Analysis, Insights and Forecast, 2019-2031
- 9.1. Market Analysis, Insights and Forecast - by Application
- 9.1.1. Orthopedic
- 9.1.2. Cancer
- 9.1.3. Dental
- 9.1.4. Cardiovascular
- 9.1.5. Other Applications
- 9.2. Market Analysis, Insights and Forecast - by Technology
- 9.2.1. Computed Radiography
- 9.2.2. Direct Radiography
- 9.3. Market Analysis, Insights and Forecast - by Portability
- 9.3.1. Fixed Systems
- 9.3.2. Portable Systems
- 9.4. Market Analysis, Insights and Forecast - by End User
- 9.4.1. Hospitals
- 9.4.2. Diagnostic Centers
- 9.4.3. Other End Users
- 9.1. Market Analysis, Insights and Forecast - by Application
- 10. South America Digital X-ray Devices Market Analysis, Insights and Forecast, 2019-2031
- 10.1. Market Analysis, Insights and Forecast - by Application
- 10.1.1. Orthopedic
- 10.1.2. Cancer
- 10.1.3. Dental
- 10.1.4. Cardiovascular
- 10.1.5. Other Applications
- 10.2. Market Analysis, Insights and Forecast - by Technology
- 10.2.1. Computed Radiography
- 10.2.2. Direct Radiography
- 10.3. Market Analysis, Insights and Forecast - by Portability
- 10.3.1. Fixed Systems
- 10.3.2. Portable Systems
- 10.4. Market Analysis, Insights and Forecast - by End User
- 10.4.1. Hospitals
- 10.4.2. Diagnostic Centers
- 10.4.3. Other End Users
- 10.1. Market Analysis, Insights and Forecast - by Application
- 11. North America Digital X-ray Devices Market Analysis, Insights and Forecast, 2019-2031
- 11.1. Market Analysis, Insights and Forecast - By Country/Sub-region
- 11.1.1 United States
- 11.1.2 Canada
- 11.1.3 Mexico
- 12. Europe Digital X-ray Devices Market Analysis, Insights and Forecast, 2019-2031
- 12.1. Market Analysis, Insights and Forecast - By Country/Sub-region
- 12.1.1 Germany
- 12.1.2 United Kingdom
- 12.1.3 France
- 12.1.4 Italy
- 12.1.5 Spain
- 12.1.6 Rest of Europe
- 13. Asia Pacific Digital X-ray Devices Market Analysis, Insights and Forecast, 2019-2031
- 13.1. Market Analysis, Insights and Forecast - By Country/Sub-region
- 13.1.1 China
- 13.1.2 Japan
- 13.1.3 India
- 13.1.4 Australia
- 13.1.5 South Korea
- 13.1.6 Rest of Asia Pacific
- 14. South America Digital X-ray Devices Market Analysis, Insights and Forecast, 2019-2031
- 14.1. Market Analysis, Insights and Forecast - By Country/Sub-region
- 14.1.1 Brazil
- 14.1.2 Argentina
- 14.1.3 Rest of South America
- 15. Middle East and Africa Digital X-ray Devices Market Analysis, Insights and Forecast, 2019-2031
- 15.1. Market Analysis, Insights and Forecast - By Country/Sub-region
- 15.1.1 GCC
- 15.1.2 South Africa
- 15.1.3 Rest of Middle East and Africa
- 16. Competitive Analysis
- 16.1. Global Market Share Analysis 2024
- 16.2. Company Profiles
- 16.2.1 Samsung Electronics Co Ltd (Samsung Healthcare)
- 16.2.1.1. Overview
- 16.2.1.2. Products
- 16.2.1.3. SWOT Analysis
- 16.2.1.4. Recent Developments
- 16.2.1.5. Financials (Based on Availability)
- 16.2.2 Siemens Healthcare GmbH
- 16.2.2.1. Overview
- 16.2.2.2. Products
- 16.2.2.3. SWOT Analysis
- 16.2.2.4. Recent Developments
- 16.2.2.5. Financials (Based on Availability)
- 16.2.3 Agfa-Gevaert Group
- 16.2.3.1. Overview
- 16.2.3.2. Products
- 16.2.3.3. SWOT Analysis
- 16.2.3.4. Recent Developments
- 16.2.3.5. Financials (Based on Availability)
- 16.2.4 Hologic Inc
- 16.2.4.1. Overview
- 16.2.4.2. Products
- 16.2.4.3. SWOT Analysis
- 16.2.4.4. Recent Developments
- 16.2.4.5. Financials (Based on Availability)
- 16.2.5 Hitachi Ltd
- 16.2.5.1. Overview
- 16.2.5.2. Products
- 16.2.5.3. SWOT Analysis
- 16.2.5.4. Recent Developments
- 16.2.5.5. Financials (Based on Availability)
- 16.2.6 Koninklijke Philips N V
- 16.2.6.1. Overview
- 16.2.6.2. Products
- 16.2.6.3. SWOT Analysis
- 16.2.6.4. Recent Developments
- 16.2.6.5. Financials (Based on Availability)
- 16.2.7 Canon Medical Systems Corporation (Toshiba Corporation)
- 16.2.7.1. Overview
- 16.2.7.2. Products
- 16.2.7.3. SWOT Analysis
- 16.2.7.4. Recent Developments
- 16.2.7.5. Financials (Based on Availability)
- 16.2.8 Carestream Health
- 16.2.8.1. Overview
- 16.2.8.2. Products
- 16.2.8.3. SWOT Analysis
- 16.2.8.4. Recent Developments
- 16.2.8.5. Financials (Based on Availability)
- 16.2.9 General Electric Company (GE Healthcare)
- 16.2.9.1. Overview
- 16.2.9.2. Products
- 16.2.9.3. SWOT Analysis
- 16.2.9.4. Recent Developments
- 16.2.9.5. Financials (Based on Availability)
- 16.2.10 Shimadzu Corporation
- 16.2.10.1. Overview
- 16.2.10.2. Products
- 16.2.10.3. SWOT Analysis
- 16.2.10.4. Recent Developments
- 16.2.10.5. Financials (Based on Availability)
- 16.2.11 Fujifilm Holdings Corporation
- 16.2.11.1. Overview
- 16.2.11.2. Products
- 16.2.11.3. SWOT Analysis
- 16.2.11.4. Recent Developments
- 16.2.11.5. Financials (Based on Availability)
- 16.2.1 Samsung Electronics Co Ltd (Samsung Healthcare)
List of Figures
- Figure 1: Global Digital X-ray Devices Market Revenue Breakdown (Million, %) by Region 2024 & 2032
- Figure 2: Global Digital X-ray Devices Market Volume Breakdown (K Unit, %) by Region 2024 & 2032
- Figure 3: North America Digital X-ray Devices Market Revenue (Million), by Country 2024 & 2032
- Figure 4: North America Digital X-ray Devices Market Volume (K Unit), by Country 2024 & 2032
- Figure 5: North America Digital X-ray Devices Market Revenue Share (%), by Country 2024 & 2032
- Figure 6: North America Digital X-ray Devices Market Volume Share (%), by Country 2024 & 2032
- Figure 7: Europe Digital X-ray Devices Market Revenue (Million), by Country 2024 & 2032
- Figure 8: Europe Digital X-ray Devices Market Volume (K Unit), by Country 2024 & 2032
- Figure 9: Europe Digital X-ray Devices Market Revenue Share (%), by Country 2024 & 2032
- Figure 10: Europe Digital X-ray Devices Market Volume Share (%), by Country 2024 & 2032
- Figure 11: Asia Pacific Digital X-ray Devices Market Revenue (Million), by Country 2024 & 2032
- Figure 12: Asia Pacific Digital X-ray Devices Market Volume (K Unit), by Country 2024 & 2032
- Figure 13: Asia Pacific Digital X-ray Devices Market Revenue Share (%), by Country 2024 & 2032
- Figure 14: Asia Pacific Digital X-ray Devices Market Volume Share (%), by Country 2024 & 2032
- Figure 15: South America Digital X-ray Devices Market Revenue (Million), by Country 2024 & 2032
- Figure 16: South America Digital X-ray Devices Market Volume (K Unit), by Country 2024 & 2032
- Figure 17: South America Digital X-ray Devices Market Revenue Share (%), by Country 2024 & 2032
- Figure 18: South America Digital X-ray Devices Market Volume Share (%), by Country 2024 & 2032
- Figure 19: Middle East and Africa Digital X-ray Devices Market Revenue (Million), by Country 2024 & 2032
- Figure 20: Middle East and Africa Digital X-ray Devices Market Volume (K Unit), by Country 2024 & 2032
- Figure 21: Middle East and Africa Digital X-ray Devices Market Revenue Share (%), by Country 2024 & 2032
- Figure 22: Middle East and Africa Digital X-ray Devices Market Volume Share (%), by Country 2024 & 2032
- Figure 23: North America Digital X-ray Devices Market Revenue (Million), by Application 2024 & 2032
- Figure 24: North America Digital X-ray Devices Market Volume (K Unit), by Application 2024 & 2032
- Figure 25: North America Digital X-ray Devices Market Revenue Share (%), by Application 2024 & 2032
- Figure 26: North America Digital X-ray Devices Market Volume Share (%), by Application 2024 & 2032
- Figure 27: North America Digital X-ray Devices Market Revenue (Million), by Technology 2024 & 2032
- Figure 28: North America Digital X-ray Devices Market Volume (K Unit), by Technology 2024 & 2032
- Figure 29: North America Digital X-ray Devices Market Revenue Share (%), by Technology 2024 & 2032
- Figure 30: North America Digital X-ray Devices Market Volume Share (%), by Technology 2024 & 2032
- Figure 31: North America Digital X-ray Devices Market Revenue (Million), by Portability 2024 & 2032
- Figure 32: North America Digital X-ray Devices Market Volume (K Unit), by Portability 2024 & 2032
- Figure 33: North America Digital X-ray Devices Market Revenue Share (%), by Portability 2024 & 2032
- Figure 34: North America Digital X-ray Devices Market Volume Share (%), by Portability 2024 & 2032
- Figure 35: North America Digital X-ray Devices Market Revenue (Million), by End User 2024 & 2032
- Figure 36: North America Digital X-ray Devices Market Volume (K Unit), by End User 2024 & 2032
- Figure 37: North America Digital X-ray Devices Market Revenue Share (%), by End User 2024 & 2032
- Figure 38: North America Digital X-ray Devices Market Volume Share (%), by End User 2024 & 2032
- Figure 39: North America Digital X-ray Devices Market Revenue (Million), by Country 2024 & 2032
- Figure 40: North America Digital X-ray Devices Market Volume (K Unit), by Country 2024 & 2032
- Figure 41: North America Digital X-ray Devices Market Revenue Share (%), by Country 2024 & 2032
- Figure 42: North America Digital X-ray Devices Market Volume Share (%), by Country 2024 & 2032
- Figure 43: Europe Digital X-ray Devices Market Revenue (Million), by Application 2024 & 2032
- Figure 44: Europe Digital X-ray Devices Market Volume (K Unit), by Application 2024 & 2032
- Figure 45: Europe Digital X-ray Devices Market Revenue Share (%), by Application 2024 & 2032
- Figure 46: Europe Digital X-ray Devices Market Volume Share (%), by Application 2024 & 2032
- Figure 47: Europe Digital X-ray Devices Market Revenue (Million), by Technology 2024 & 2032
- Figure 48: Europe Digital X-ray Devices Market Volume (K Unit), by Technology 2024 & 2032
- Figure 49: Europe Digital X-ray Devices Market Revenue Share (%), by Technology 2024 & 2032
- Figure 50: Europe Digital X-ray Devices Market Volume Share (%), by Technology 2024 & 2032
- Figure 51: Europe Digital X-ray Devices Market Revenue (Million), by Portability 2024 & 2032
- Figure 52: Europe Digital X-ray Devices Market Volume (K Unit), by Portability 2024 & 2032
- Figure 53: Europe Digital X-ray Devices Market Revenue Share (%), by Portability 2024 & 2032
- Figure 54: Europe Digital X-ray Devices Market Volume Share (%), by Portability 2024 & 2032
- Figure 55: Europe Digital X-ray Devices Market Revenue (Million), by End User 2024 & 2032
- Figure 56: Europe Digital X-ray Devices Market Volume (K Unit), by End User 2024 & 2032
- Figure 57: Europe Digital X-ray Devices Market Revenue Share (%), by End User 2024 & 2032
- Figure 58: Europe Digital X-ray Devices Market Volume Share (%), by End User 2024 & 2032
- Figure 59: Europe Digital X-ray Devices Market Revenue (Million), by Country 2024 & 2032
- Figure 60: Europe Digital X-ray Devices Market Volume (K Unit), by Country 2024 & 2032
- Figure 61: Europe Digital X-ray Devices Market Revenue Share (%), by Country 2024 & 2032
- Figure 62: Europe Digital X-ray Devices Market Volume Share (%), by Country 2024 & 2032
- Figure 63: Asia Pacific Digital X-ray Devices Market Revenue (Million), by Application 2024 & 2032
- Figure 64: Asia Pacific Digital X-ray Devices Market Volume (K Unit), by Application 2024 & 2032
- Figure 65: Asia Pacific Digital X-ray Devices Market Revenue Share (%), by Application 2024 & 2032
- Figure 66: Asia Pacific Digital X-ray Devices Market Volume Share (%), by Application 2024 & 2032
- Figure 67: Asia Pacific Digital X-ray Devices Market Revenue (Million), by Technology 2024 & 2032
- Figure 68: Asia Pacific Digital X-ray Devices Market Volume (K Unit), by Technology 2024 & 2032
- Figure 69: Asia Pacific Digital X-ray Devices Market Revenue Share (%), by Technology 2024 & 2032
- Figure 70: Asia Pacific Digital X-ray Devices Market Volume Share (%), by Technology 2024 & 2032
- Figure 71: Asia Pacific Digital X-ray Devices Market Revenue (Million), by Portability 2024 & 2032
- Figure 72: Asia Pacific Digital X-ray Devices Market Volume (K Unit), by Portability 2024 & 2032
- Figure 73: Asia Pacific Digital X-ray Devices Market Revenue Share (%), by Portability 2024 & 2032
- Figure 74: Asia Pacific Digital X-ray Devices Market Volume Share (%), by Portability 2024 & 2032
- Figure 75: Asia Pacific Digital X-ray Devices Market Revenue (Million), by End User 2024 & 2032
- Figure 76: Asia Pacific Digital X-ray Devices Market Volume (K Unit), by End User 2024 & 2032
- Figure 77: Asia Pacific Digital X-ray Devices Market Revenue Share (%), by End User 2024 & 2032
- Figure 78: Asia Pacific Digital X-ray Devices Market Volume Share (%), by End User 2024 & 2032
- Figure 79: Asia Pacific Digital X-ray Devices Market Revenue (Million), by Country 2024 & 2032
- Figure 80: Asia Pacific Digital X-ray Devices Market Volume (K Unit), by Country 2024 & 2032
- Figure 81: Asia Pacific Digital X-ray Devices Market Revenue Share (%), by Country 2024 & 2032
- Figure 82: Asia Pacific Digital X-ray Devices Market Volume Share (%), by Country 2024 & 2032
- Figure 83: Middle East and Africa Digital X-ray Devices Market Revenue (Million), by Application 2024 & 2032
- Figure 84: Middle East and Africa Digital X-ray Devices Market Volume (K Unit), by Application 2024 & 2032
- Figure 85: Middle East and Africa Digital X-ray Devices Market Revenue Share (%), by Application 2024 & 2032
- Figure 86: Middle East and Africa Digital X-ray Devices Market Volume Share (%), by Application 2024 & 2032
- Figure 87: Middle East and Africa Digital X-ray Devices Market Revenue (Million), by Technology 2024 & 2032
- Figure 88: Middle East and Africa Digital X-ray Devices Market Volume (K Unit), by Technology 2024 & 2032
- Figure 89: Middle East and Africa Digital X-ray Devices Market Revenue Share (%), by Technology 2024 & 2032
- Figure 90: Middle East and Africa Digital X-ray Devices Market Volume Share (%), by Technology 2024 & 2032
- Figure 91: Middle East and Africa Digital X-ray Devices Market Revenue (Million), by Portability 2024 & 2032
- Figure 92: Middle East and Africa Digital X-ray Devices Market Volume (K Unit), by Portability 2024 & 2032
- Figure 93: Middle East and Africa Digital X-ray Devices Market Revenue Share (%), by Portability 2024 & 2032
- Figure 94: Middle East and Africa Digital X-ray Devices Market Volume Share (%), by Portability 2024 & 2032
- Figure 95: Middle East and Africa Digital X-ray Devices Market Revenue (Million), by End User 2024 & 2032
- Figure 96: Middle East and Africa Digital X-ray Devices Market Volume (K Unit), by End User 2024 & 2032
- Figure 97: Middle East and Africa Digital X-ray Devices Market Revenue Share (%), by End User 2024 & 2032
- Figure 98: Middle East and Africa Digital X-ray Devices Market Volume Share (%), by End User 2024 & 2032
- Figure 99: Middle East and Africa Digital X-ray Devices Market Revenue (Million), by Country 2024 & 2032
- Figure 100: Middle East and Africa Digital X-ray Devices Market Volume (K Unit), by Country 2024 & 2032
- Figure 101: Middle East and Africa Digital X-ray Devices Market Revenue Share (%), by Country 2024 & 2032
- Figure 102: Middle East and Africa Digital X-ray Devices Market Volume Share (%), by Country 2024 & 2032
- Figure 103: South America Digital X-ray Devices Market Revenue (Million), by Application 2024 & 2032
- Figure 104: South America Digital X-ray Devices Market Volume (K Unit), by Application 2024 & 2032
- Figure 105: South America Digital X-ray Devices Market Revenue Share (%), by Application 2024 & 2032
- Figure 106: South America Digital X-ray Devices Market Volume Share (%), by Application 2024 & 2032
- Figure 107: South America Digital X-ray Devices Market Revenue (Million), by Technology 2024 & 2032
- Figure 108: South America Digital X-ray Devices Market Volume (K Unit), by Technology 2024 & 2032
- Figure 109: South America Digital X-ray Devices Market Revenue Share (%), by Technology 2024 & 2032
- Figure 110: South America Digital X-ray Devices Market Volume Share (%), by Technology 2024 & 2032
- Figure 111: South America Digital X-ray Devices Market Revenue (Million), by Portability 2024 & 2032
- Figure 112: South America Digital X-ray Devices Market Volume (K Unit), by Portability 2024 & 2032
- Figure 113: South America Digital X-ray Devices Market Revenue Share (%), by Portability 2024 & 2032
- Figure 114: South America Digital X-ray Devices Market Volume Share (%), by Portability 2024 & 2032
- Figure 115: South America Digital X-ray Devices Market Revenue (Million), by End User 2024 & 2032
- Figure 116: South America Digital X-ray Devices Market Volume (K Unit), by End User 2024 & 2032
- Figure 117: South America Digital X-ray Devices Market Revenue Share (%), by End User 2024 & 2032
- Figure 118: South America Digital X-ray Devices Market Volume Share (%), by End User 2024 & 2032
- Figure 119: South America Digital X-ray Devices Market Revenue (Million), by Country 2024 & 2032
- Figure 120: South America Digital X-ray Devices Market Volume (K Unit), by Country 2024 & 2032
- Figure 121: South America Digital X-ray Devices Market Revenue Share (%), by Country 2024 & 2032
- Figure 122: South America Digital X-ray Devices Market Volume Share (%), by Country 2024 & 2032
List of Tables
- Table 1: Global Digital X-ray Devices Market Revenue Million Forecast, by Region 2019 & 2032
- Table 2: Global Digital X-ray Devices Market Volume K Unit Forecast, by Region 2019 & 2032
- Table 3: Global Digital X-ray Devices Market Revenue Million Forecast, by Application 2019 & 2032
- Table 4: Global Digital X-ray Devices Market Volume K Unit Forecast, by Application 2019 & 2032
- Table 5: Global Digital X-ray Devices Market Revenue Million Forecast, by Technology 2019 & 2032
- Table 6: Global Digital X-ray Devices Market Volume K Unit Forecast, by Technology 2019 & 2032
- Table 7: Global Digital X-ray Devices Market Revenue Million Forecast, by Portability 2019 & 2032
- Table 8: Global Digital X-ray Devices Market Volume K Unit Forecast, by Portability 2019 & 2032
- Table 9: Global Digital X-ray Devices Market Revenue Million Forecast, by End User 2019 & 2032
- Table 10: Global Digital X-ray Devices Market Volume K Unit Forecast, by End User 2019 & 2032
- Table 11: Global Digital X-ray Devices Market Revenue Million Forecast, by Region 2019 & 2032
- Table 12: Global Digital X-ray Devices Market Volume K Unit Forecast, by Region 2019 & 2032
- Table 13: Global Digital X-ray Devices Market Revenue Million Forecast, by Country 2019 & 2032
- Table 14: Global Digital X-ray Devices Market Volume K Unit Forecast, by Country 2019 & 2032
- Table 15: United States Digital X-ray Devices Market Revenue (Million) Forecast, by Application 2019 & 2032
- Table 16: United States Digital X-ray Devices Market Volume (K Unit) Forecast, by Application 2019 & 2032
- Table 17: Canada Digital X-ray Devices Market Revenue (Million) Forecast, by Application 2019 & 2032
- Table 18: Canada Digital X-ray Devices Market Volume (K Unit) Forecast, by Application 2019 & 2032
- Table 19: Mexico Digital X-ray Devices Market Revenue (Million) Forecast, by Application 2019 & 2032
- Table 20: Mexico Digital X-ray Devices Market Volume (K Unit) Forecast, by Application 2019 & 2032
- Table 21: Global Digital X-ray Devices Market Revenue Million Forecast, by Country 2019 & 2032
- Table 22: Global Digital X-ray Devices Market Volume K Unit Forecast, by Country 2019 & 2032
- Table 23: Germany Digital X-ray Devices Market Revenue (Million) Forecast, by Application 2019 & 2032
- Table 24: Germany Digital X-ray Devices Market Volume (K Unit) Forecast, by Application 2019 & 2032
- Table 25: United Kingdom Digital X-ray Devices Market Revenue (Million) Forecast, by Application 2019 & 2032
- Table 26: United Kingdom Digital X-ray Devices Market Volume (K Unit) Forecast, by Application 2019 & 2032
- Table 27: France Digital X-ray Devices Market Revenue (Million) Forecast, by Application 2019 & 2032
- Table 28: France Digital X-ray Devices Market Volume (K Unit) Forecast, by Application 2019 & 2032
- Table 29: Italy Digital X-ray Devices Market Revenue (Million) Forecast, by Application 2019 & 2032
- Table 30: Italy Digital X-ray Devices Market Volume (K Unit) Forecast, by Application 2019 & 2032
- Table 31: Spain Digital X-ray Devices Market Revenue (Million) Forecast, by Application 2019 & 2032
- Table 32: Spain Digital X-ray Devices Market Volume (K Unit) Forecast, by Application 2019 & 2032
- Table 33: Rest of Europe Digital X-ray Devices Market Revenue (Million) Forecast, by Application 2019 & 2032
- Table 34: Rest of Europe Digital X-ray Devices Market Volume (K Unit) Forecast, by Application 2019 & 2032
- Table 35: Global Digital X-ray Devices Market Revenue Million Forecast, by Country 2019 & 2032
- Table 36: Global Digital X-ray Devices Market Volume K Unit Forecast, by Country 2019 & 2032
- Table 37: China Digital X-ray Devices Market Revenue (Million) Forecast, by Application 2019 & 2032
- Table 38: China Digital X-ray Devices Market Volume (K Unit) Forecast, by Application 2019 & 2032
- Table 39: Japan Digital X-ray Devices Market Revenue (Million) Forecast, by Application 2019 & 2032
- Table 40: Japan Digital X-ray Devices Market Volume (K Unit) Forecast, by Application 2019 & 2032
- Table 41: India Digital X-ray Devices Market Revenue (Million) Forecast, by Application 2019 & 2032
- Table 42: India Digital X-ray Devices Market Volume (K Unit) Forecast, by Application 2019 & 2032
- Table 43: Australia Digital X-ray Devices Market Revenue (Million) Forecast, by Application 2019 & 2032
- Table 44: Australia Digital X-ray Devices Market Volume (K Unit) Forecast, by Application 2019 & 2032
- Table 45: South Korea Digital X-ray Devices Market Revenue (Million) Forecast, by Application 2019 & 2032
- Table 46: South Korea Digital X-ray Devices Market Volume (K Unit) Forecast, by Application 2019 & 2032
- Table 47: Rest of Asia Pacific Digital X-ray Devices Market Revenue (Million) Forecast, by Application 2019 & 2032
- Table 48: Rest of Asia Pacific Digital X-ray Devices Market Volume (K Unit) Forecast, by Application 2019 & 2032
- Table 49: Global Digital X-ray Devices Market Revenue Million Forecast, by Country 2019 & 2032
- Table 50: Global Digital X-ray Devices Market Volume K Unit Forecast, by Country 2019 & 2032
- Table 51: Brazil Digital X-ray Devices Market Revenue (Million) Forecast, by Application 2019 & 2032
- Table 52: Brazil Digital X-ray Devices Market Volume (K Unit) Forecast, by Application 2019 & 2032
- Table 53: Argentina Digital X-ray Devices Market Revenue (Million) Forecast, by Application 2019 & 2032
- Table 54: Argentina Digital X-ray Devices Market Volume (K Unit) Forecast, by Application 2019 & 2032
- Table 55: Rest of South America Digital X-ray Devices Market Revenue (Million) Forecast, by Application 2019 & 2032
- Table 56: Rest of South America Digital X-ray Devices Market Volume (K Unit) Forecast, by Application 2019 & 2032
- Table 57: Global Digital X-ray Devices Market Revenue Million Forecast, by Country 2019 & 2032
- Table 58: Global Digital X-ray Devices Market Volume K Unit Forecast, by Country 2019 & 2032
- Table 59: GCC Digital X-ray Devices Market Revenue (Million) Forecast, by Application 2019 & 2032
- Table 60: GCC Digital X-ray Devices Market Volume (K Unit) Forecast, by Application 2019 & 2032
- Table 61: South Africa Digital X-ray Devices Market Revenue (Million) Forecast, by Application 2019 & 2032
- Table 62: South Africa Digital X-ray Devices Market Volume (K Unit) Forecast, by Application 2019 & 2032
- Table 63: Rest of Middle East and Africa Digital X-ray Devices Market Revenue (Million) Forecast, by Application 2019 & 2032
- Table 64: Rest of Middle East and Africa Digital X-ray Devices Market Volume (K Unit) Forecast, by Application 2019 & 2032
- Table 65: Global Digital X-ray Devices Market Revenue Million Forecast, by Application 2019 & 2032
- Table 66: Global Digital X-ray Devices Market Volume K Unit Forecast, by Application 2019 & 2032
- Table 67: Global Digital X-ray Devices Market Revenue Million Forecast, by Technology 2019 & 2032
- Table 68: Global Digital X-ray Devices Market Volume K Unit Forecast, by Technology 2019 & 2032
- Table 69: Global Digital X-ray Devices Market Revenue Million Forecast, by Portability 2019 & 2032
- Table 70: Global Digital X-ray Devices Market Volume K Unit Forecast, by Portability 2019 & 2032
- Table 71: Global Digital X-ray Devices Market Revenue Million Forecast, by End User 2019 & 2032
- Table 72: Global Digital X-ray Devices Market Volume K Unit Forecast, by End User 2019 & 2032
- Table 73: Global Digital X-ray Devices Market Revenue Million Forecast, by Country 2019 & 2032
- Table 74: Global Digital X-ray Devices Market Volume K Unit Forecast, by Country 2019 & 2032
- Table 75: United States Digital X-ray Devices Market Revenue (Million) Forecast, by Application 2019 & 2032
- Table 76: United States Digital X-ray Devices Market Volume (K Unit) Forecast, by Application 2019 & 2032
- Table 77: Canada Digital X-ray Devices Market Revenue (Million) Forecast, by Application 2019 & 2032
- Table 78: Canada Digital X-ray Devices Market Volume (K Unit) Forecast, by Application 2019 & 2032
- Table 79: Mexico Digital X-ray Devices Market Revenue (Million) Forecast, by Application 2019 & 2032
- Table 80: Mexico Digital X-ray Devices Market Volume (K Unit) Forecast, by Application 2019 & 2032
- Table 81: Global Digital X-ray Devices Market Revenue Million Forecast, by Application 2019 & 2032
- Table 82: Global Digital X-ray Devices Market Volume K Unit Forecast, by Application 2019 & 2032
- Table 83: Global Digital X-ray Devices Market Revenue Million Forecast, by Technology 2019 & 2032
- Table 84: Global Digital X-ray Devices Market Volume K Unit Forecast, by Technology 2019 & 2032
- Table 85: Global Digital X-ray Devices Market Revenue Million Forecast, by Portability 2019 & 2032
- Table 86: Global Digital X-ray Devices Market Volume K Unit Forecast, by Portability 2019 & 2032
- Table 87: Global Digital X-ray Devices Market Revenue Million Forecast, by End User 2019 & 2032
- Table 88: Global Digital X-ray Devices Market Volume K Unit Forecast, by End User 2019 & 2032
- Table 89: Global Digital X-ray Devices Market Revenue Million Forecast, by Country 2019 & 2032
- Table 90: Global Digital X-ray Devices Market Volume K Unit Forecast, by Country 2019 & 2032
- Table 91: Germany Digital X-ray Devices Market Revenue (Million) Forecast, by Application 2019 & 2032
- Table 92: Germany Digital X-ray Devices Market Volume (K Unit) Forecast, by Application 2019 & 2032
- Table 93: United Kingdom Digital X-ray Devices Market Revenue (Million) Forecast, by Application 2019 & 2032
- Table 94: United Kingdom Digital X-ray Devices Market Volume (K Unit) Forecast, by Application 2019 & 2032
- Table 95: France Digital X-ray Devices Market Revenue (Million) Forecast, by Application 2019 & 2032
- Table 96: France Digital X-ray Devices Market Volume (K Unit) Forecast, by Application 2019 & 2032
- Table 97: Italy Digital X-ray Devices Market Revenue (Million) Forecast, by Application 2019 & 2032
- Table 98: Italy Digital X-ray Devices Market Volume (K Unit) Forecast, by Application 2019 & 2032
- Table 99: Spain Digital X-ray Devices Market Revenue (Million) Forecast, by Application 2019 & 2032
- Table 100: Spain Digital X-ray Devices Market Volume (K Unit) Forecast, by Application 2019 & 2032
- Table 101: Rest of Europe Digital X-ray Devices Market Revenue (Million) Forecast, by Application 2019 & 2032
- Table 102: Rest of Europe Digital X-ray Devices Market Volume (K Unit) Forecast, by Application 2019 & 2032
- Table 103: Global Digital X-ray Devices Market Revenue Million Forecast, by Application 2019 & 2032
- Table 104: Global Digital X-ray Devices Market Volume K Unit Forecast, by Application 2019 & 2032
- Table 105: Global Digital X-ray Devices Market Revenue Million Forecast, by Technology 2019 & 2032
- Table 106: Global Digital X-ray Devices Market Volume K Unit Forecast, by Technology 2019 & 2032
- Table 107: Global Digital X-ray Devices Market Revenue Million Forecast, by Portability 2019 & 2032
- Table 108: Global Digital X-ray Devices Market Volume K Unit Forecast, by Portability 2019 & 2032
- Table 109: Global Digital X-ray Devices Market Revenue Million Forecast, by End User 2019 & 2032
- Table 110: Global Digital X-ray Devices Market Volume K Unit Forecast, by End User 2019 & 2032
- Table 111: Global Digital X-ray Devices Market Revenue Million Forecast, by Country 2019 & 2032
- Table 112: Global Digital X-ray Devices Market Volume K Unit Forecast, by Country 2019 & 2032
- Table 113: China Digital X-ray Devices Market Revenue (Million) Forecast, by Application 2019 & 2032
- Table 114: China Digital X-ray Devices Market Volume (K Unit) Forecast, by Application 2019 & 2032
- Table 115: Japan Digital X-ray Devices Market Revenue (Million) Forecast, by Application 2019 & 2032
- Table 116: Japan Digital X-ray Devices Market Volume (K Unit) Forecast, by Application 2019 & 2032
- Table 117: India Digital X-ray Devices Market Revenue (Million) Forecast, by Application 2019 & 2032
- Table 118: India Digital X-ray Devices Market Volume (K Unit) Forecast, by Application 2019 & 2032
- Table 119: Australia Digital X-ray Devices Market Revenue (Million) Forecast, by Application 2019 & 2032
- Table 120: Australia Digital X-ray Devices Market Volume (K Unit) Forecast, by Application 2019 & 2032
- Table 121: South Korea Digital X-ray Devices Market Revenue (Million) Forecast, by Application 2019 & 2032
- Table 122: South Korea Digital X-ray Devices Market Volume (K Unit) Forecast, by Application 2019 & 2032
- Table 123: Rest of Asia Pacific Digital X-ray Devices Market Revenue (Million) Forecast, by Application 2019 & 2032
- Table 124: Rest of Asia Pacific Digital X-ray Devices Market Volume (K Unit) Forecast, by Application 2019 & 2032
- Table 125: Global Digital X-ray Devices Market Revenue Million Forecast, by Application 2019 & 2032
- Table 126: Global Digital X-ray Devices Market Volume K Unit Forecast, by Application 2019 & 2032
- Table 127: Global Digital X-ray Devices Market Revenue Million Forecast, by Technology 2019 & 2032
- Table 128: Global Digital X-ray Devices Market Volume K Unit Forecast, by Technology 2019 & 2032
- Table 129: Global Digital X-ray Devices Market Revenue Million Forecast, by Portability 2019 & 2032
- Table 130: Global Digital X-ray Devices Market Volume K Unit Forecast, by Portability 2019 & 2032
- Table 131: Global Digital X-ray Devices Market Revenue Million Forecast, by End User 2019 & 2032
- Table 132: Global Digital X-ray Devices Market Volume K Unit Forecast, by End User 2019 & 2032
- Table 133: Global Digital X-ray Devices Market Revenue Million Forecast, by Country 2019 & 2032
- Table 134: Global Digital X-ray Devices Market Volume K Unit Forecast, by Country 2019 & 2032
- Table 135: GCC Digital X-ray Devices Market Revenue (Million) Forecast, by Application 2019 & 2032
- Table 136: GCC Digital X-ray Devices Market Volume (K Unit) Forecast, by Application 2019 & 2032
- Table 137: South Africa Digital X-ray Devices Market Revenue (Million) Forecast, by Application 2019 & 2032
- Table 138: South Africa Digital X-ray Devices Market Volume (K Unit) Forecast, by Application 2019 & 2032
- Table 139: Rest of Middle East and Africa Digital X-ray Devices Market Revenue (Million) Forecast, by Application 2019 & 2032
- Table 140: Rest of Middle East and Africa Digital X-ray Devices Market Volume (K Unit) Forecast, by Application 2019 & 2032
- Table 141: Global Digital X-ray Devices Market Revenue Million Forecast, by Application 2019 & 2032
- Table 142: Global Digital X-ray Devices Market Volume K Unit Forecast, by Application 2019 & 2032
- Table 143: Global Digital X-ray Devices Market Revenue Million Forecast, by Technology 2019 & 2032
- Table 144: Global Digital X-ray Devices Market Volume K Unit Forecast, by Technology 2019 & 2032
- Table 145: Global Digital X-ray Devices Market Revenue Million Forecast, by Portability 2019 & 2032
- Table 146: Global Digital X-ray Devices Market Volume K Unit Forecast, by Portability 2019 & 2032
- Table 147: Global Digital X-ray Devices Market Revenue Million Forecast, by End User 2019 & 2032
- Table 148: Global Digital X-ray Devices Market Volume K Unit Forecast, by End User 2019 & 2032
- Table 149: Global Digital X-ray Devices Market Revenue Million Forecast, by Country 2019 & 2032
- Table 150: Global Digital X-ray Devices Market Volume K Unit Forecast, by Country 2019 & 2032
- Table 151: Brazil Digital X-ray Devices Market Revenue (Million) Forecast, by Application 2019 & 2032
- Table 152: Brazil Digital X-ray Devices Market Volume (K Unit) Forecast, by Application 2019 & 2032
- Table 153: Argentina Digital X-ray Devices Market Revenue (Million) Forecast, by Application 2019 & 2032
- Table 154: Argentina Digital X-ray Devices Market Volume (K Unit) Forecast, by Application 2019 & 2032
- Table 155: Rest of South America Digital X-ray Devices Market Revenue (Million) Forecast, by Application 2019 & 2032
- Table 156: Rest of South America Digital X-ray Devices Market Volume (K Unit) Forecast, by Application 2019 & 2032
Frequently Asked Questions
1. What is the projected Compound Annual Growth Rate (CAGR) of the Digital X-ray Devices Market?
The projected CAGR is approximately 8.08%.
2. Which companies are prominent players in the Digital X-ray Devices Market?
Key companies in the market include Samsung Electronics Co Ltd (Samsung Healthcare), Siemens Healthcare GmbH, Agfa-Gevaert Group, Hologic Inc, Hitachi Ltd, Koninklijke Philips N V, Canon Medical Systems Corporation (Toshiba Corporation), Carestream Health, General Electric Company (GE Healthcare), Shimadzu Corporation, Fujifilm Holdings Corporation.
3. What are the main segments of the Digital X-ray Devices Market?
The market segments include Application, Technology, Portability, End User.
4. Can you provide details about the market size?
The market size is estimated to be USD 13.90 Million as of 2022.
5. What are some drivers contributing to market growth?
Increasing Occurrence of Orthopedic and other Chronic Diseases; Advantages of Digital X-ray Systems Over Conventional X-rays; Technological Advancements.
6. What are the notable trends driving market growth?
Portable Systems Segment is Expected to Dominate the Market Over the Forecast Period.
7. Are there any restraints impacting market growth?
High Initial Cost of Installation and High Device Cost.
8. Can you provide examples of recent developments in the market?
In July 2022, Fujifilm announced the United States launch of the FDR Cross, an innovative hybrid c-arm and portable X-ray solution built for hospitals and ambulatory surgery centers (ASC). The dual-function c-arm is the first of its kind to offer portable fluoroscopic and radiographic imaging on a single platform, reducing the need to bring in additional imaging equipment for essential image-guided procedures.
9. What pricing options are available for accessing the report?
Pricing options include single-user, multi-user, and enterprise licenses priced at USD 4750, USD 5250, and USD 8750 respectively.
10. Is the market size provided in terms of value or volume?
The market size is provided in terms of value, measured in Million and volume, measured in K Unit.
11. Are there any specific market keywords associated with the report?
Yes, the market keyword associated with the report is "Digital X-ray Devices Market," which aids in identifying and referencing the specific market segment covered.
12. How do I determine which pricing option suits my needs best?
The pricing options vary based on user requirements and access needs. Individual users may opt for single-user licenses, while businesses requiring broader access may choose multi-user or enterprise licenses for cost-effective access to the report.
13. Are there any additional resources or data provided in the Digital X-ray Devices Market report?
While the report offers comprehensive insights, it's advisable to review the specific contents or supplementary materials provided to ascertain if additional resources or data are available.
14. How can I stay updated on further developments or reports in the Digital X-ray Devices Market?
To stay informed about further developments, trends, and reports in the Digital X-ray Devices Market, consider subscribing to industry newsletters, following relevant companies and organizations, or regularly checking reputable industry news sources and publications.
Methodology
Step 1 - Identification of Relevant Samples Size from Population Database


Step 2 - Approaches for Defining Global Market Size (Value, Volume* & Price*)

Note*: In applicable scenarios
Step 3 - Data Sources
Primary Research
- Web Analytics
- Survey Reports
- Research Institute
- Latest Research Reports
- Opinion Leaders
Secondary Research
- Annual Reports
- White Paper
- Latest Press Release
- Industry Association
- Paid Database
- Investor Presentations

Step 4 - Data Triangulation
Involves using different sources of information in order to increase the validity of a study
These sources are likely to be stakeholders in a program - participants, other researchers, program staff, other community members, and so on.
Then we put all data in single framework & apply various statistical tools to find out the dynamic on the market.
During the analysis stage, feedback from the stakeholder groups would be compared to determine areas of agreement as well as areas of divergence


