
Key Insights
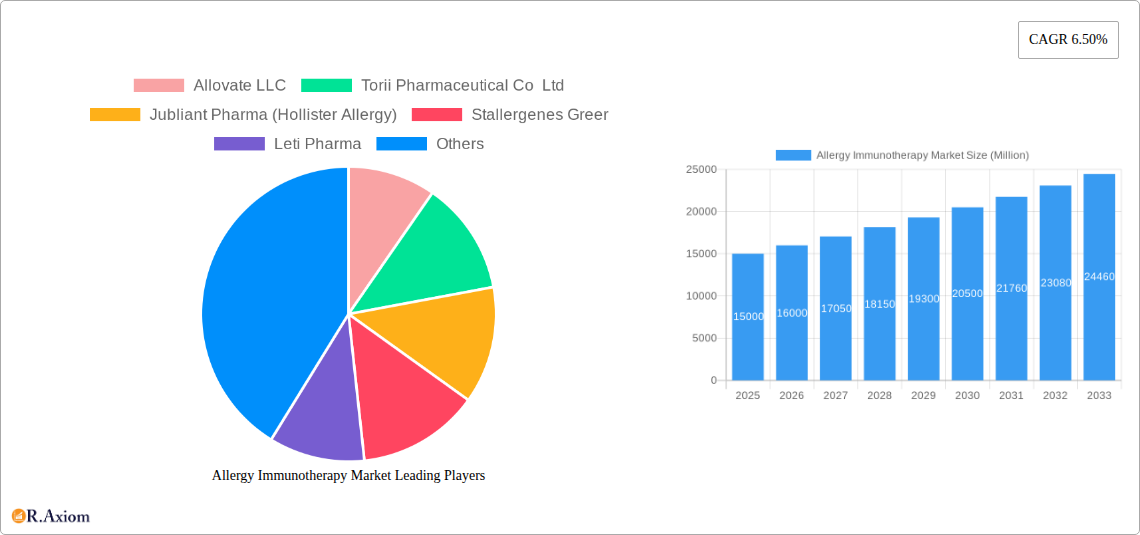
The global allergy immunotherapy market is experiencing robust growth, driven by rising prevalence of allergic diseases like allergic rhinitis, asthma, and food allergies, coupled with increasing awareness and demand for effective treatment options. The market's compound annual growth rate (CAGR) of 6.50% from 2019 to 2024 suggests a significant expansion, projected to continue into the forecast period (2025-2033). Subcutaneous immunotherapy (SCIT) currently holds a larger market share compared to sublingual immunotherapy (SLIT), attributed to its established efficacy and widespread adoption. However, SLIT is gaining traction due to its convenient administration and improved patient compliance. The North American region, particularly the United States, dominates the market due to high healthcare expenditure and advanced healthcare infrastructure. However, emerging economies in Asia-Pacific are witnessing substantial growth, fueled by rising disposable incomes and increasing healthcare awareness. Market restraints include high treatment costs, potential side effects associated with immunotherapy, and a lack of awareness in certain regions. Nevertheless, ongoing research and development focusing on novel immunotherapy approaches and improved delivery systems are expected to further propel market expansion. The key players in this market—Allovate LLC, Torii Pharmaceutical Co Ltd, Jubilant Pharma (Hollister Allergy), Stallergenes Greer, Leti Pharma, Allergy Therapeutics, HAL Allergy Group, Biomay AG, Merck KGaA (Allergopharma), and ALK-Abello A/S—are investing heavily in research and strategic partnerships to strengthen their market positions.
The segmentation by allergy type reveals allergic rhinitis as the largest segment, followed by asthma and food allergies. This is largely due to the high prevalence of these conditions globally. The "Others" segment encompasses less prevalent allergies, contributing to the overall market size. The regional analysis indicates a significant presence across North America, Europe, and Asia-Pacific, with developing economies presenting lucrative untapped opportunities. Companies are focusing on developing innovative products, expanding their geographic reach, and strengthening their distribution networks to capitalize on the growing market demand. The forecast period anticipates continued growth, driven by factors such as technological advancements, increasing research and development activities, and growing government support for allergy management programs. This indicates a promising future for allergy immunotherapy, with significant potential for market expansion and innovation.
This detailed report provides a comprehensive analysis of the Allergy Immunotherapy Market, covering market size, segmentation, growth drivers, challenges, competitive landscape, and future outlook. The study period spans from 2019 to 2033, with 2025 serving as the base and estimated year. The report offers actionable insights for industry stakeholders, including manufacturers, investors, and healthcare professionals.
Allergy Immunotherapy Market Concentration & Innovation
This section analyzes the market concentration, innovation drivers, regulatory frameworks, product substitutes, end-user trends, and M&A activities within the Allergy Immunotherapy Market. The analysis covers the period from 2019 to 2024, providing insights into the historical trends and their implications for the future.
The Allergy Immunotherapy market exhibits a moderately concentrated structure, with the top 10 players holding an estimated xx% market share in 2024. This concentration is driven by significant investments in R&D and the presence of established players with extensive distribution networks. However, the market also displays a degree of fragmentation due to the emergence of smaller companies focused on niche therapies.
Innovation Drivers:
- Advancements in immunotherapy technologies, particularly in sublingual immunotherapy (SLIT) and personalized medicine approaches.
- Growing research and development in novel allergen delivery systems and targeted therapies.
- Increased focus on developing effective treatments for challenging allergies like food allergies.
Regulatory Frameworks and Product Substitutes:
Stringent regulatory approvals and high development costs represent significant barriers to entry. However, the increasing prevalence of allergies fuels innovation and encourages regulatory bodies to streamline approval processes. Over-the-counter antihistamines and other symptomatic treatments serve as substitutes; however, immunotherapy offers a potentially curative approach.
End-User Trends and M&A Activities:
Patient preference for less invasive treatments like SLIT is driving market growth. The increasing demand for convenient and effective therapies fuels the adoption of innovative delivery systems. M&A activity has been moderate, with deal values averaging xx Million in the last five years. Consolidation among major players is expected to continue, driven by the need for broader product portfolios and geographic expansion.
Allergy Immunotherapy Market Industry Trends & Insights
This section delves into the key market trends and insights shaping the Allergy Immunotherapy Market, considering market growth drivers, technological disruptions, evolving consumer preferences, and intense competitive dynamics. The analysis covers the historical period (2019-2024) and projects the market's trajectory during the forecast period (2025-2033).
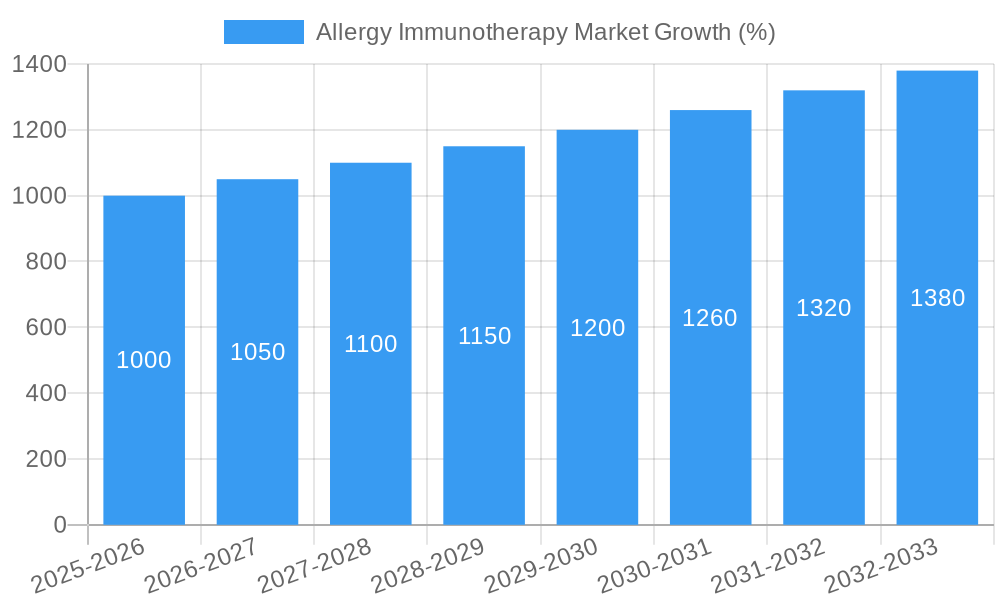
The Allergy Immunotherapy market is witnessing robust growth, with a projected CAGR of xx% during 2025-2033, driven by several factors. The rising prevalence of allergic diseases globally is a primary catalyst. Increased awareness of allergies and improved diagnosis capabilities also contribute to market expansion. Technological advancements, particularly the development of novel immunotherapy platforms, are creating new treatment options and expanding the addressable market.
Consumer preferences are shifting towards convenient and less invasive therapies, such as SLIT, fueling its market penetration. The demand for personalized medicine approaches that target specific allergens is also increasing. The competitive landscape is characterized by both established players and emerging biotech companies, leading to increased innovation and price competition. The market penetration of SLIT is expected to reach xx% by 2033, while SCIT will retain a significant share due to its established efficacy for specific allergies.
Dominant Markets & Segments in Allergy Immunotherapy Market
This section identifies the leading regions, countries, and segments within the Allergy Immunotherapy Market, focusing on allergic rhinitis, asthma, food allergy, and other allergy types, as well as subcutaneous immunotherapy (SCIT) and sublingual immunotherapy (SLIT). The analysis identifies key drivers (economic policies, infrastructure) and provides a detailed dominance analysis.
By Allergy Type:
- Allergic Rhinitis: This segment dominates the market, driven by high prevalence and the availability of effective immunotherapy options. The large patient population and consistent demand contribute significantly to market size.
- Asthma: This segment holds a substantial share, with growing adoption of immunotherapy for asthma management, particularly in conjunction with allergic rhinitis.
- Food Allergy: This is a rapidly growing segment, driven by increased awareness, improved diagnostics, and the development of novel treatments. The market potential is considerable due to the significant unmet medical need.
- Others: This segment includes other allergic conditions amenable to immunotherapy, such as insect sting allergies and eczema.
By Type of Immunotherapy:
- Subcutaneous Immunotherapy (SCIT): SCIT remains a significant segment, with established efficacy for various allergies, particularly allergic rhinitis and asthma. However, patient convenience is driving the shift towards SLIT.
- Sublingual Immunotherapy (SLIT): This segment is experiencing rapid growth, driven by its convenience and ease of administration. The increasing patient preference for home-administered therapies is driving its market penetration.
Geographic Dominance:
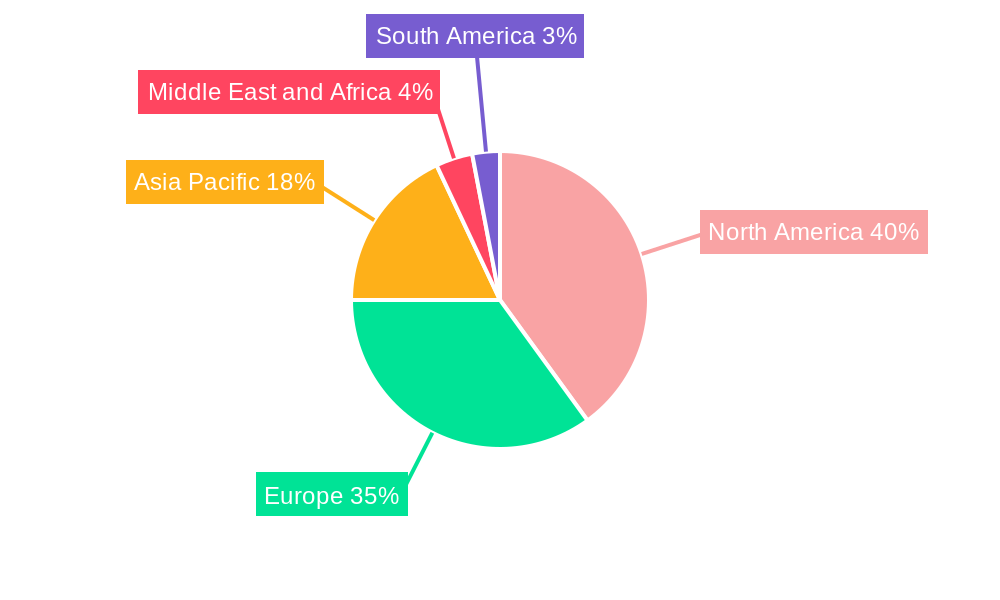
North America currently holds the largest market share, driven by high healthcare expenditure and a robust regulatory framework. However, the Asia-Pacific region is projected to experience the fastest growth, propelled by increasing healthcare investment and rising prevalence of allergic diseases. Europe also represents a significant market, with established healthcare systems and well-developed immunotherapy markets.
Allergy Immunotherapy Market Product Developments
Significant advancements in allergen immunotherapy are driving innovation and improvements in patient outcomes. New delivery systems enhance patient compliance and efficacy. Personalized immunotherapy approaches, tailored to specific patient needs and allergen profiles, are gaining momentum. The development of novel immunotherapy platforms, addressing limitations of existing therapies, is another significant development. This focus on innovation fuels competition and creates new opportunities in the Allergy Immunotherapy market.
Report Scope & Segmentation Analysis
This report provides a detailed segmentation of the Allergy Immunotherapy market.
By Allergy Type: The market is segmented by Allergic Rhinitis, Asthma, Food Allergy, and Others. Each segment's growth trajectory and competitive dynamics are examined. Allergic rhinitis exhibits the largest market size and steady growth, while food allergy shows the most rapid growth.
By Type of Immunotherapy: The report further segments the market by Subcutaneous Immunotherapy (SCIT) and Sublingual Immunotherapy (SLIT). SLIT is showing exceptional growth due to convenience and home administration potential. SCIT remains prominent but may slow in growth compared to SLIT.
Key Drivers of Allergy Immunotherapy Market Growth
Several factors drive the growth of the Allergy Immunotherapy Market. The rising prevalence of allergic diseases is a significant factor, alongside increased healthcare spending and improved diagnostic capabilities. Technological advancements, such as the development of novel delivery systems and personalized therapies, are also key drivers. Favorable regulatory frameworks and growing patient awareness are further contributing to market expansion.
Challenges in the Allergy Immunotherapy Market Sector
The Allergy Immunotherapy market faces several challenges. High development costs and stringent regulatory requirements act as barriers to entry for new players. Adverse reactions, although rare, can impact market acceptance. Competition from established players and the emergence of alternative treatment options also pose challenges. Supply chain disruptions, particularly regarding allergen extracts, can cause shortages and price fluctuations, thus impacting market stability.
Emerging Opportunities in Allergy Immunotherapy Market
Emerging opportunities in the Allergy Immunotherapy market include the development of novel therapies for challenging allergies, particularly food allergies. Personalized medicine approaches, tailored to individual patient needs, represent a significant opportunity. The expansion into new markets, particularly in developing economies, offers significant growth potential. Further innovation in delivery systems, focusing on convenience and patient compliance, is also expected to generate new opportunities.
Leading Players in the Allergy Immunotherapy Market Market
- Allovate LLC
- Torii Pharmaceutical Co Ltd
- Jubliant Pharma (Hollister Allergy)
- Stallergenes Greer
- Leti Pharma
- Allergy Therapeutics
- HAL Allergy Group
- Biomay AG
- Merck KGaA (Allergopharma)
- ALK-Abello A/S
Key Developments in Allergy Immunotherapy Market Industry
- July 2022: Stallergenes Greer announced positive data on the benefits of sublingual liquid allergen immunotherapy for asthma in patients with allergic rhinitis.
- March 2022: Aravax Pty Ltd announced an IND application for Phase 2 clinical trials of PVX108, a next-generation immunotherapy for peanut allergy.
Strategic Outlook for Allergy Immunotherapy Market Market
The Allergy Immunotherapy market presents a significant growth opportunity. The rising prevalence of allergic diseases, coupled with technological advancements and increased patient awareness, will drive market expansion in the coming years. Continued innovation in delivery systems and the development of personalized therapies will further fuel market growth. Expansion into emerging markets and strategic partnerships will be crucial for players seeking to capitalize on this potential.
Allergy Immunotherapy Market Segmentation
-
1. Type of Immunotherapy
- 1.1. Subcutaneous Immunotherapy (SCIT)
- 1.2. Sublingual Immunotherapy (SLIT)
-
2. Allergy Type
- 2.1. Allergic Rhinitis
- 2.2. Asthma
- 2.3. Food Allergy
- 2.4. Others
Allergy Immunotherapy Market Segmentation By Geography
-
1. North America
- 1.1. United States
- 1.2. Canada
- 1.3. Mexico
-
2. Europe
- 2.1. Germany
- 2.2. United Kingdom
- 2.3. France
- 2.4. Italy
- 2.5. Spain
- 2.6. Rest of Europe
-
3. Asia Pacific
- 3.1. China
- 3.2. Japan
- 3.3. India
- 3.4. Australia
- 3.5. South Korea
- 3.6. Rest of Asia Pacific
-
4. Middle East and Africa
- 4.1. GCC
- 4.2. South Africa
- 4.3. Rest of Middle East and Africa
-
5. South America
- 5.1. Brazil
- 5.2. Argentina
- 5.3. Rest of South America
Allergy Immunotherapy Market REPORT HIGHLIGHTS
| Aspects | Details |
|---|---|
| Study Period | 2019-2033 |
| Base Year | 2024 |
| Estimated Year | 2025 |
| Forecast Period | 2025-2033 |
| Historical Period | 2019-2024 |
| Growth Rate | CAGR of 6.50% from 2019-2033 |
| Segmentation |
|
Table of Contents
- 1. Introduction
- 1.1. Research Scope
- 1.2. Market Segmentation
- 1.3. Research Methodology
- 1.4. Definitions and Assumptions
- 2. Executive Summary
- 2.1. Introduction
- 3. Market Dynamics
- 3.1. Introduction
- 3.2. Market Drivers
- 3.2.1. Increasing Burden of Various Types of Allergies; Launch of New Sublingual Immunotherapies in Emerging Economies
- 3.3. Market Restrains
- 3.3.1. Lack of Awareness about Allergy and Treatments
- 3.4. Market Trends
- 3.4.1. Subcutaneous Immunotherapy (SCIT) is Expected to Witness Growth Over the Forecast Period
- 4. Market Factor Analysis
- 4.1. Porters Five Forces
- 4.2. Supply/Value Chain
- 4.3. PESTEL analysis
- 4.4. Market Entropy
- 4.5. Patent/Trademark Analysis
- 5. Global Allergy Immunotherapy Market Analysis, Insights and Forecast, 2019-2031
- 5.1. Market Analysis, Insights and Forecast - by Type of Immunotherapy
- 5.1.1. Subcutaneous Immunotherapy (SCIT)
- 5.1.2. Sublingual Immunotherapy (SLIT)
- 5.2. Market Analysis, Insights and Forecast - by Allergy Type
- 5.2.1. Allergic Rhinitis
- 5.2.2. Asthma
- 5.2.3. Food Allergy
- 5.2.4. Others
- 5.3. Market Analysis, Insights and Forecast - by Region
- 5.3.1. North America
- 5.3.2. Europe
- 5.3.3. Asia Pacific
- 5.3.4. Middle East and Africa
- 5.3.5. South America
- 5.1. Market Analysis, Insights and Forecast - by Type of Immunotherapy
- 6. North America Allergy Immunotherapy Market Analysis, Insights and Forecast, 2019-2031
- 6.1. Market Analysis, Insights and Forecast - by Type of Immunotherapy
- 6.1.1. Subcutaneous Immunotherapy (SCIT)
- 6.1.2. Sublingual Immunotherapy (SLIT)
- 6.2. Market Analysis, Insights and Forecast - by Allergy Type
- 6.2.1. Allergic Rhinitis
- 6.2.2. Asthma
- 6.2.3. Food Allergy
- 6.2.4. Others
- 6.1. Market Analysis, Insights and Forecast - by Type of Immunotherapy
- 7. Europe Allergy Immunotherapy Market Analysis, Insights and Forecast, 2019-2031
- 7.1. Market Analysis, Insights and Forecast - by Type of Immunotherapy
- 7.1.1. Subcutaneous Immunotherapy (SCIT)
- 7.1.2. Sublingual Immunotherapy (SLIT)
- 7.2. Market Analysis, Insights and Forecast - by Allergy Type
- 7.2.1. Allergic Rhinitis
- 7.2.2. Asthma
- 7.2.3. Food Allergy
- 7.2.4. Others
- 7.1. Market Analysis, Insights and Forecast - by Type of Immunotherapy
- 8. Asia Pacific Allergy Immunotherapy Market Analysis, Insights and Forecast, 2019-2031
- 8.1. Market Analysis, Insights and Forecast - by Type of Immunotherapy
- 8.1.1. Subcutaneous Immunotherapy (SCIT)
- 8.1.2. Sublingual Immunotherapy (SLIT)
- 8.2. Market Analysis, Insights and Forecast - by Allergy Type
- 8.2.1. Allergic Rhinitis
- 8.2.2. Asthma
- 8.2.3. Food Allergy
- 8.2.4. Others
- 8.1. Market Analysis, Insights and Forecast - by Type of Immunotherapy
- 9. Middle East and Africa Allergy Immunotherapy Market Analysis, Insights and Forecast, 2019-2031
- 9.1. Market Analysis, Insights and Forecast - by Type of Immunotherapy
- 9.1.1. Subcutaneous Immunotherapy (SCIT)
- 9.1.2. Sublingual Immunotherapy (SLIT)
- 9.2. Market Analysis, Insights and Forecast - by Allergy Type
- 9.2.1. Allergic Rhinitis
- 9.2.2. Asthma
- 9.2.3. Food Allergy
- 9.2.4. Others
- 9.1. Market Analysis, Insights and Forecast - by Type of Immunotherapy
- 10. South America Allergy Immunotherapy Market Analysis, Insights and Forecast, 2019-2031
- 10.1. Market Analysis, Insights and Forecast - by Type of Immunotherapy
- 10.1.1. Subcutaneous Immunotherapy (SCIT)
- 10.1.2. Sublingual Immunotherapy (SLIT)
- 10.2. Market Analysis, Insights and Forecast - by Allergy Type
- 10.2.1. Allergic Rhinitis
- 10.2.2. Asthma
- 10.2.3. Food Allergy
- 10.2.4. Others
- 10.1. Market Analysis, Insights and Forecast - by Type of Immunotherapy
- 11. North America Allergy Immunotherapy Market Analysis, Insights and Forecast, 2019-2031
- 11.1. Market Analysis, Insights and Forecast - By Country/Sub-region
- 11.1.1 United States
- 11.1.2 Canada
- 11.1.3 Mexico
- 12. Europe Allergy Immunotherapy Market Analysis, Insights and Forecast, 2019-2031
- 12.1. Market Analysis, Insights and Forecast - By Country/Sub-region
- 12.1.1 Germany
- 12.1.2 United Kingdom
- 12.1.3 France
- 12.1.4 Italy
- 12.1.5 Spain
- 12.1.6 Rest of Europe
- 13. Asia Pacific Allergy Immunotherapy Market Analysis, Insights and Forecast, 2019-2031
- 13.1. Market Analysis, Insights and Forecast - By Country/Sub-region
- 13.1.1 China
- 13.1.2 Japan
- 13.1.3 India
- 13.1.4 Australia
- 13.1.5 South Korea
- 13.1.6 Rest of Asia Pacific
- 14. Middle East and Africa Allergy Immunotherapy Market Analysis, Insights and Forecast, 2019-2031
- 14.1. Market Analysis, Insights and Forecast - By Country/Sub-region
- 14.1.1 GCC
- 14.1.2 South Africa
- 14.1.3 Rest of Middle East and Africa
- 15. South America Allergy Immunotherapy Market Analysis, Insights and Forecast, 2019-2031
- 15.1. Market Analysis, Insights and Forecast - By Country/Sub-region
- 15.1.1 Brazil
- 15.1.2 Argentina
- 15.1.3 Rest of South America
- 16. Competitive Analysis
- 16.1. Global Market Share Analysis 2024
- 16.2. Company Profiles
- 16.2.1 Allovate LLC
- 16.2.1.1. Overview
- 16.2.1.2. Products
- 16.2.1.3. SWOT Analysis
- 16.2.1.4. Recent Developments
- 16.2.1.5. Financials (Based on Availability)
- 16.2.2 Torii Pharmaceutical Co Ltd
- 16.2.2.1. Overview
- 16.2.2.2. Products
- 16.2.2.3. SWOT Analysis
- 16.2.2.4. Recent Developments
- 16.2.2.5. Financials (Based on Availability)
- 16.2.3 Jubliant Pharma (Hollister Allergy)
- 16.2.3.1. Overview
- 16.2.3.2. Products
- 16.2.3.3. SWOT Analysis
- 16.2.3.4. Recent Developments
- 16.2.3.5. Financials (Based on Availability)
- 16.2.4 Stallergenes Greer
- 16.2.4.1. Overview
- 16.2.4.2. Products
- 16.2.4.3. SWOT Analysis
- 16.2.4.4. Recent Developments
- 16.2.4.5. Financials (Based on Availability)
- 16.2.5 Leti Pharma
- 16.2.5.1. Overview
- 16.2.5.2. Products
- 16.2.5.3. SWOT Analysis
- 16.2.5.4. Recent Developments
- 16.2.5.5. Financials (Based on Availability)
- 16.2.6 Allergy Therapeutics
- 16.2.6.1. Overview
- 16.2.6.2. Products
- 16.2.6.3. SWOT Analysis
- 16.2.6.4. Recent Developments
- 16.2.6.5. Financials (Based on Availability)
- 16.2.7 HAL Allergy Group
- 16.2.7.1. Overview
- 16.2.7.2. Products
- 16.2.7.3. SWOT Analysis
- 16.2.7.4. Recent Developments
- 16.2.7.5. Financials (Based on Availability)
- 16.2.8 Biomay AG
- 16.2.8.1. Overview
- 16.2.8.2. Products
- 16.2.8.3. SWOT Analysis
- 16.2.8.4. Recent Developments
- 16.2.8.5. Financials (Based on Availability)
- 16.2.9 Merck KGaA (Allergopharma)
- 16.2.9.1. Overview
- 16.2.9.2. Products
- 16.2.9.3. SWOT Analysis
- 16.2.9.4. Recent Developments
- 16.2.9.5. Financials (Based on Availability)
- 16.2.10 ALK-Abello A/S
- 16.2.10.1. Overview
- 16.2.10.2. Products
- 16.2.10.3. SWOT Analysis
- 16.2.10.4. Recent Developments
- 16.2.10.5. Financials (Based on Availability)
- 16.2.1 Allovate LLC
List of Figures
- Figure 1: Global Allergy Immunotherapy Market Revenue Breakdown (Million, %) by Region 2024 & 2032
- Figure 2: Global Allergy Immunotherapy Market Volume Breakdown (K Unit, %) by Region 2024 & 2032
- Figure 3: North America Allergy Immunotherapy Market Revenue (Million), by Country 2024 & 2032
- Figure 4: North America Allergy Immunotherapy Market Volume (K Unit), by Country 2024 & 2032
- Figure 5: North America Allergy Immunotherapy Market Revenue Share (%), by Country 2024 & 2032
- Figure 6: North America Allergy Immunotherapy Market Volume Share (%), by Country 2024 & 2032
- Figure 7: Europe Allergy Immunotherapy Market Revenue (Million), by Country 2024 & 2032
- Figure 8: Europe Allergy Immunotherapy Market Volume (K Unit), by Country 2024 & 2032
- Figure 9: Europe Allergy Immunotherapy Market Revenue Share (%), by Country 2024 & 2032
- Figure 10: Europe Allergy Immunotherapy Market Volume Share (%), by Country 2024 & 2032
- Figure 11: Asia Pacific Allergy Immunotherapy Market Revenue (Million), by Country 2024 & 2032
- Figure 12: Asia Pacific Allergy Immunotherapy Market Volume (K Unit), by Country 2024 & 2032
- Figure 13: Asia Pacific Allergy Immunotherapy Market Revenue Share (%), by Country 2024 & 2032
- Figure 14: Asia Pacific Allergy Immunotherapy Market Volume Share (%), by Country 2024 & 2032
- Figure 15: Middle East and Africa Allergy Immunotherapy Market Revenue (Million), by Country 2024 & 2032
- Figure 16: Middle East and Africa Allergy Immunotherapy Market Volume (K Unit), by Country 2024 & 2032
- Figure 17: Middle East and Africa Allergy Immunotherapy Market Revenue Share (%), by Country 2024 & 2032
- Figure 18: Middle East and Africa Allergy Immunotherapy Market Volume Share (%), by Country 2024 & 2032
- Figure 19: South America Allergy Immunotherapy Market Revenue (Million), by Country 2024 & 2032
- Figure 20: South America Allergy Immunotherapy Market Volume (K Unit), by Country 2024 & 2032
- Figure 21: South America Allergy Immunotherapy Market Revenue Share (%), by Country 2024 & 2032
- Figure 22: South America Allergy Immunotherapy Market Volume Share (%), by Country 2024 & 2032
- Figure 23: North America Allergy Immunotherapy Market Revenue (Million), by Type of Immunotherapy 2024 & 2032
- Figure 24: North America Allergy Immunotherapy Market Volume (K Unit), by Type of Immunotherapy 2024 & 2032
- Figure 25: North America Allergy Immunotherapy Market Revenue Share (%), by Type of Immunotherapy 2024 & 2032
- Figure 26: North America Allergy Immunotherapy Market Volume Share (%), by Type of Immunotherapy 2024 & 2032
- Figure 27: North America Allergy Immunotherapy Market Revenue (Million), by Allergy Type 2024 & 2032
- Figure 28: North America Allergy Immunotherapy Market Volume (K Unit), by Allergy Type 2024 & 2032
- Figure 29: North America Allergy Immunotherapy Market Revenue Share (%), by Allergy Type 2024 & 2032
- Figure 30: North America Allergy Immunotherapy Market Volume Share (%), by Allergy Type 2024 & 2032
- Figure 31: North America Allergy Immunotherapy Market Revenue (Million), by Country 2024 & 2032
- Figure 32: North America Allergy Immunotherapy Market Volume (K Unit), by Country 2024 & 2032
- Figure 33: North America Allergy Immunotherapy Market Revenue Share (%), by Country 2024 & 2032
- Figure 34: North America Allergy Immunotherapy Market Volume Share (%), by Country 2024 & 2032
- Figure 35: Europe Allergy Immunotherapy Market Revenue (Million), by Type of Immunotherapy 2024 & 2032
- Figure 36: Europe Allergy Immunotherapy Market Volume (K Unit), by Type of Immunotherapy 2024 & 2032
- Figure 37: Europe Allergy Immunotherapy Market Revenue Share (%), by Type of Immunotherapy 2024 & 2032
- Figure 38: Europe Allergy Immunotherapy Market Volume Share (%), by Type of Immunotherapy 2024 & 2032
- Figure 39: Europe Allergy Immunotherapy Market Revenue (Million), by Allergy Type 2024 & 2032
- Figure 40: Europe Allergy Immunotherapy Market Volume (K Unit), by Allergy Type 2024 & 2032
- Figure 41: Europe Allergy Immunotherapy Market Revenue Share (%), by Allergy Type 2024 & 2032
- Figure 42: Europe Allergy Immunotherapy Market Volume Share (%), by Allergy Type 2024 & 2032
- Figure 43: Europe Allergy Immunotherapy Market Revenue (Million), by Country 2024 & 2032
- Figure 44: Europe Allergy Immunotherapy Market Volume (K Unit), by Country 2024 & 2032
- Figure 45: Europe Allergy Immunotherapy Market Revenue Share (%), by Country 2024 & 2032
- Figure 46: Europe Allergy Immunotherapy Market Volume Share (%), by Country 2024 & 2032
- Figure 47: Asia Pacific Allergy Immunotherapy Market Revenue (Million), by Type of Immunotherapy 2024 & 2032
- Figure 48: Asia Pacific Allergy Immunotherapy Market Volume (K Unit), by Type of Immunotherapy 2024 & 2032
- Figure 49: Asia Pacific Allergy Immunotherapy Market Revenue Share (%), by Type of Immunotherapy 2024 & 2032
- Figure 50: Asia Pacific Allergy Immunotherapy Market Volume Share (%), by Type of Immunotherapy 2024 & 2032
- Figure 51: Asia Pacific Allergy Immunotherapy Market Revenue (Million), by Allergy Type 2024 & 2032
- Figure 52: Asia Pacific Allergy Immunotherapy Market Volume (K Unit), by Allergy Type 2024 & 2032
- Figure 53: Asia Pacific Allergy Immunotherapy Market Revenue Share (%), by Allergy Type 2024 & 2032
- Figure 54: Asia Pacific Allergy Immunotherapy Market Volume Share (%), by Allergy Type 2024 & 2032
- Figure 55: Asia Pacific Allergy Immunotherapy Market Revenue (Million), by Country 2024 & 2032
- Figure 56: Asia Pacific Allergy Immunotherapy Market Volume (K Unit), by Country 2024 & 2032
- Figure 57: Asia Pacific Allergy Immunotherapy Market Revenue Share (%), by Country 2024 & 2032
- Figure 58: Asia Pacific Allergy Immunotherapy Market Volume Share (%), by Country 2024 & 2032
- Figure 59: Middle East and Africa Allergy Immunotherapy Market Revenue (Million), by Type of Immunotherapy 2024 & 2032
- Figure 60: Middle East and Africa Allergy Immunotherapy Market Volume (K Unit), by Type of Immunotherapy 2024 & 2032
- Figure 61: Middle East and Africa Allergy Immunotherapy Market Revenue Share (%), by Type of Immunotherapy 2024 & 2032
- Figure 62: Middle East and Africa Allergy Immunotherapy Market Volume Share (%), by Type of Immunotherapy 2024 & 2032
- Figure 63: Middle East and Africa Allergy Immunotherapy Market Revenue (Million), by Allergy Type 2024 & 2032
- Figure 64: Middle East and Africa Allergy Immunotherapy Market Volume (K Unit), by Allergy Type 2024 & 2032
- Figure 65: Middle East and Africa Allergy Immunotherapy Market Revenue Share (%), by Allergy Type 2024 & 2032
- Figure 66: Middle East and Africa Allergy Immunotherapy Market Volume Share (%), by Allergy Type 2024 & 2032
- Figure 67: Middle East and Africa Allergy Immunotherapy Market Revenue (Million), by Country 2024 & 2032
- Figure 68: Middle East and Africa Allergy Immunotherapy Market Volume (K Unit), by Country 2024 & 2032
- Figure 69: Middle East and Africa Allergy Immunotherapy Market Revenue Share (%), by Country 2024 & 2032
- Figure 70: Middle East and Africa Allergy Immunotherapy Market Volume Share (%), by Country 2024 & 2032
- Figure 71: South America Allergy Immunotherapy Market Revenue (Million), by Type of Immunotherapy 2024 & 2032
- Figure 72: South America Allergy Immunotherapy Market Volume (K Unit), by Type of Immunotherapy 2024 & 2032
- Figure 73: South America Allergy Immunotherapy Market Revenue Share (%), by Type of Immunotherapy 2024 & 2032
- Figure 74: South America Allergy Immunotherapy Market Volume Share (%), by Type of Immunotherapy 2024 & 2032
- Figure 75: South America Allergy Immunotherapy Market Revenue (Million), by Allergy Type 2024 & 2032
- Figure 76: South America Allergy Immunotherapy Market Volume (K Unit), by Allergy Type 2024 & 2032
- Figure 77: South America Allergy Immunotherapy Market Revenue Share (%), by Allergy Type 2024 & 2032
- Figure 78: South America Allergy Immunotherapy Market Volume Share (%), by Allergy Type 2024 & 2032
- Figure 79: South America Allergy Immunotherapy Market Revenue (Million), by Country 2024 & 2032
- Figure 80: South America Allergy Immunotherapy Market Volume (K Unit), by Country 2024 & 2032
- Figure 81: South America Allergy Immunotherapy Market Revenue Share (%), by Country 2024 & 2032
- Figure 82: South America Allergy Immunotherapy Market Volume Share (%), by Country 2024 & 2032
List of Tables
- Table 1: Global Allergy Immunotherapy Market Revenue Million Forecast, by Region 2019 & 2032
- Table 2: Global Allergy Immunotherapy Market Volume K Unit Forecast, by Region 2019 & 2032
- Table 3: Global Allergy Immunotherapy Market Revenue Million Forecast, by Type of Immunotherapy 2019 & 2032
- Table 4: Global Allergy Immunotherapy Market Volume K Unit Forecast, by Type of Immunotherapy 2019 & 2032
- Table 5: Global Allergy Immunotherapy Market Revenue Million Forecast, by Allergy Type 2019 & 2032
- Table 6: Global Allergy Immunotherapy Market Volume K Unit Forecast, by Allergy Type 2019 & 2032
- Table 7: Global Allergy Immunotherapy Market Revenue Million Forecast, by Region 2019 & 2032
- Table 8: Global Allergy Immunotherapy Market Volume K Unit Forecast, by Region 2019 & 2032
- Table 9: Global Allergy Immunotherapy Market Revenue Million Forecast, by Country 2019 & 2032
- Table 10: Global Allergy Immunotherapy Market Volume K Unit Forecast, by Country 2019 & 2032
- Table 11: United States Allergy Immunotherapy Market Revenue (Million) Forecast, by Application 2019 & 2032
- Table 12: United States Allergy Immunotherapy Market Volume (K Unit) Forecast, by Application 2019 & 2032
- Table 13: Canada Allergy Immunotherapy Market Revenue (Million) Forecast, by Application 2019 & 2032
- Table 14: Canada Allergy Immunotherapy Market Volume (K Unit) Forecast, by Application 2019 & 2032
- Table 15: Mexico Allergy Immunotherapy Market Revenue (Million) Forecast, by Application 2019 & 2032
- Table 16: Mexico Allergy Immunotherapy Market Volume (K Unit) Forecast, by Application 2019 & 2032
- Table 17: Global Allergy Immunotherapy Market Revenue Million Forecast, by Country 2019 & 2032
- Table 18: Global Allergy Immunotherapy Market Volume K Unit Forecast, by Country 2019 & 2032
- Table 19: Germany Allergy Immunotherapy Market Revenue (Million) Forecast, by Application 2019 & 2032
- Table 20: Germany Allergy Immunotherapy Market Volume (K Unit) Forecast, by Application 2019 & 2032
- Table 21: United Kingdom Allergy Immunotherapy Market Revenue (Million) Forecast, by Application 2019 & 2032
- Table 22: United Kingdom Allergy Immunotherapy Market Volume (K Unit) Forecast, by Application 2019 & 2032
- Table 23: France Allergy Immunotherapy Market Revenue (Million) Forecast, by Application 2019 & 2032
- Table 24: France Allergy Immunotherapy Market Volume (K Unit) Forecast, by Application 2019 & 2032
- Table 25: Italy Allergy Immunotherapy Market Revenue (Million) Forecast, by Application 2019 & 2032
- Table 26: Italy Allergy Immunotherapy Market Volume (K Unit) Forecast, by Application 2019 & 2032
- Table 27: Spain Allergy Immunotherapy Market Revenue (Million) Forecast, by Application 2019 & 2032
- Table 28: Spain Allergy Immunotherapy Market Volume (K Unit) Forecast, by Application 2019 & 2032
- Table 29: Rest of Europe Allergy Immunotherapy Market Revenue (Million) Forecast, by Application 2019 & 2032
- Table 30: Rest of Europe Allergy Immunotherapy Market Volume (K Unit) Forecast, by Application 2019 & 2032
- Table 31: Global Allergy Immunotherapy Market Revenue Million Forecast, by Country 2019 & 2032
- Table 32: Global Allergy Immunotherapy Market Volume K Unit Forecast, by Country 2019 & 2032
- Table 33: China Allergy Immunotherapy Market Revenue (Million) Forecast, by Application 2019 & 2032
- Table 34: China Allergy Immunotherapy Market Volume (K Unit) Forecast, by Application 2019 & 2032
- Table 35: Japan Allergy Immunotherapy Market Revenue (Million) Forecast, by Application 2019 & 2032
- Table 36: Japan Allergy Immunotherapy Market Volume (K Unit) Forecast, by Application 2019 & 2032
- Table 37: India Allergy Immunotherapy Market Revenue (Million) Forecast, by Application 2019 & 2032
- Table 38: India Allergy Immunotherapy Market Volume (K Unit) Forecast, by Application 2019 & 2032
- Table 39: Australia Allergy Immunotherapy Market Revenue (Million) Forecast, by Application 2019 & 2032
- Table 40: Australia Allergy Immunotherapy Market Volume (K Unit) Forecast, by Application 2019 & 2032
- Table 41: South Korea Allergy Immunotherapy Market Revenue (Million) Forecast, by Application 2019 & 2032
- Table 42: South Korea Allergy Immunotherapy Market Volume (K Unit) Forecast, by Application 2019 & 2032
- Table 43: Rest of Asia Pacific Allergy Immunotherapy Market Revenue (Million) Forecast, by Application 2019 & 2032
- Table 44: Rest of Asia Pacific Allergy Immunotherapy Market Volume (K Unit) Forecast, by Application 2019 & 2032
- Table 45: Global Allergy Immunotherapy Market Revenue Million Forecast, by Country 2019 & 2032
- Table 46: Global Allergy Immunotherapy Market Volume K Unit Forecast, by Country 2019 & 2032
- Table 47: GCC Allergy Immunotherapy Market Revenue (Million) Forecast, by Application 2019 & 2032
- Table 48: GCC Allergy Immunotherapy Market Volume (K Unit) Forecast, by Application 2019 & 2032
- Table 49: South Africa Allergy Immunotherapy Market Revenue (Million) Forecast, by Application 2019 & 2032
- Table 50: South Africa Allergy Immunotherapy Market Volume (K Unit) Forecast, by Application 2019 & 2032
- Table 51: Rest of Middle East and Africa Allergy Immunotherapy Market Revenue (Million) Forecast, by Application 2019 & 2032
- Table 52: Rest of Middle East and Africa Allergy Immunotherapy Market Volume (K Unit) Forecast, by Application 2019 & 2032
- Table 53: Global Allergy Immunotherapy Market Revenue Million Forecast, by Country 2019 & 2032
- Table 54: Global Allergy Immunotherapy Market Volume K Unit Forecast, by Country 2019 & 2032
- Table 55: Brazil Allergy Immunotherapy Market Revenue (Million) Forecast, by Application 2019 & 2032
- Table 56: Brazil Allergy Immunotherapy Market Volume (K Unit) Forecast, by Application 2019 & 2032
- Table 57: Argentina Allergy Immunotherapy Market Revenue (Million) Forecast, by Application 2019 & 2032
- Table 58: Argentina Allergy Immunotherapy Market Volume (K Unit) Forecast, by Application 2019 & 2032
- Table 59: Rest of South America Allergy Immunotherapy Market Revenue (Million) Forecast, by Application 2019 & 2032
- Table 60: Rest of South America Allergy Immunotherapy Market Volume (K Unit) Forecast, by Application 2019 & 2032
- Table 61: Global Allergy Immunotherapy Market Revenue Million Forecast, by Type of Immunotherapy 2019 & 2032
- Table 62: Global Allergy Immunotherapy Market Volume K Unit Forecast, by Type of Immunotherapy 2019 & 2032
- Table 63: Global Allergy Immunotherapy Market Revenue Million Forecast, by Allergy Type 2019 & 2032
- Table 64: Global Allergy Immunotherapy Market Volume K Unit Forecast, by Allergy Type 2019 & 2032
- Table 65: Global Allergy Immunotherapy Market Revenue Million Forecast, by Country 2019 & 2032
- Table 66: Global Allergy Immunotherapy Market Volume K Unit Forecast, by Country 2019 & 2032
- Table 67: United States Allergy Immunotherapy Market Revenue (Million) Forecast, by Application 2019 & 2032
- Table 68: United States Allergy Immunotherapy Market Volume (K Unit) Forecast, by Application 2019 & 2032
- Table 69: Canada Allergy Immunotherapy Market Revenue (Million) Forecast, by Application 2019 & 2032
- Table 70: Canada Allergy Immunotherapy Market Volume (K Unit) Forecast, by Application 2019 & 2032
- Table 71: Mexico Allergy Immunotherapy Market Revenue (Million) Forecast, by Application 2019 & 2032
- Table 72: Mexico Allergy Immunotherapy Market Volume (K Unit) Forecast, by Application 2019 & 2032
- Table 73: Global Allergy Immunotherapy Market Revenue Million Forecast, by Type of Immunotherapy 2019 & 2032
- Table 74: Global Allergy Immunotherapy Market Volume K Unit Forecast, by Type of Immunotherapy 2019 & 2032
- Table 75: Global Allergy Immunotherapy Market Revenue Million Forecast, by Allergy Type 2019 & 2032
- Table 76: Global Allergy Immunotherapy Market Volume K Unit Forecast, by Allergy Type 2019 & 2032
- Table 77: Global Allergy Immunotherapy Market Revenue Million Forecast, by Country 2019 & 2032
- Table 78: Global Allergy Immunotherapy Market Volume K Unit Forecast, by Country 2019 & 2032
- Table 79: Germany Allergy Immunotherapy Market Revenue (Million) Forecast, by Application 2019 & 2032
- Table 80: Germany Allergy Immunotherapy Market Volume (K Unit) Forecast, by Application 2019 & 2032
- Table 81: United Kingdom Allergy Immunotherapy Market Revenue (Million) Forecast, by Application 2019 & 2032
- Table 82: United Kingdom Allergy Immunotherapy Market Volume (K Unit) Forecast, by Application 2019 & 2032
- Table 83: France Allergy Immunotherapy Market Revenue (Million) Forecast, by Application 2019 & 2032
- Table 84: France Allergy Immunotherapy Market Volume (K Unit) Forecast, by Application 2019 & 2032
- Table 85: Italy Allergy Immunotherapy Market Revenue (Million) Forecast, by Application 2019 & 2032
- Table 86: Italy Allergy Immunotherapy Market Volume (K Unit) Forecast, by Application 2019 & 2032
- Table 87: Spain Allergy Immunotherapy Market Revenue (Million) Forecast, by Application 2019 & 2032
- Table 88: Spain Allergy Immunotherapy Market Volume (K Unit) Forecast, by Application 2019 & 2032
- Table 89: Rest of Europe Allergy Immunotherapy Market Revenue (Million) Forecast, by Application 2019 & 2032
- Table 90: Rest of Europe Allergy Immunotherapy Market Volume (K Unit) Forecast, by Application 2019 & 2032
- Table 91: Global Allergy Immunotherapy Market Revenue Million Forecast, by Type of Immunotherapy 2019 & 2032
- Table 92: Global Allergy Immunotherapy Market Volume K Unit Forecast, by Type of Immunotherapy 2019 & 2032
- Table 93: Global Allergy Immunotherapy Market Revenue Million Forecast, by Allergy Type 2019 & 2032
- Table 94: Global Allergy Immunotherapy Market Volume K Unit Forecast, by Allergy Type 2019 & 2032
- Table 95: Global Allergy Immunotherapy Market Revenue Million Forecast, by Country 2019 & 2032
- Table 96: Global Allergy Immunotherapy Market Volume K Unit Forecast, by Country 2019 & 2032
- Table 97: China Allergy Immunotherapy Market Revenue (Million) Forecast, by Application 2019 & 2032
- Table 98: China Allergy Immunotherapy Market Volume (K Unit) Forecast, by Application 2019 & 2032
- Table 99: Japan Allergy Immunotherapy Market Revenue (Million) Forecast, by Application 2019 & 2032
- Table 100: Japan Allergy Immunotherapy Market Volume (K Unit) Forecast, by Application 2019 & 2032
- Table 101: India Allergy Immunotherapy Market Revenue (Million) Forecast, by Application 2019 & 2032
- Table 102: India Allergy Immunotherapy Market Volume (K Unit) Forecast, by Application 2019 & 2032
- Table 103: Australia Allergy Immunotherapy Market Revenue (Million) Forecast, by Application 2019 & 2032
- Table 104: Australia Allergy Immunotherapy Market Volume (K Unit) Forecast, by Application 2019 & 2032
- Table 105: South Korea Allergy Immunotherapy Market Revenue (Million) Forecast, by Application 2019 & 2032
- Table 106: South Korea Allergy Immunotherapy Market Volume (K Unit) Forecast, by Application 2019 & 2032
- Table 107: Rest of Asia Pacific Allergy Immunotherapy Market Revenue (Million) Forecast, by Application 2019 & 2032
- Table 108: Rest of Asia Pacific Allergy Immunotherapy Market Volume (K Unit) Forecast, by Application 2019 & 2032
- Table 109: Global Allergy Immunotherapy Market Revenue Million Forecast, by Type of Immunotherapy 2019 & 2032
- Table 110: Global Allergy Immunotherapy Market Volume K Unit Forecast, by Type of Immunotherapy 2019 & 2032
- Table 111: Global Allergy Immunotherapy Market Revenue Million Forecast, by Allergy Type 2019 & 2032
- Table 112: Global Allergy Immunotherapy Market Volume K Unit Forecast, by Allergy Type 2019 & 2032
- Table 113: Global Allergy Immunotherapy Market Revenue Million Forecast, by Country 2019 & 2032
- Table 114: Global Allergy Immunotherapy Market Volume K Unit Forecast, by Country 2019 & 2032
- Table 115: GCC Allergy Immunotherapy Market Revenue (Million) Forecast, by Application 2019 & 2032
- Table 116: GCC Allergy Immunotherapy Market Volume (K Unit) Forecast, by Application 2019 & 2032
- Table 117: South Africa Allergy Immunotherapy Market Revenue (Million) Forecast, by Application 2019 & 2032
- Table 118: South Africa Allergy Immunotherapy Market Volume (K Unit) Forecast, by Application 2019 & 2032
- Table 119: Rest of Middle East and Africa Allergy Immunotherapy Market Revenue (Million) Forecast, by Application 2019 & 2032
- Table 120: Rest of Middle East and Africa Allergy Immunotherapy Market Volume (K Unit) Forecast, by Application 2019 & 2032
- Table 121: Global Allergy Immunotherapy Market Revenue Million Forecast, by Type of Immunotherapy 2019 & 2032
- Table 122: Global Allergy Immunotherapy Market Volume K Unit Forecast, by Type of Immunotherapy 2019 & 2032
- Table 123: Global Allergy Immunotherapy Market Revenue Million Forecast, by Allergy Type 2019 & 2032
- Table 124: Global Allergy Immunotherapy Market Volume K Unit Forecast, by Allergy Type 2019 & 2032
- Table 125: Global Allergy Immunotherapy Market Revenue Million Forecast, by Country 2019 & 2032
- Table 126: Global Allergy Immunotherapy Market Volume K Unit Forecast, by Country 2019 & 2032
- Table 127: Brazil Allergy Immunotherapy Market Revenue (Million) Forecast, by Application 2019 & 2032
- Table 128: Brazil Allergy Immunotherapy Market Volume (K Unit) Forecast, by Application 2019 & 2032
- Table 129: Argentina Allergy Immunotherapy Market Revenue (Million) Forecast, by Application 2019 & 2032
- Table 130: Argentina Allergy Immunotherapy Market Volume (K Unit) Forecast, by Application 2019 & 2032
- Table 131: Rest of South America Allergy Immunotherapy Market Revenue (Million) Forecast, by Application 2019 & 2032
- Table 132: Rest of South America Allergy Immunotherapy Market Volume (K Unit) Forecast, by Application 2019 & 2032
Frequently Asked Questions
1. What is the projected Compound Annual Growth Rate (CAGR) of the Allergy Immunotherapy Market?
The projected CAGR is approximately 6.50%.
2. Which companies are prominent players in the Allergy Immunotherapy Market?
Key companies in the market include Allovate LLC, Torii Pharmaceutical Co Ltd, Jubliant Pharma (Hollister Allergy), Stallergenes Greer, Leti Pharma, Allergy Therapeutics, HAL Allergy Group, Biomay AG, Merck KGaA (Allergopharma), ALK-Abello A/S.
3. What are the main segments of the Allergy Immunotherapy Market?
The market segments include Type of Immunotherapy, Allergy Type.
4. Can you provide details about the market size?
The market size is estimated to be USD XX Million as of 2022.
5. What are some drivers contributing to market growth?
Increasing Burden of Various Types of Allergies; Launch of New Sublingual Immunotherapies in Emerging Economies.
6. What are the notable trends driving market growth?
Subcutaneous Immunotherapy (SCIT) is Expected to Witness Growth Over the Forecast Period.
7. Are there any restraints impacting market growth?
Lack of Awareness about Allergy and Treatments.
8. Can you provide examples of recent developments in the market?
In July 2022, Stallergenes Greer, a global healthcare company that specializes in allergen immunotherapy (AIT), announced the positive data related to the significant benefit of sublingual liquid allergen immunotherapy treatment (AIT) on the onset and worsening of asthma in patients with allergic rhinitis.
9. What pricing options are available for accessing the report?
Pricing options include single-user, multi-user, and enterprise licenses priced at USD 4750, USD 5250, and USD 8750 respectively.
10. Is the market size provided in terms of value or volume?
The market size is provided in terms of value, measured in Million and volume, measured in K Unit.
11. Are there any specific market keywords associated with the report?
Yes, the market keyword associated with the report is "Allergy Immunotherapy Market," which aids in identifying and referencing the specific market segment covered.
12. How do I determine which pricing option suits my needs best?
The pricing options vary based on user requirements and access needs. Individual users may opt for single-user licenses, while businesses requiring broader access may choose multi-user or enterprise licenses for cost-effective access to the report.
13. Are there any additional resources or data provided in the Allergy Immunotherapy Market report?
While the report offers comprehensive insights, it's advisable to review the specific contents or supplementary materials provided to ascertain if additional resources or data are available.
14. How can I stay updated on further developments or reports in the Allergy Immunotherapy Market?
To stay informed about further developments, trends, and reports in the Allergy Immunotherapy Market, consider subscribing to industry newsletters, following relevant companies and organizations, or regularly checking reputable industry news sources and publications.
Methodology
Step 1 - Identification of Relevant Samples Size from Population Database


Step 2 - Approaches for Defining Global Market Size (Value, Volume* & Price*)

Note*: In applicable scenarios
Step 3 - Data Sources
Primary Research
- Web Analytics
- Survey Reports
- Research Institute
- Latest Research Reports
- Opinion Leaders
Secondary Research
- Annual Reports
- White Paper
- Latest Press Release
- Industry Association
- Paid Database
- Investor Presentations

Step 4 - Data Triangulation
Involves using different sources of information in order to increase the validity of a study
These sources are likely to be stakeholders in a program - participants, other researchers, program staff, other community members, and so on.
Then we put all data in single framework & apply various statistical tools to find out the dynamic on the market.
During the analysis stage, feedback from the stakeholder groups would be compared to determine areas of agreement as well as areas of divergence


