

Key Insights
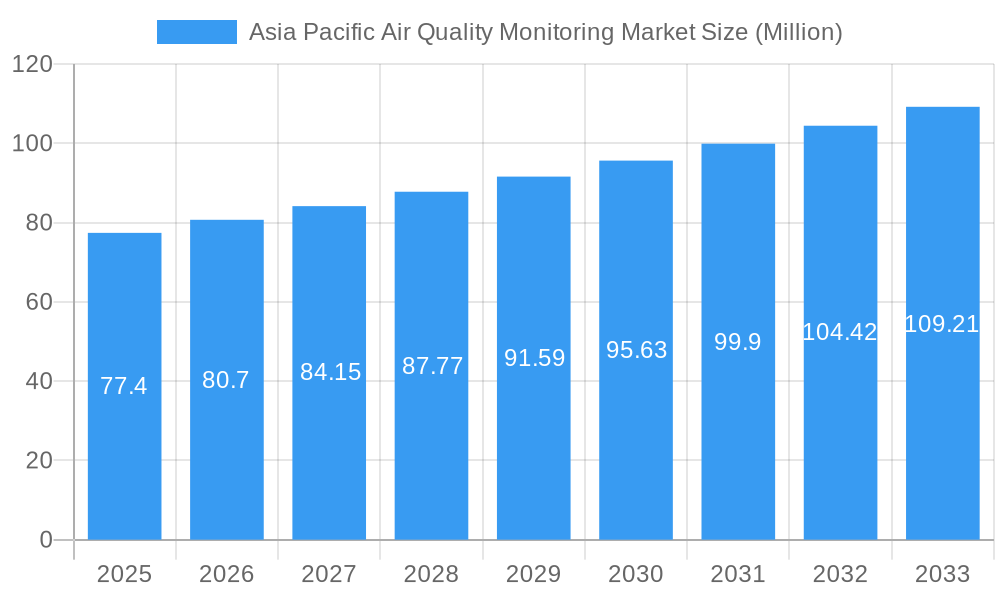
The Asia Pacific Air Quality Monitoring Market is poised for significant expansion, projected to reach a substantial market size of USD 77.40 million by 2025, with a robust Compound Annual Growth Rate (CAGR) of 4.55%. This growth is propelled by a confluence of escalating environmental concerns, stringent government regulations across the region, and a growing awareness among both industries and the public regarding the detrimental health impacts of poor air quality. Key market drivers include the increasing need for real-time monitoring in rapidly urbanizing areas, particularly in developing economies like China and India, where industrial activity and vehicular emissions are on the rise. Furthermore, advancements in sensor technology, the integration of IoT for remote monitoring and data analytics, and the rising demand for sophisticated chemical, physical, and biological pollutant detection are also contributing to this upward trajectory. The market is witnessing a particular surge in demand for continuous monitoring solutions, both indoor and outdoor, to ensure healthier living and working environments.
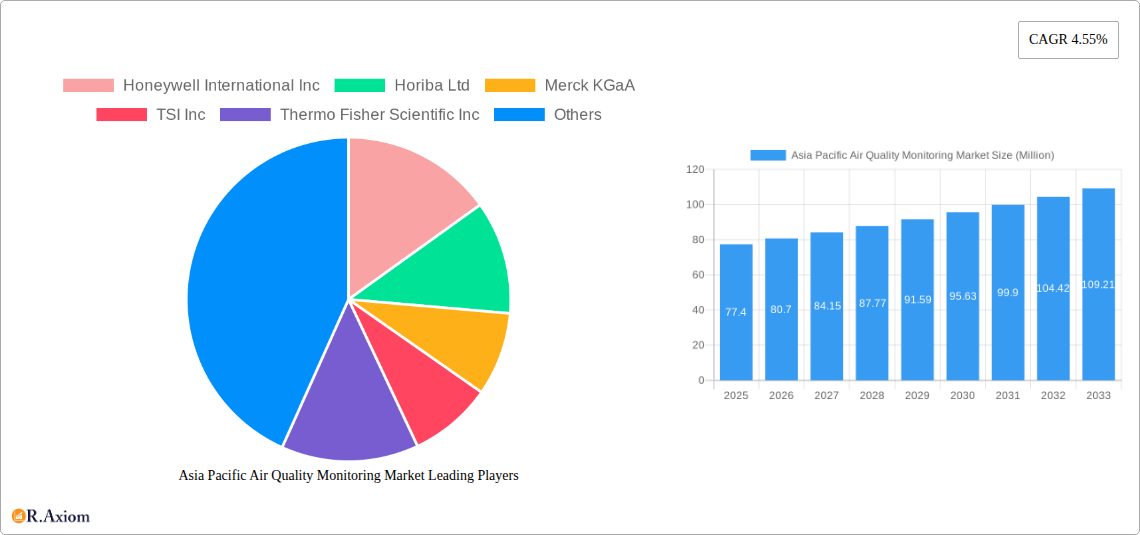
Asia Pacific Air Quality Monitoring Market Market Size (In Million)
The competitive landscape of the Asia Pacific Air Quality Monitoring Market is characterized by the presence of established global players and emerging regional manufacturers, all vying to capture market share through product innovation and strategic partnerships. Key trends shaping the market include the development of portable and cost-effective monitoring devices, the rise of cloud-based data management platforms for enhanced accessibility and analysis, and the increasing adoption of advanced sampling methods for more accurate pollutant identification. While the market is on a strong growth path, potential restraints include the high initial cost of some advanced monitoring systems and the need for skilled personnel to operate and maintain complex equipment. However, the overarching need for improved air quality management, driven by public health imperatives and regulatory compliance, is expected to outweigh these challenges, ensuring sustained market growth across various end-user segments, including residential and commercial buildings, power generation, and petrochemical industries. The Asia Pacific region, with its diverse economic landscape and significant environmental challenges, presents a fertile ground for the continued evolution and expansion of the air quality monitoring sector.
Asia Pacific Air Quality Monitoring Market Company Market Share
This in-depth report provides a detailed analysis of the Asia Pacific Air Quality Monitoring Market, offering critical insights for stakeholders looking to understand market dynamics, growth opportunities, and competitive landscapes. Covering the period from 2019 to 2033, with a base year of 2025, this report meticulously examines market trends, segmentation, and future projections.
Asia Pacific Air Quality Monitoring Market Market Concentration & Innovation
The Asia Pacific Air Quality Monitoring Market exhibits a moderate to high level of market concentration, with a mix of established global players and emerging regional manufacturers. Innovation is primarily driven by advancements in sensor technology, data analytics, and IoT integration for real-time, high-resolution air quality data. Regulatory frameworks, such as stricter emission standards and public health initiatives across countries like China and India, are significant innovation drivers, compelling manufacturers to develop more sophisticated and compliant monitoring solutions. Product substitutes, while present in basic monitoring solutions, are increasingly differentiated by accuracy, range of pollutants monitored, and connectivity features. End-user trends lean towards smart, integrated systems for both indoor and outdoor applications, with a growing demand for personalized air quality insights. Mergers and acquisition (M&A) activities, although not extensively publicized, are expected to increase as larger players seek to expand their geographical reach and technological capabilities. For instance, a hypothetical M&A deal in the forecast period could range from USD 50 million to USD 200 million, consolidating market share and fostering synergistic growth. The market is characterized by continuous innovation in portable and highly sensitive monitoring devices, alongside the development of comprehensive network solutions for urban-scale pollution tracking.
Asia Pacific Air Quality Monitoring Market Industry Trends & Insights
The Asia Pacific Air Quality Monitoring Market is experiencing robust growth, driven by escalating air pollution concerns and increasing governmental regulations mandating the monitoring of ambient and indoor air quality. The market is projected to witness a Compound Annual Growth Rate (CAGR) of approximately 8.5% during the forecast period of 2025–2033. This expansion is fueled by a heightened awareness among both regulatory bodies and the general public regarding the detrimental health effects of poor air quality. Technological disruptions, including the proliferation of IoT-enabled sensors, artificial intelligence (AI) for data interpretation, and cloud-based platforms for data management and analysis, are transforming the market. These advancements enable more accurate, real-time, and cost-effective air quality monitoring solutions. Consumer preferences are shifting towards user-friendly, integrated systems that can provide actionable insights for personal health and environmental management. The growing adoption of smart city initiatives across the region further amplifies the demand for sophisticated air quality monitoring networks. Competitive dynamics are intense, with companies investing heavily in research and development to offer advanced features such as multi-pollutant detection, predictive analytics for pollution events, and seamless integration with building management systems. The market penetration of advanced air quality monitoring systems is steadily increasing, particularly in urban centers and industrial zones across key economies like China and India. The demand for continuous monitoring solutions, especially for industrial emissions and traffic-related pollution, is a significant trend. The push for cleaner energy sources and more stringent industrial emission controls directly correlates with the increased deployment of these monitoring technologies.
Dominant Markets & Segments in Asia Pacific Air Quality Monitoring Market
China currently dominates the Asia Pacific Air Quality Monitoring Market, driven by its large population, rapid industrialization, and the government's stringent pollution control policies. The country's proactive approach to addressing severe air pollution has led to significant investments in advanced monitoring infrastructure. Following closely is India, which is rapidly expanding its air quality monitoring network due to severe pollution challenges and government initiatives like the National Clean Air Programme.
- Product Type: The Outdoor Monitor segment holds a dominant share due to widespread urban pollution and industrial emissions. However, the Indoor Monitor segment is witnessing substantial growth, propelled by increasing health consciousness and the desire for cleaner indoor environments in residential and commercial spaces.
- Sampling Method: Continuous sampling methods are paramount, especially for industrial emissions and regulatory compliance, providing real-time data crucial for immediate action and long-term trend analysis. Manual and Intermittent methods are gradually being phased out in critical applications, though they retain relevance for specific niche uses or budget-constrained scenarios.
- Pollutant Type: Chemical Pollutants, including particulate matter (PM2.5, PM10), nitrogen oxides (NOx), sulfur dioxide (SO2), and ozone (O3), are the primary focus due to their significant impact on public health. Physical Pollutants such as noise and radiation are also gaining attention in specific applications. Biological Pollutants, while less emphasized, are emerging in specific indoor air quality monitoring applications.
- End User: The Residential and Commercial segment is experiencing rapid expansion due to rising health awareness and indoor air quality concerns. Power Generation and Petrochemicals are significant end-users, driven by strict emission regulations and the need for continuous monitoring of industrial output. Other End Users, including transportation, agriculture, and research institutions, also contribute to market growth.
- Geography: Beyond China and India, Japan and Singapore are significant markets, characterized by advanced technological adoption and a strong focus on environmental sustainability. The Rest of Asia-Pacific region, encompassing countries like South Korea, Indonesia, and Vietnam, presents substantial untapped potential due to increasing industrialization and growing environmental awareness.
Asia Pacific Air Quality Monitoring Market Product Developments
Recent product developments in the Asia Pacific Air Quality Monitoring Market emphasize miniaturization, enhanced accuracy, and IoT connectivity. Companies are launching compact, portable indoor and outdoor monitors capable of detecting a wider range of pollutants with greater precision. Innovations include the integration of AI for predictive analytics and early warning systems, as well as the development of low-cost sensor networks for comprehensive urban coverage. These advancements cater to the growing demand for real-time, actionable air quality data for both industrial compliance and public health applications, providing a competitive edge through superior data management and user experience.
Report Scope & Segmentation Analysis
This report meticulously analyzes the Asia Pacific Air Quality Monitoring Market, segmented across key areas. Product Type includes Indoor Monitors and Outdoor Monitors, with projected market sizes and growth rates detailed for each. The Sampling Method segmentation covers Continuous, Manual, and Intermittent approaches, highlighting their respective market shares and adoption trends. Analysis of Pollutant Type includes Chemical Pollutants, Physical Pollutants, and Biological Pollutants, detailing the market demand and technological advancements for each. The End User segments are Residential and Commercial, Power Generation, Petrochemicals, and Other End Users, with insights into their specific monitoring needs and growth trajectories. Geographically, the report provides in-depth analysis for China, India, Japan, Singapore, and the Rest of Asia-Pacific, offering regional market sizes, growth projections, and competitive dynamics within each territory.
Key Drivers of Asia Pacific Air Quality Monitoring Market Growth
The Asia Pacific Air Quality Monitoring Market is propelled by several key drivers. Increasing Air Pollution Levels across major urban and industrial centers necessitate immediate and effective monitoring solutions. Stringent Government Regulations and Policies mandating emission controls and air quality standards are crucial catalysts. Rising Health Consciousness and Awareness among the public regarding the detrimental effects of poor air quality fuels demand for both personal and public monitoring systems. Furthermore, Technological Advancements, including the development of low-cost, high-accuracy sensors, IoT integration, and AI-powered analytics, make sophisticated monitoring more accessible and effective. The growth of Smart City Initiatives and the increasing adoption of smart infrastructure further integrate air quality monitoring into urban planning and management.
Challenges in the Asia Pacific Air Quality Monitoring Market Sector
Despite robust growth, the Asia Pacific Air Quality Monitoring Market faces several challenges. High Initial Investment Costs for advanced monitoring systems can be a barrier for smaller businesses and developing regions. Lack of Standardized Regulations and Calibration Procedures across different countries can hinder interoperability and data comparability. Data Interpretation and Management can be complex, requiring skilled personnel and sophisticated analytical tools. Maintenance and Calibration of deployed sensors, especially in harsh environmental conditions, pose logistical and operational challenges. Supply Chain Disruptions, as experienced globally, can impact the availability of critical components and finished products. Public Awareness and Enforcement of existing regulations vary significantly across the region, impacting the pace of adoption.
Emerging Opportunities in Asia Pacific Air Quality Monitoring Market
Emerging opportunities in the Asia Pacific Air Quality Monitoring Market are abundant. The growing demand for IoT-enabled, real-time monitoring solutions for smart cities and industries presents significant potential. The development of low-cost, portable air quality sensors for widespread consumer use is an untapped market. There is a substantial opportunity in providing integrated data analytics platforms that offer predictive insights and actionable recommendations. The increasing focus on indoor air quality monitoring in residential, commercial, and educational institutions, particularly post-pandemic, offers a growing segment. Expansion into emerging economies within the Asia-Pacific region, such as Vietnam, Indonesia, and Thailand, presents a nascent but rapidly growing market. Furthermore, the integration of air quality monitoring with climate change mitigation efforts and green building certifications opens new avenues for growth.
Leading Players in the Asia Pacific Air Quality Monitoring Market Market
- Honeywell International Inc
- Horiba Ltd
- Merck KGaA
- TSI Inc
- Thermo Fisher Scientific Inc
- Aeroqual Limited
- Emerson Electric Co
- Siemens AG
- Agilent Technologies Inc
- 3M Co
- Teledyne Technologies Inc
Key Developments in Asia Pacific Air Quality Monitoring Market Industry
- January 2023: The government of India launched the Technology for Air Quality Monitoring System (AI-AQMS v1.0) developed under MeitY-supported projects. The Centre for Development of Advanced Computing (C-DAC), Kolkata, in partnership with TeXMIN, ISM, Dhanbad under the ‘National program on Electronics and ICT applications in Agriculture and Environment (AgriEnIcs)’ has developed an outdoor air quality monitoring station to monitor environmental pollutants which includes parameters like PM 1.0, PM 2.5, PM 10.0, SO2, NO2, CO, O2, ambient temperature, relative humidity etc., for continuous air quality analysis of the environment.
- September 2022: The Asian Development Bank (ADB) launched the Asia Clean Blue Skies Program (ACBSP) to scale up ADB's investments in improving air quality in Asia and the Pacific. ADB launched the ACBSP at the Fourth Asia Pacific Clean Air Partnership joint forum in Seoul, Korea. The program supports the development and strengthening of policies and plans for ADB's developing member countries (DMCs) so that investments are stimulated in air quality projects, such as greenhouse gas reductions in energy, agriculture, transportation, industrial development, and urban development.
Strategic Outlook for Asia Pacific Air Quality Monitoring Market Market
The strategic outlook for the Asia Pacific Air Quality Monitoring Market is highly positive, driven by a confluence of factors. Continued urbanization and industrial growth will inevitably lead to increased pollution, necessitating advanced monitoring solutions. Government commitment to environmental protection and public health will drive regulatory enforcement and investment in monitoring infrastructure. Technological innovation, particularly in AI, IoT, and sensor miniaturization, will continue to enhance the capabilities and affordability of monitoring systems. The growing consumer demand for healthier living and working environments will further propel the adoption of indoor air quality monitors. Strategic partnerships, product diversification, and geographical expansion will be key for market players aiming to capitalize on these growth catalysts and secure a substantial market share in this dynamic and expanding sector.
Asia Pacific Air Quality Monitoring Market Segmentation
-
1. Product Type
- 1.1. Indoor Monitor
- 1.2. Outdoor Monitor
-
2. Sampling Method
- 2.1. Continuous
- 2.2. Manual
- 2.3. Intermittent
-
3. Pollutant Type
- 3.1. Chemical Pollutants
- 3.2. Physical Pollutants
- 3.3. Biological Pollutants
-
4. End User
- 4.1. Residential and Commercial
- 4.2. Power Generation
- 4.3. Petrochemicals
- 4.4. Other End Users
-
5. Geography
- 5.1. China
- 5.2. India
- 5.3. Japan
- 5.4. Singapore
- 5.5. Rest of Asia-Pacific
Asia Pacific Air Quality Monitoring Market Segmentation By Geography
- 1. China
- 2. India
- 3. Japan
- 4. Singapore
- 5. Rest of Asia Pacific
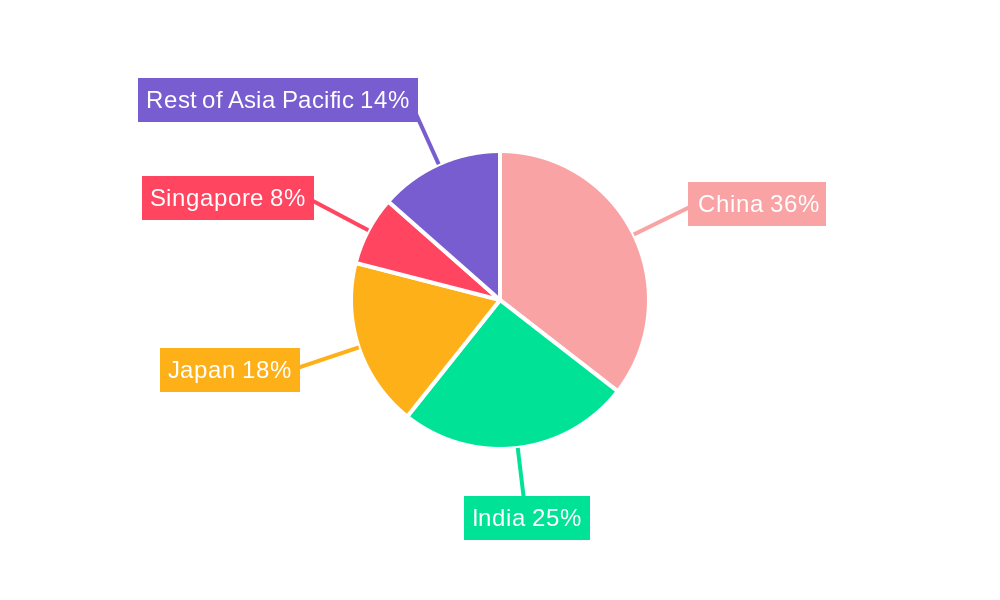
Asia Pacific Air Quality Monitoring Market Regional Market Share
Geographic Coverage of Asia Pacific Air Quality Monitoring Market
Asia Pacific Air Quality Monitoring Market REPORT HIGHLIGHTS
| Aspects | Details |
|---|---|
| Study Period | 2020-2034 |
| Base Year | 2025 |
| Estimated Year | 2026 |
| Forecast Period | 2026-2034 |
| Historical Period | 2020-2025 |
| Growth Rate | CAGR of 4.55% from 2020-2034 |
| Segmentation |
|
Table of Contents
- 1. Introduction
- 1.1. Research Scope
- 1.2. Market Segmentation
- 1.3. Research Objective
- 1.4. Definitions and Assumptions
- 2. Executive Summary
- 2.1. Market Snapshot
- 3. Market Dynamics
- 3.1. Market Drivers
- 3.2. Market Restrains
- 3.3. Market Trends
- 3.4. Market Opportunities
- 4. Market Factor Analysis
- 4.1. Porters Five Forces
- 4.1.1. Bargaining Power of Suppliers
- 4.1.2. Bargaining Power of Buyers
- 4.1.3. Threat of New Entrants
- 4.1.4. Threat of Substitutes
- 4.1.5. Competitive Rivalry
- 4.2. PESTEL analysis
- 4.3. BCG Analysis
- 4.3.1. Stars (High Growth, High Market Share)
- 4.3.2. Cash Cows (Low Growth, High Market Share)
- 4.3.3. Question Mark (High Growth, Low Market Share)
- 4.3.4. Dogs (Low Growth, Low Market Share)
- 4.4. Ansoff Matrix Analysis
- 4.5. Supply Chain Analysis
- 4.6. Regulatory Landscape
- 4.7. Current Market Potential and Opportunity Assessment (TAM–SAM–SOM Framework)
- 4.8. RAX Analyst Note
- 4.1. Porters Five Forces
- 5. Market Analysis, Insights and Forecast 2021-2033
- 5.1. Market Analysis, Insights and Forecast - by Product Type
- 5.1.1. Indoor Monitor
- 5.1.2. Outdoor Monitor
- 5.2. Market Analysis, Insights and Forecast - by Sampling Method
- 5.2.1. Continuous
- 5.2.2. Manual
- 5.2.3. Intermittent
- 5.3. Market Analysis, Insights and Forecast - by Pollutant Type
- 5.3.1. Chemical Pollutants
- 5.3.2. Physical Pollutants
- 5.3.3. Biological Pollutants
- 5.4. Market Analysis, Insights and Forecast - by End User
- 5.4.1. Residential and Commercial
- 5.4.2. Power Generation
- 5.4.3. Petrochemicals
- 5.4.4. Other End Users
- 5.5. Market Analysis, Insights and Forecast - by Geography
- 5.5.1. China
- 5.5.2. India
- 5.5.3. Japan
- 5.5.4. Singapore
- 5.5.5. Rest of Asia-Pacific
- 5.6. Market Analysis, Insights and Forecast - by Region
- 5.6.1. China
- 5.6.2. India
- 5.6.3. Japan
- 5.6.4. Singapore
- 5.6.5. Rest of Asia Pacific
- 5.1. Market Analysis, Insights and Forecast - by Product Type
- 6. Asia Pacific Air Quality Monitoring Market Analysis, Insights and Forecast, 2021-2033
- 6.1. Market Analysis, Insights and Forecast - by Product Type
- 6.1.1. Indoor Monitor
- 6.1.2. Outdoor Monitor
- 6.2. Market Analysis, Insights and Forecast - by Sampling Method
- 6.2.1. Continuous
- 6.2.2. Manual
- 6.2.3. Intermittent
- 6.3. Market Analysis, Insights and Forecast - by Pollutant Type
- 6.3.1. Chemical Pollutants
- 6.3.2. Physical Pollutants
- 6.3.3. Biological Pollutants
- 6.4. Market Analysis, Insights and Forecast - by End User
- 6.4.1. Residential and Commercial
- 6.4.2. Power Generation
- 6.4.3. Petrochemicals
- 6.4.4. Other End Users
- 6.5. Market Analysis, Insights and Forecast - by Geography
- 6.5.1. China
- 6.5.2. India
- 6.5.3. Japan
- 6.5.4. Singapore
- 6.5.5. Rest of Asia-Pacific
- 6.1. Market Analysis, Insights and Forecast - by Product Type
- 7. China Asia Pacific Air Quality Monitoring Market Analysis, Insights and Forecast, 2020-2032
- 7.1. Market Analysis, Insights and Forecast - by Product Type
- 7.1.1. Indoor Monitor
- 7.1.2. Outdoor Monitor
- 7.2. Market Analysis, Insights and Forecast - by Sampling Method
- 7.2.1. Continuous
- 7.2.2. Manual
- 7.2.3. Intermittent
- 7.3. Market Analysis, Insights and Forecast - by Pollutant Type
- 7.3.1. Chemical Pollutants
- 7.3.2. Physical Pollutants
- 7.3.3. Biological Pollutants
- 7.4. Market Analysis, Insights and Forecast - by End User
- 7.4.1. Residential and Commercial
- 7.4.2. Power Generation
- 7.4.3. Petrochemicals
- 7.4.4. Other End Users
- 7.5. Market Analysis, Insights and Forecast - by Geography
- 7.5.1. China
- 7.5.2. India
- 7.5.3. Japan
- 7.5.4. Singapore
- 7.5.5. Rest of Asia-Pacific
- 7.1. Market Analysis, Insights and Forecast - by Product Type
- 8. India Asia Pacific Air Quality Monitoring Market Analysis, Insights and Forecast, 2020-2032
- 8.1. Market Analysis, Insights and Forecast - by Product Type
- 8.1.1. Indoor Monitor
- 8.1.2. Outdoor Monitor
- 8.2. Market Analysis, Insights and Forecast - by Sampling Method
- 8.2.1. Continuous
- 8.2.2. Manual
- 8.2.3. Intermittent
- 8.3. Market Analysis, Insights and Forecast - by Pollutant Type
- 8.3.1. Chemical Pollutants
- 8.3.2. Physical Pollutants
- 8.3.3. Biological Pollutants
- 8.4. Market Analysis, Insights and Forecast - by End User
- 8.4.1. Residential and Commercial
- 8.4.2. Power Generation
- 8.4.3. Petrochemicals
- 8.4.4. Other End Users
- 8.5. Market Analysis, Insights and Forecast - by Geography
- 8.5.1. China
- 8.5.2. India
- 8.5.3. Japan
- 8.5.4. Singapore
- 8.5.5. Rest of Asia-Pacific
- 8.1. Market Analysis, Insights and Forecast - by Product Type
- 9. Japan Asia Pacific Air Quality Monitoring Market Analysis, Insights and Forecast, 2020-2032
- 9.1. Market Analysis, Insights and Forecast - by Product Type
- 9.1.1. Indoor Monitor
- 9.1.2. Outdoor Monitor
- 9.2. Market Analysis, Insights and Forecast - by Sampling Method
- 9.2.1. Continuous
- 9.2.2. Manual
- 9.2.3. Intermittent
- 9.3. Market Analysis, Insights and Forecast - by Pollutant Type
- 9.3.1. Chemical Pollutants
- 9.3.2. Physical Pollutants
- 9.3.3. Biological Pollutants
- 9.4. Market Analysis, Insights and Forecast - by End User
- 9.4.1. Residential and Commercial
- 9.4.2. Power Generation
- 9.4.3. Petrochemicals
- 9.4.4. Other End Users
- 9.5. Market Analysis, Insights and Forecast - by Geography
- 9.5.1. China
- 9.5.2. India
- 9.5.3. Japan
- 9.5.4. Singapore
- 9.5.5. Rest of Asia-Pacific
- 9.1. Market Analysis, Insights and Forecast - by Product Type
- 10. Singapore Asia Pacific Air Quality Monitoring Market Analysis, Insights and Forecast, 2020-2032
- 10.1. Market Analysis, Insights and Forecast - by Product Type
- 10.1.1. Indoor Monitor
- 10.1.2. Outdoor Monitor
- 10.2. Market Analysis, Insights and Forecast - by Sampling Method
- 10.2.1. Continuous
- 10.2.2. Manual
- 10.2.3. Intermittent
- 10.3. Market Analysis, Insights and Forecast - by Pollutant Type
- 10.3.1. Chemical Pollutants
- 10.3.2. Physical Pollutants
- 10.3.3. Biological Pollutants
- 10.4. Market Analysis, Insights and Forecast - by End User
- 10.4.1. Residential and Commercial
- 10.4.2. Power Generation
- 10.4.3. Petrochemicals
- 10.4.4. Other End Users
- 10.5. Market Analysis, Insights and Forecast - by Geography
- 10.5.1. China
- 10.5.2. India
- 10.5.3. Japan
- 10.5.4. Singapore
- 10.5.5. Rest of Asia-Pacific
- 10.1. Market Analysis, Insights and Forecast - by Product Type
- 11. Rest of Asia Pacific Asia Pacific Air Quality Monitoring Market Analysis, Insights and Forecast, 2020-2032
- 11.1. Market Analysis, Insights and Forecast - by Product Type
- 11.1.1. Indoor Monitor
- 11.1.2. Outdoor Monitor
- 11.2. Market Analysis, Insights and Forecast - by Sampling Method
- 11.2.1. Continuous
- 11.2.2. Manual
- 11.2.3. Intermittent
- 11.3. Market Analysis, Insights and Forecast - by Pollutant Type
- 11.3.1. Chemical Pollutants
- 11.3.2. Physical Pollutants
- 11.3.3. Biological Pollutants
- 11.4. Market Analysis, Insights and Forecast - by End User
- 11.4.1. Residential and Commercial
- 11.4.2. Power Generation
- 11.4.3. Petrochemicals
- 11.4.4. Other End Users
- 11.5. Market Analysis, Insights and Forecast - by Geography
- 11.5.1. China
- 11.5.2. India
- 11.5.3. Japan
- 11.5.4. Singapore
- 11.5.5. Rest of Asia-Pacific
- 11.1. Market Analysis, Insights and Forecast - by Product Type
- 12. Competitive Analysis
- 12.1. Company Profiles
- 12.1.1 Honeywell International Inc
- 12.1.1.1. Company Overview
- 12.1.1.2. Products
- 12.1.1.3. Company Financials
- 12.1.1.4. SWOT Analysis
- 12.1.2 Horiba Ltd
- 12.1.2.1. Company Overview
- 12.1.2.2. Products
- 12.1.2.3. Company Financials
- 12.1.2.4. SWOT Analysis
- 12.1.3 Merck KGaA
- 12.1.3.1. Company Overview
- 12.1.3.2. Products
- 12.1.3.3. Company Financials
- 12.1.3.4. SWOT Analysis
- 12.1.4 TSI Inc
- 12.1.4.1. Company Overview
- 12.1.4.2. Products
- 12.1.4.3. Company Financials
- 12.1.4.4. SWOT Analysis
- 12.1.5 Thermo Fisher Scientific Inc
- 12.1.5.1. Company Overview
- 12.1.5.2. Products
- 12.1.5.3. Company Financials
- 12.1.5.4. SWOT Analysis
- 12.1.6 Aeroqual Limited*List Not Exhaustive
- 12.1.6.1. Company Overview
- 12.1.6.2. Products
- 12.1.6.3. Company Financials
- 12.1.6.4. SWOT Analysis
- 12.1.7 Emerson Electric Co
- 12.1.7.1. Company Overview
- 12.1.7.2. Products
- 12.1.7.3. Company Financials
- 12.1.7.4. SWOT Analysis
- 12.1.8 Siemens AG
- 12.1.8.1. Company Overview
- 12.1.8.2. Products
- 12.1.8.3. Company Financials
- 12.1.8.4. SWOT Analysis
- 12.1.9 Agilent Technologies Inc
- 12.1.9.1. Company Overview
- 12.1.9.2. Products
- 12.1.9.3. Company Financials
- 12.1.9.4. SWOT Analysis
- 12.1.10 3M Co
- 12.1.10.1. Company Overview
- 12.1.10.2. Products
- 12.1.10.3. Company Financials
- 12.1.10.4. SWOT Analysis
- 12.1.11 Teledyne Technologies Inc
- 12.1.11.1. Company Overview
- 12.1.11.2. Products
- 12.1.11.3. Company Financials
- 12.1.11.4. SWOT Analysis
- 12.1.1 Honeywell International Inc
- 12.2. Market Entropy
- 12.2.1 Company's Key Areas Served
- 12.2.2 Recent Developments
- 12.3. Company Market Share Analysis 2025
- 12.3.1 Top 5 Companies Market Share Analysis
- 12.3.2 Top 3 Companies Market Share Analysis
- 12.4. List of Potential Customers
- 13. Research Methodology
List of Figures
- Figure 1: Asia Pacific Air Quality Monitoring Market Revenue Breakdown (Million, %) by Product 2025 & 2033
- Figure 2: Asia Pacific Air Quality Monitoring Market Share (%) by Company 2025
List of Tables
- Table 1: Asia Pacific Air Quality Monitoring Market Revenue Million Forecast, by Product Type 2020 & 2033
- Table 2: Asia Pacific Air Quality Monitoring Market Revenue Million Forecast, by Sampling Method 2020 & 2033
- Table 3: Asia Pacific Air Quality Monitoring Market Revenue Million Forecast, by Pollutant Type 2020 & 2033
- Table 4: Asia Pacific Air Quality Monitoring Market Revenue Million Forecast, by End User 2020 & 2033
- Table 5: Asia Pacific Air Quality Monitoring Market Revenue Million Forecast, by Geography 2020 & 2033
- Table 6: Asia Pacific Air Quality Monitoring Market Revenue Million Forecast, by Region 2020 & 2033
- Table 7: Asia Pacific Air Quality Monitoring Market Revenue Million Forecast, by Product Type 2020 & 2033
- Table 8: Asia Pacific Air Quality Monitoring Market Revenue Million Forecast, by Sampling Method 2020 & 2033
- Table 9: Asia Pacific Air Quality Monitoring Market Revenue Million Forecast, by Pollutant Type 2020 & 2033
- Table 10: Asia Pacific Air Quality Monitoring Market Revenue Million Forecast, by End User 2020 & 2033
- Table 11: Asia Pacific Air Quality Monitoring Market Revenue Million Forecast, by Geography 2020 & 2033
- Table 12: Asia Pacific Air Quality Monitoring Market Revenue Million Forecast, by Country 2020 & 2033
- Table 13: Asia Pacific Air Quality Monitoring Market Revenue Million Forecast, by Product Type 2020 & 2033
- Table 14: Asia Pacific Air Quality Monitoring Market Revenue Million Forecast, by Sampling Method 2020 & 2033
- Table 15: Asia Pacific Air Quality Monitoring Market Revenue Million Forecast, by Pollutant Type 2020 & 2033
- Table 16: Asia Pacific Air Quality Monitoring Market Revenue Million Forecast, by End User 2020 & 2033
- Table 17: Asia Pacific Air Quality Monitoring Market Revenue Million Forecast, by Geography 2020 & 2033
- Table 18: Asia Pacific Air Quality Monitoring Market Revenue Million Forecast, by Country 2020 & 2033
- Table 19: Asia Pacific Air Quality Monitoring Market Revenue Million Forecast, by Product Type 2020 & 2033
- Table 20: Asia Pacific Air Quality Monitoring Market Revenue Million Forecast, by Sampling Method 2020 & 2033
- Table 21: Asia Pacific Air Quality Monitoring Market Revenue Million Forecast, by Pollutant Type 2020 & 2033
- Table 22: Asia Pacific Air Quality Monitoring Market Revenue Million Forecast, by End User 2020 & 2033
- Table 23: Asia Pacific Air Quality Monitoring Market Revenue Million Forecast, by Geography 2020 & 2033
- Table 24: Asia Pacific Air Quality Monitoring Market Revenue Million Forecast, by Country 2020 & 2033
- Table 25: Asia Pacific Air Quality Monitoring Market Revenue Million Forecast, by Product Type 2020 & 2033
- Table 26: Asia Pacific Air Quality Monitoring Market Revenue Million Forecast, by Sampling Method 2020 & 2033
- Table 27: Asia Pacific Air Quality Monitoring Market Revenue Million Forecast, by Pollutant Type 2020 & 2033
- Table 28: Asia Pacific Air Quality Monitoring Market Revenue Million Forecast, by End User 2020 & 2033
- Table 29: Asia Pacific Air Quality Monitoring Market Revenue Million Forecast, by Geography 2020 & 2033
- Table 30: Asia Pacific Air Quality Monitoring Market Revenue Million Forecast, by Country 2020 & 2033
- Table 31: Asia Pacific Air Quality Monitoring Market Revenue Million Forecast, by Product Type 2020 & 2033
- Table 32: Asia Pacific Air Quality Monitoring Market Revenue Million Forecast, by Sampling Method 2020 & 2033
- Table 33: Asia Pacific Air Quality Monitoring Market Revenue Million Forecast, by Pollutant Type 2020 & 2033
- Table 34: Asia Pacific Air Quality Monitoring Market Revenue Million Forecast, by End User 2020 & 2033
- Table 35: Asia Pacific Air Quality Monitoring Market Revenue Million Forecast, by Geography 2020 & 2033
- Table 36: Asia Pacific Air Quality Monitoring Market Revenue Million Forecast, by Country 2020 & 2033
Frequently Asked Questions
1. What is the projected Compound Annual Growth Rate (CAGR) of the Asia Pacific Air Quality Monitoring Market?
The projected CAGR is approximately 4.55%.
2. Which companies are prominent players in the Asia Pacific Air Quality Monitoring Market?
Key companies in the market include Honeywell International Inc, Horiba Ltd, Merck KGaA, TSI Inc, Thermo Fisher Scientific Inc, Aeroqual Limited*List Not Exhaustive, Emerson Electric Co, Siemens AG, Agilent Technologies Inc, 3M Co, Teledyne Technologies Inc.
3. What are the main segments of the Asia Pacific Air Quality Monitoring Market?
The market segments include Product Type, Sampling Method, Pollutant Type, End User, Geography.
4. Can you provide details about the market size?
The market size is estimated to be USD 77.40 Million as of 2022.
5. What are some drivers contributing to market growth?
4.; Increasing Awareness and Favorable Government Policies and Non-government Initiatives for Curbing Air Pollution.
6. What are the notable trends driving market growth?
Outdoor Segment to Witness Significant Growth.
7. Are there any restraints impacting market growth?
4.; High Costs of Air Quality Monitoring Systems.
8. Can you provide examples of recent developments in the market?
Januaru 2023: The government of India launched the Technology for Air Quality Monitoring System (AI-AQMS v1.0) developed under MeitY-supported projects. The Centre for Development of Advanced Computing (C-DAC), Kolkata, in partnership with TeXMIN, ISM, Dhanbad under the ‘National program on Electronics and ICT applications in Agriculture and Environment (AgriEnIcs)’ has developed an outdoor air quality monitoring station to monitor environmental pollutants which includes parameters like PM 1.0, PM 2.5, PM 10.0, SO2, NO2, CO, O2, ambient temperature, relative humidity etc., for continuous air quality analysis of the environment.
9. What pricing options are available for accessing the report?
Pricing options include single-user, multi-user, and enterprise licenses priced at USD 4750, USD 5250, and USD 8750 respectively.
10. Is the market size provided in terms of value or volume?
The market size is provided in terms of value, measured in Million.
11. Are there any specific market keywords associated with the report?
Yes, the market keyword associated with the report is "Asia Pacific Air Quality Monitoring Market," which aids in identifying and referencing the specific market segment covered.
12. How do I determine which pricing option suits my needs best?
The pricing options vary based on user requirements and access needs. Individual users may opt for single-user licenses, while businesses requiring broader access may choose multi-user or enterprise licenses for cost-effective access to the report.
13. Are there any additional resources or data provided in the Asia Pacific Air Quality Monitoring Market report?
While the report offers comprehensive insights, it's advisable to review the specific contents or supplementary materials provided to ascertain if additional resources or data are available.
14. How can I stay updated on further developments or reports in the Asia Pacific Air Quality Monitoring Market?
To stay informed about further developments, trends, and reports in the Asia Pacific Air Quality Monitoring Market, consider subscribing to industry newsletters, following relevant companies and organizations, or regularly checking reputable industry news sources and publications.
Methodology
Step 1 - Identification of Relevant Samples Size from Population Database


Step 2 - Approaches for Defining Global Market Size (Value, Volume* & Price*)

Note*: In applicable scenarios
Step 3 - Data Sources
Primary Research
- Web Analytics
- Survey Reports
- Research Institute
- Latest Research Reports
- Opinion Leaders
Secondary Research
- Annual Reports
- White Paper
- Latest Press Release
- Industry Association
- Paid Database
- Investor Presentations

Step 4 - Data Triangulation
Involves using different sources of information in order to increase the validity of a study
These sources are likely to be stakeholders in a program - participants, other researchers, program staff, other community members, and so on.
Then we put all data in single framework & apply various statistical tools to find out the dynamic on the market.
During the analysis stage, feedback from the stakeholder groups would be compared to determine areas of agreement as well as areas of divergence