

Key Insights
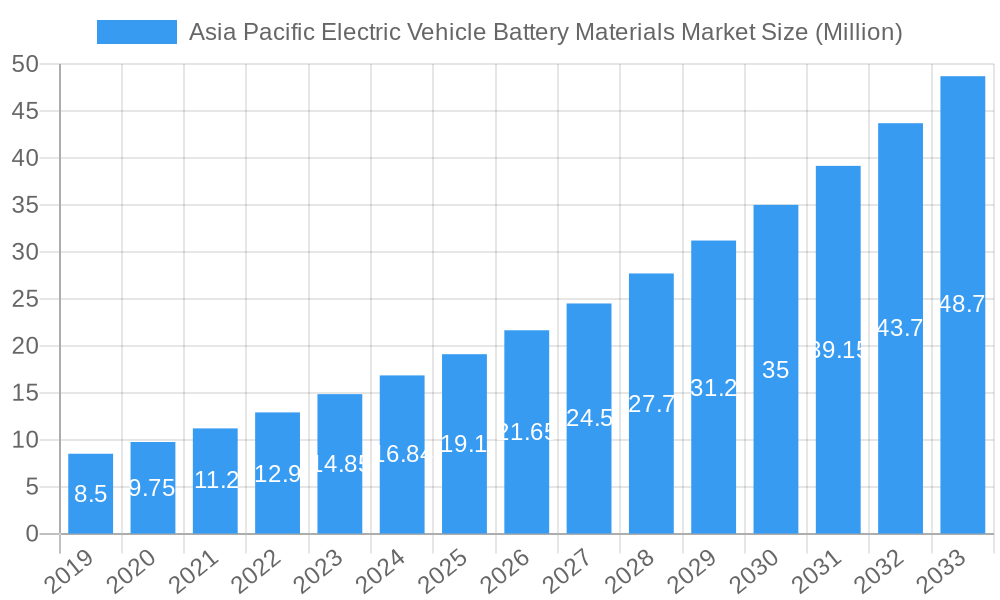
The Asia Pacific Electric Vehicle (EV) Battery Materials Market is poised for remarkable expansion, projected to reach an impressive $16.84 billion by 2025. This robust growth is fueled by a compelling Compound Annual Growth Rate (CAGR) of 13.61%, indicating a dynamic and rapidly evolving landscape. The primary drivers for this surge are the escalating adoption of electric vehicles across the region, spurred by supportive government policies, increasing environmental consciousness among consumers, and a continuous drive towards cleaner transportation solutions. Key trends shaping the market include advancements in battery technology, leading to higher energy densities, faster charging capabilities, and extended lifespans. The ongoing development of innovative cathode and anode materials, alongside improvements in electrolyte formulations, is critical to meeting the growing demand for more efficient and cost-effective EV batteries. Furthermore, the strategic emphasis on localized production and supply chain resilience within major Asian economies is a significant factor contributing to the market's upward trajectory.
Asia Pacific Electric Vehicle Battery Materials Market Market Size (In Million)
Despite the overwhelmingly positive outlook, certain restraints could influence the market's pace. The volatility in raw material prices, particularly for key elements like lithium, cobalt, and nickel, presents a challenge to cost-effective production and can impact profitability. Geopolitical factors and trade policies also introduce an element of uncertainty. Nonetheless, the market's segmentation reveals strong demand across various battery types, with Lithium-ion batteries dominating due to their superior performance characteristics. China, as a global manufacturing powerhouse and a leading EV market, is expected to command a substantial share, closely followed by other significant contributors like India, Japan, and South Korea. The strategic importance of these nations in the EV battery supply chain, from material sourcing to battery manufacturing, underscores the Asia Pacific's pivotal role in the global transition to electric mobility.
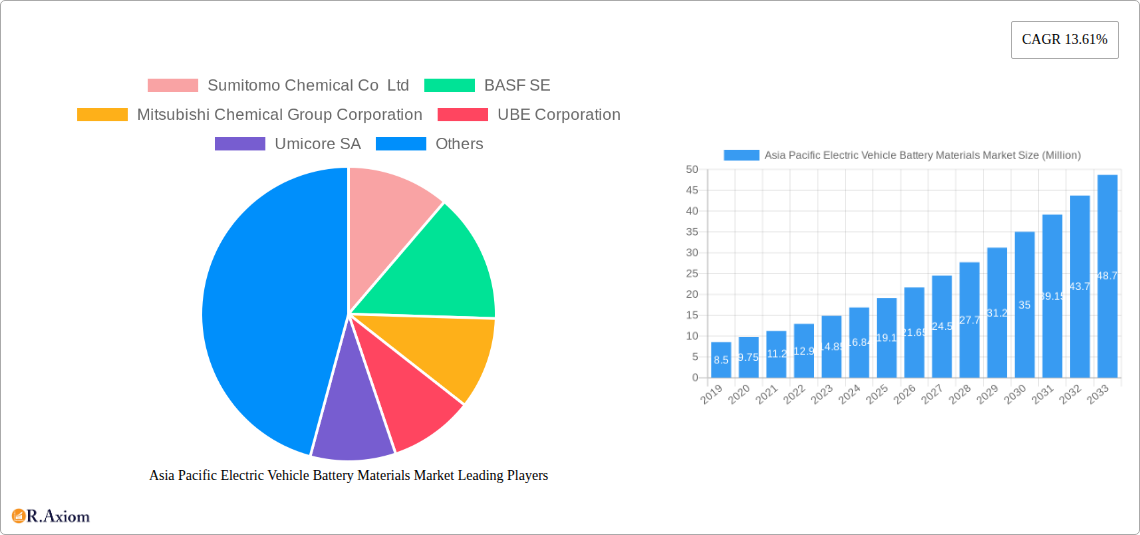
Asia Pacific Electric Vehicle Battery Materials Market Company Market Share
This in-depth report offers a granular analysis of the Asia Pacific Electric Vehicle (EV) Battery Materials Market, a critical sector underpinning the global transition to sustainable transportation. Covering the historical period of 2019-2024, base year 2025, and a robust forecast period of 2025-2033, this study delves into market dynamics, key players, technological advancements, and emerging opportunities. The report is designed to equip industry stakeholders, investors, and policymakers with actionable insights to navigate this rapidly evolving landscape. With projected market sizes and growth rates, this report is your definitive guide to the Asia Pacific EV battery materials market.
Asia Pacific Electric Vehicle Battery Materials Market Market Concentration & Innovation
The Asia Pacific Electric Vehicle Battery Materials Market is characterized by a dynamic interplay of concentration and innovation. While a few dominant players, including Contemporary Amperex Technology Co Limited, LG Chem, and BASF SE, hold significant market share, the presence of specialized material suppliers and the continuous drive for technological breakthroughs prevents extreme consolidation. Innovation is primarily fueled by the demand for higher energy density, faster charging capabilities, improved safety, and cost reduction in EV batteries. Regulatory frameworks in key markets like China and South Korea actively promote the development and adoption of advanced battery materials, including next-generation chemistries and sustainable sourcing practices. The market faces limited direct product substitutes for core battery materials like cathodes and anodes, but ongoing research into alternative battery chemistries presents a potential long-term disruptor. End-user trends are heavily influenced by government mandates for EV adoption, declining battery costs, and increasing consumer awareness of environmental sustainability. Mergers and acquisitions (M&A) activities are strategic, focusing on securing raw material supply chains, acquiring advanced technological capabilities, and expanding geographical reach. For instance, strategic collaborations aimed at developing cutting-edge battery materials, like the partnership between SK On and BASF SE, underscore the importance of M&A and joint ventures in accelerating innovation and market penetration. The estimated total M&A deal value in the broader EV battery sector has reached several billion dollars in recent years, reflecting intense investment.
Asia Pacific Electric Vehicle Battery Materials Market Industry Trends & Insights
The Asia Pacific Electric Vehicle Battery Materials Market is experiencing robust growth, driven by a confluence of factors including surging EV adoption rates, supportive government policies, and continuous technological advancements. The overall CAGR is projected to be in the double digits, signifying a highly dynamic market. Technological disruptions are at the forefront, with significant investment in research and development for next-generation battery materials such as solid-state electrolytes and silicon-based anodes, which promise enhanced safety and energy density. Consumer preferences are increasingly leaning towards EVs due to factors like lower running costs, environmental consciousness, and improving vehicle performance. This shift directly translates to a higher demand for advanced EV battery materials. The competitive landscape is intense, with established chemical giants and agile new entrants vying for market leadership. Key market penetration strategies involve vertical integration, strategic partnerships, and significant investments in R&D to develop proprietary technologies. For example, the development of advanced cathode materials capable of supporting higher nickel content is a critical trend, enhancing energy density by up to 20% in lithium-ion batteries. Similarly, innovations in electrolyte formulations are crucial for improving thermal stability and cycle life. The growing demand for lightweight and high-performance batteries is also pushing the boundaries of material science. Furthermore, the circular economy is gaining traction, with increasing focus on battery recycling and the development of materials derived from recycled content, aiming to reduce reliance on virgin raw materials and mitigate environmental impact. The supply chain for critical battery minerals like lithium, cobalt, and nickel remains a significant factor influencing market dynamics, with geopolitical considerations and responsible sourcing becoming paramount. The increasing prevalence of advanced battery management systems also necessitates the development of materials that can withstand more rigorous operating conditions.
Dominant Markets & Segments in Asia Pacific Electric Vehicle Battery Materials Market
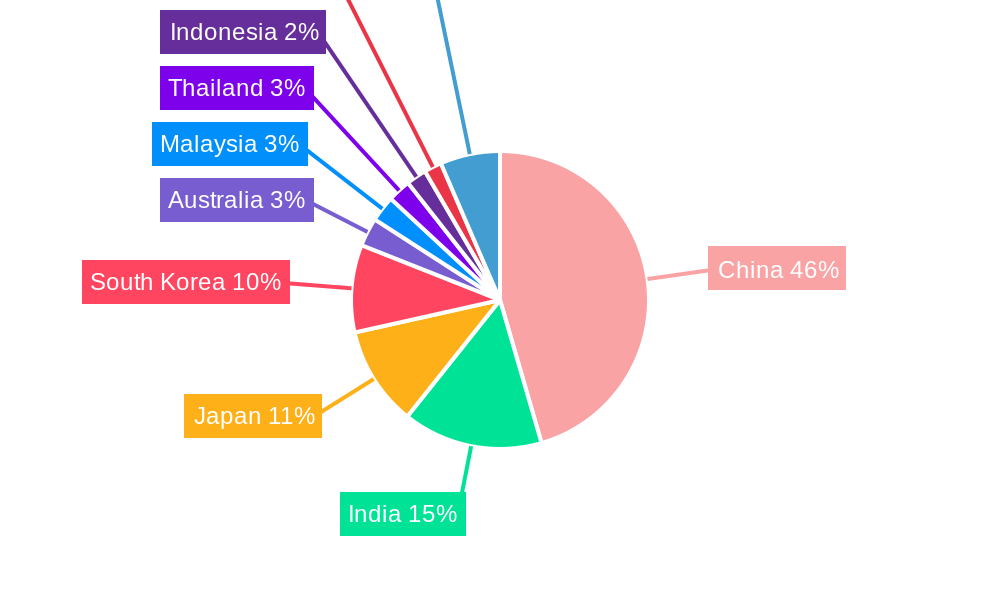
The Asia Pacific Electric Vehicle Battery Materials Market is significantly dominated by China, which accounts for the largest share due to its extensive EV manufacturing ecosystem, supportive government policies, and substantial domestic demand. South Korea and Japan are also pivotal players, known for their advanced technological capabilities and strong presence of battery manufacturers and material suppliers.
Battery Type Dominance:
- Lithium-ion Battery: This segment overwhelmingly dominates the market. Its superior energy density, longer lifespan, and declining costs compared to Lead-Acid Batteries make it the go-to technology for electric vehicles. Key drivers for its dominance include government incentives for EV adoption, technological advancements improving performance, and the established manufacturing infrastructure for lithium-ion cells and their constituent materials.
- Lead-Acid Battery: While historically significant, this segment holds a very minor share in the EV battery materials market, primarily for specific low-speed EV applications or hybrid systems. Its limitations in energy density and lifespan make it unsuitable for mainstream electric vehicles.
- Others: This segment may include emerging battery chemistries like solid-state batteries, sodium-ion batteries, or next-generation lithium-ion variants. While currently a niche, these hold significant future potential for market disruption and growth.
Material Dominance:
- Cathode: This is the most valuable and critical material segment. Cathode materials significantly influence battery performance, cost, and safety. China's extensive production capacity for Nickel-Manganese-Cobalt (NMC) and Lithium Iron Phosphate (LFP) cathodes drives its dominance. Factors like the availability of precursor materials and advancements in cathode synthesis are key drivers.
- Anode: The anode material is another crucial component. Graphite remains the dominant anode material, but research and development into silicon-based anodes are gaining momentum due to their potential for higher energy density.
- Electrolyte: Electrolytes facilitate ion movement between the cathode and anode. Innovations in liquid electrolytes for improved safety and performance, along with the growing interest in solid-state electrolytes, are shaping this segment.
- Separator: Separators prevent short circuits between electrodes. advancements in polymer-based separators for enhanced thermal stability and safety are key trends.
- Others: This segment could include binders, conductive additives, and other specialty chemicals essential for battery construction.
Geographical Dominance:
- China: Leads the market due to its massive EV production, government mandates, and a well-established battery material supply chain. Its economic policies, such as subsidies for EV purchases and manufacturing, directly fuel demand for battery materials.
- South Korea: A significant player with strong R&D capabilities and leading battery manufacturers like LG Energy Solution. Its focus on advanced battery technologies and strategic investments in material sourcing contribute to its market strength.
- Japan: Home to pioneers in battery technology and material science, Japan plays a crucial role in innovation and the development of high-performance materials. Government initiatives supporting green technology and R&D are key drivers.
- India: Emerging as a rapidly growing market, driven by government initiatives like the National Electric Mobility Mission Plan and increasing local manufacturing. Infrastructure development and policy support are critical for its growth.
- Australia: While not a major EV market, Australia is a significant supplier of critical raw materials like lithium, playing a crucial role in the global supply chain.
- Malaysia, Thailand, Indonesia, Vietnam, Rest of Asia-Pacific: These countries represent a growing segment, with increasing investments in EV manufacturing and battery production facilities, driven by favorable investment climates and growing domestic demand.
Asia Pacific Electric Vehicle Battery Materials Market Product Developments
Product developments in the Asia Pacific EV Battery Materials Market are focused on enhancing battery performance, safety, and cost-effectiveness. Innovations include the development of high-nickel cathode materials for increased energy density in lithium-ion batteries, and advanced graphite and silicon-composite anode materials for faster charging and longer cycle life. Electrolyte formulations are being optimized for wider operating temperature ranges and improved stability, while the development of solid-state electrolytes promises a breakthrough in battery safety by eliminating flammable liquid components. These product advancements are directly aligned with the evolving needs of the EV industry, aiming to address range anxiety, charging times, and overall vehicle affordability.
Report Scope & Segmentation Analysis
This report provides a comprehensive analysis of the Asia Pacific Electric Vehicle Battery Materials Market, segmented by Battery Type, Material, and Geography.
- Battery Type: The market is segmented into Lithium-ion Battery, Lead-Acid Battery, and Others. Lithium-ion batteries are projected to dominate, driven by their widespread adoption in EVs. The "Others" category will capture the growth of emerging battery technologies.
- Material: Key segments include Cathode, Anode, Electrolyte, Separator, and Others. The Cathode segment is expected to lead due to its significant impact on battery performance and cost. The Anode and Electrolyte segments are also poised for substantial growth with technological advancements.
- Geography: The analysis covers China, India, Australia, Japan, South Korea, Malaysia, Thailand, Indonesia, Vietnam, and the Rest of Asia-Pacific. China is anticipated to hold the largest market share, followed by South Korea and Japan. Emerging markets like India and Southeast Asian nations are expected to exhibit the highest growth rates.
Key Drivers of Asia Pacific Electric Vehicle Battery Materials Market Growth
The Asia Pacific Electric Vehicle Battery Materials Market is propelled by several significant drivers. Government policies promoting EV adoption through subsidies, tax incentives, and stringent emission regulations are a primary catalyst. Rapid technological advancements in battery chemistry and material science, leading to improved energy density, faster charging, and enhanced safety, are crucial. The declining cost of battery production, making EVs more affordable for consumers, is also a major growth factor. Furthermore, increasing environmental consciousness among consumers and a global push towards decarbonization are accelerating the shift towards electric mobility, thereby boosting demand for EV battery materials.
Challenges in the Asia Pacific Electric Vehicle Battery Materials Market Sector
Despite its strong growth trajectory, the Asia Pacific Electric Vehicle Battery Materials Market faces several challenges. Supply chain disruptions and price volatility of critical raw materials like lithium, cobalt, and nickel pose significant risks. Geopolitical factors and the concentration of mining operations in specific regions can lead to supply uncertainties. High initial investment costs for setting up advanced battery material manufacturing facilities can be a barrier to entry. Stringent environmental regulations regarding the sourcing and processing of battery materials, while necessary, can also add to operational complexities and costs. Intense competition among manufacturers, leading to price pressures, is another ongoing challenge.
Emerging Opportunities in Asia Pacific Electric Vehicle Battery Materials Market
The Asia Pacific Electric Vehicle Battery Materials Market presents numerous emerging opportunities. The rapid expansion of EV markets in countries like India and Southeast Asia offers vast untapped potential. The development and commercialization of next-generation battery technologies, such as solid-state batteries and sodium-ion batteries, represent a significant opportunity for innovation and market differentiation. The growing emphasis on battery recycling and the circular economy creates opportunities for companies involved in sustainable material sourcing and processing. Furthermore, the increasing demand for batteries in energy storage systems beyond automotive applications (e.g., grid-scale storage) opens up new avenues for market expansion. Strategic collaborations and partnerships to secure raw material supply and develop advanced materials will also be key to capitalizing on these opportunities.
Leading Players in the Asia Pacific Electric Vehicle Battery Materials Market Market
- Sumitomo Chemical Co Ltd
- BASF SE
- Mitsubishi Chemical Group Corporation
- UBE Corporation
- Umicore SA
- Contemporary Amperex Technology Co Limited
- Nichia Corporation
- ENTEK International LLC
- LG Chem
- Kureha Corporation
List Not Exhaustive
Key Developments in Asia Pacific Electric Vehicle Battery Materials Market Industry
- November 2023: SK On Co., an electric vehicle battery maker, and BASF SE, a battery materials producer, collaborated to develop industry-leading battery materials for lithium-ion batteries in North America and the Asia-Pacific. The companies intended to improve long-term competitiveness amid slowing growth in the eco-friendly automobile industry.
- June 2023: Japan created a solid-air battery that can be recharged. Researchers have shown an all-solid-state rechargeable air battery made of a proton-conductive polymer electrolyte and a redox-active organic negative electrode. These batteries function well in the vicinity of their theoretical maximum capacity.
Strategic Outlook for Asia Pacific Electric Vehicle Battery Materials Market Market
The strategic outlook for the Asia Pacific Electric Vehicle Battery Materials Market remains exceptionally strong, driven by the unyielding global transition towards electric mobility. Key growth catalysts include continued government support through policy incentives and infrastructure development, particularly in emerging markets. The relentless pace of technological innovation, focusing on higher energy density, faster charging, and enhanced safety, will continue to shape the market, with solid-state battery technology poised to be a significant disruptor in the long term. The increasing emphasis on sustainability and the circular economy presents opportunities for companies to develop and implement robust battery recycling solutions and utilize ethically sourced materials. Strategic partnerships and M&A activities will be crucial for companies to secure supply chains, acquire cutting-edge technologies, and expand their market presence. The growing demand for EVs across all vehicle segments, coupled with falling battery costs, will ensure a sustained expansion of this vital industry.
Asia Pacific Electric Vehicle Battery Materials Market Segmentation
-
1. Battery Type
- 1.1. Lithium-ion Battery
- 1.2. Lead-Acid Battery
- 1.3. Others
-
2. Material
- 2.1. Cathode
- 2.2. Anode
- 2.3. Electrolyte
- 2.4. Separator
- 2.5. Others
-
3. Geography
- 3.1. China
- 3.2. India
- 3.3. Australia
- 3.4. Japan
- 3.5. South Korea
- 3.6. Malaysia
- 3.7. Thailand
- 3.8. Indonesia
- 3.9. Vietnam
- 3.10. Rest of Asia-Pacific
Asia Pacific Electric Vehicle Battery Materials Market Segmentation By Geography
- 1. China
- 2. India
- 3. Australia
- 4. Japan
- 5. South Korea
- 6. Malaysia
- 7. Thailand
- 8. Indonesia
- 9. Vietnam
- 10. Rest of Asia Pacific
Asia Pacific Electric Vehicle Battery Materials Market Regional Market Share
Geographic Coverage of Asia Pacific Electric Vehicle Battery Materials Market
Asia Pacific Electric Vehicle Battery Materials Market REPORT HIGHLIGHTS
| Aspects | Details |
|---|---|
| Study Period | 2020-2034 |
| Base Year | 2025 |
| Estimated Year | 2026 |
| Forecast Period | 2026-2034 |
| Historical Period | 2020-2025 |
| Growth Rate | CAGR of 13.61% from 2020-2034 |
| Segmentation |
|
Table of Contents
- 1. Introduction
- 1.1. Research Scope
- 1.2. Market Segmentation
- 1.3. Research Objective
- 1.4. Definitions and Assumptions
- 2. Executive Summary
- 2.1. Market Snapshot
- 3. Market Dynamics
- 3.1. Market Drivers
- 3.2. Market Restrains
- 3.3. Market Trends
- 3.4. Market Opportunities
- 4. Market Factor Analysis
- 4.1. Porters Five Forces
- 4.1.1. Bargaining Power of Suppliers
- 4.1.2. Bargaining Power of Buyers
- 4.1.3. Threat of New Entrants
- 4.1.4. Threat of Substitutes
- 4.1.5. Competitive Rivalry
- 4.2. PESTEL analysis
- 4.3. BCG Analysis
- 4.3.1. Stars (High Growth, High Market Share)
- 4.3.2. Cash Cows (Low Growth, High Market Share)
- 4.3.3. Question Mark (High Growth, Low Market Share)
- 4.3.4. Dogs (Low Growth, Low Market Share)
- 4.4. Ansoff Matrix Analysis
- 4.5. Supply Chain Analysis
- 4.6. Regulatory Landscape
- 4.7. Current Market Potential and Opportunity Assessment (TAM–SAM–SOM Framework)
- 4.8. RAX Analyst Note
- 4.1. Porters Five Forces
- 5. Market Analysis, Insights and Forecast 2021-2033
- 5.1. Market Analysis, Insights and Forecast - by Battery Type
- 5.1.1. Lithium-ion Battery
- 5.1.2. Lead-Acid Battery
- 5.1.3. Others
- 5.2. Market Analysis, Insights and Forecast - by Material
- 5.2.1. Cathode
- 5.2.2. Anode
- 5.2.3. Electrolyte
- 5.2.4. Separator
- 5.2.5. Others
- 5.3. Market Analysis, Insights and Forecast - by Geography
- 5.3.1. China
- 5.3.2. India
- 5.3.3. Australia
- 5.3.4. Japan
- 5.3.5. South Korea
- 5.3.6. Malaysia
- 5.3.7. Thailand
- 5.3.8. Indonesia
- 5.3.9. Vietnam
- 5.3.10. Rest of Asia-Pacific
- 5.4. Market Analysis, Insights and Forecast - by Region
- 5.4.1. China
- 5.4.2. India
- 5.4.3. Australia
- 5.4.4. Japan
- 5.4.5. South Korea
- 5.4.6. Malaysia
- 5.4.7. Thailand
- 5.4.8. Indonesia
- 5.4.9. Vietnam
- 5.4.10. Rest of Asia Pacific
- 5.1. Market Analysis, Insights and Forecast - by Battery Type
- 6. Global Asia Pacific Electric Vehicle Battery Materials Market Analysis, Insights and Forecast, 2021-2033
- 6.1. Market Analysis, Insights and Forecast - by Battery Type
- 6.1.1. Lithium-ion Battery
- 6.1.2. Lead-Acid Battery
- 6.1.3. Others
- 6.2. Market Analysis, Insights and Forecast - by Material
- 6.2.1. Cathode
- 6.2.2. Anode
- 6.2.3. Electrolyte
- 6.2.4. Separator
- 6.2.5. Others
- 6.3. Market Analysis, Insights and Forecast - by Geography
- 6.3.1. China
- 6.3.2. India
- 6.3.3. Australia
- 6.3.4. Japan
- 6.3.5. South Korea
- 6.3.6. Malaysia
- 6.3.7. Thailand
- 6.3.8. Indonesia
- 6.3.9. Vietnam
- 6.3.10. Rest of Asia-Pacific
- 6.1. Market Analysis, Insights and Forecast - by Battery Type
- 7. China Asia Pacific Electric Vehicle Battery Materials Market Analysis, Insights and Forecast, 2020-2032
- 7.1. Market Analysis, Insights and Forecast - by Battery Type
- 7.1.1. Lithium-ion Battery
- 7.1.2. Lead-Acid Battery
- 7.1.3. Others
- 7.2. Market Analysis, Insights and Forecast - by Material
- 7.2.1. Cathode
- 7.2.2. Anode
- 7.2.3. Electrolyte
- 7.2.4. Separator
- 7.2.5. Others
- 7.3. Market Analysis, Insights and Forecast - by Geography
- 7.3.1. China
- 7.3.2. India
- 7.3.3. Australia
- 7.3.4. Japan
- 7.3.5. South Korea
- 7.3.6. Malaysia
- 7.3.7. Thailand
- 7.3.8. Indonesia
- 7.3.9. Vietnam
- 7.3.10. Rest of Asia-Pacific
- 7.1. Market Analysis, Insights and Forecast - by Battery Type
- 8. India Asia Pacific Electric Vehicle Battery Materials Market Analysis, Insights and Forecast, 2020-2032
- 8.1. Market Analysis, Insights and Forecast - by Battery Type
- 8.1.1. Lithium-ion Battery
- 8.1.2. Lead-Acid Battery
- 8.1.3. Others
- 8.2. Market Analysis, Insights and Forecast - by Material
- 8.2.1. Cathode
- 8.2.2. Anode
- 8.2.3. Electrolyte
- 8.2.4. Separator
- 8.2.5. Others
- 8.3. Market Analysis, Insights and Forecast - by Geography
- 8.3.1. China
- 8.3.2. India
- 8.3.3. Australia
- 8.3.4. Japan
- 8.3.5. South Korea
- 8.3.6. Malaysia
- 8.3.7. Thailand
- 8.3.8. Indonesia
- 8.3.9. Vietnam
- 8.3.10. Rest of Asia-Pacific
- 8.1. Market Analysis, Insights and Forecast - by Battery Type
- 9. Australia Asia Pacific Electric Vehicle Battery Materials Market Analysis, Insights and Forecast, 2020-2032
- 9.1. Market Analysis, Insights and Forecast - by Battery Type
- 9.1.1. Lithium-ion Battery
- 9.1.2. Lead-Acid Battery
- 9.1.3. Others
- 9.2. Market Analysis, Insights and Forecast - by Material
- 9.2.1. Cathode
- 9.2.2. Anode
- 9.2.3. Electrolyte
- 9.2.4. Separator
- 9.2.5. Others
- 9.3. Market Analysis, Insights and Forecast - by Geography
- 9.3.1. China
- 9.3.2. India
- 9.3.3. Australia
- 9.3.4. Japan
- 9.3.5. South Korea
- 9.3.6. Malaysia
- 9.3.7. Thailand
- 9.3.8. Indonesia
- 9.3.9. Vietnam
- 9.3.10. Rest of Asia-Pacific
- 9.1. Market Analysis, Insights and Forecast - by Battery Type
- 10. Japan Asia Pacific Electric Vehicle Battery Materials Market Analysis, Insights and Forecast, 2020-2032
- 10.1. Market Analysis, Insights and Forecast - by Battery Type
- 10.1.1. Lithium-ion Battery
- 10.1.2. Lead-Acid Battery
- 10.1.3. Others
- 10.2. Market Analysis, Insights and Forecast - by Material
- 10.2.1. Cathode
- 10.2.2. Anode
- 10.2.3. Electrolyte
- 10.2.4. Separator
- 10.2.5. Others
- 10.3. Market Analysis, Insights and Forecast - by Geography
- 10.3.1. China
- 10.3.2. India
- 10.3.3. Australia
- 10.3.4. Japan
- 10.3.5. South Korea
- 10.3.6. Malaysia
- 10.3.7. Thailand
- 10.3.8. Indonesia
- 10.3.9. Vietnam
- 10.3.10. Rest of Asia-Pacific
- 10.1. Market Analysis, Insights and Forecast - by Battery Type
- 11. South Korea Asia Pacific Electric Vehicle Battery Materials Market Analysis, Insights and Forecast, 2020-2032
- 11.1. Market Analysis, Insights and Forecast - by Battery Type
- 11.1.1. Lithium-ion Battery
- 11.1.2. Lead-Acid Battery
- 11.1.3. Others
- 11.2. Market Analysis, Insights and Forecast - by Material
- 11.2.1. Cathode
- 11.2.2. Anode
- 11.2.3. Electrolyte
- 11.2.4. Separator
- 11.2.5. Others
- 11.3. Market Analysis, Insights and Forecast - by Geography
- 11.3.1. China
- 11.3.2. India
- 11.3.3. Australia
- 11.3.4. Japan
- 11.3.5. South Korea
- 11.3.6. Malaysia
- 11.3.7. Thailand
- 11.3.8. Indonesia
- 11.3.9. Vietnam
- 11.3.10. Rest of Asia-Pacific
- 11.1. Market Analysis, Insights and Forecast - by Battery Type
- 12. Malaysia Asia Pacific Electric Vehicle Battery Materials Market Analysis, Insights and Forecast, 2020-2032
- 12.1. Market Analysis, Insights and Forecast - by Battery Type
- 12.1.1. Lithium-ion Battery
- 12.1.2. Lead-Acid Battery
- 12.1.3. Others
- 12.2. Market Analysis, Insights and Forecast - by Material
- 12.2.1. Cathode
- 12.2.2. Anode
- 12.2.3. Electrolyte
- 12.2.4. Separator
- 12.2.5. Others
- 12.3. Market Analysis, Insights and Forecast - by Geography
- 12.3.1. China
- 12.3.2. India
- 12.3.3. Australia
- 12.3.4. Japan
- 12.3.5. South Korea
- 12.3.6. Malaysia
- 12.3.7. Thailand
- 12.3.8. Indonesia
- 12.3.9. Vietnam
- 12.3.10. Rest of Asia-Pacific
- 12.1. Market Analysis, Insights and Forecast - by Battery Type
- 13. Thailand Asia Pacific Electric Vehicle Battery Materials Market Analysis, Insights and Forecast, 2020-2032
- 13.1. Market Analysis, Insights and Forecast - by Battery Type
- 13.1.1. Lithium-ion Battery
- 13.1.2. Lead-Acid Battery
- 13.1.3. Others
- 13.2. Market Analysis, Insights and Forecast - by Material
- 13.2.1. Cathode
- 13.2.2. Anode
- 13.2.3. Electrolyte
- 13.2.4. Separator
- 13.2.5. Others
- 13.3. Market Analysis, Insights and Forecast - by Geography
- 13.3.1. China
- 13.3.2. India
- 13.3.3. Australia
- 13.3.4. Japan
- 13.3.5. South Korea
- 13.3.6. Malaysia
- 13.3.7. Thailand
- 13.3.8. Indonesia
- 13.3.9. Vietnam
- 13.3.10. Rest of Asia-Pacific
- 13.1. Market Analysis, Insights and Forecast - by Battery Type
- 14. Indonesia Asia Pacific Electric Vehicle Battery Materials Market Analysis, Insights and Forecast, 2020-2032
- 14.1. Market Analysis, Insights and Forecast - by Battery Type
- 14.1.1. Lithium-ion Battery
- 14.1.2. Lead-Acid Battery
- 14.1.3. Others
- 14.2. Market Analysis, Insights and Forecast - by Material
- 14.2.1. Cathode
- 14.2.2. Anode
- 14.2.3. Electrolyte
- 14.2.4. Separator
- 14.2.5. Others
- 14.3. Market Analysis, Insights and Forecast - by Geography
- 14.3.1. China
- 14.3.2. India
- 14.3.3. Australia
- 14.3.4. Japan
- 14.3.5. South Korea
- 14.3.6. Malaysia
- 14.3.7. Thailand
- 14.3.8. Indonesia
- 14.3.9. Vietnam
- 14.3.10. Rest of Asia-Pacific
- 14.1. Market Analysis, Insights and Forecast - by Battery Type
- 15. Vietnam Asia Pacific Electric Vehicle Battery Materials Market Analysis, Insights and Forecast, 2020-2032
- 15.1. Market Analysis, Insights and Forecast - by Battery Type
- 15.1.1. Lithium-ion Battery
- 15.1.2. Lead-Acid Battery
- 15.1.3. Others
- 15.2. Market Analysis, Insights and Forecast - by Material
- 15.2.1. Cathode
- 15.2.2. Anode
- 15.2.3. Electrolyte
- 15.2.4. Separator
- 15.2.5. Others
- 15.3. Market Analysis, Insights and Forecast - by Geography
- 15.3.1. China
- 15.3.2. India
- 15.3.3. Australia
- 15.3.4. Japan
- 15.3.5. South Korea
- 15.3.6. Malaysia
- 15.3.7. Thailand
- 15.3.8. Indonesia
- 15.3.9. Vietnam
- 15.3.10. Rest of Asia-Pacific
- 15.1. Market Analysis, Insights and Forecast - by Battery Type
- 16. Rest of Asia Pacific Asia Pacific Electric Vehicle Battery Materials Market Analysis, Insights and Forecast, 2020-2032
- 16.1. Market Analysis, Insights and Forecast - by Battery Type
- 16.1.1. Lithium-ion Battery
- 16.1.2. Lead-Acid Battery
- 16.1.3. Others
- 16.2. Market Analysis, Insights and Forecast - by Material
- 16.2.1. Cathode
- 16.2.2. Anode
- 16.2.3. Electrolyte
- 16.2.4. Separator
- 16.2.5. Others
- 16.3. Market Analysis, Insights and Forecast - by Geography
- 16.3.1. China
- 16.3.2. India
- 16.3.3. Australia
- 16.3.4. Japan
- 16.3.5. South Korea
- 16.3.6. Malaysia
- 16.3.7. Thailand
- 16.3.8. Indonesia
- 16.3.9. Vietnam
- 16.3.10. Rest of Asia-Pacific
- 16.1. Market Analysis, Insights and Forecast - by Battery Type
- 17. Competitive Analysis
- 17.1. Company Profiles
- 17.1.1 Sumitomo Chemical Co Ltd
- 17.1.1.1. Company Overview
- 17.1.1.2. Products
- 17.1.1.3. Company Financials
- 17.1.1.4. SWOT Analysis
- 17.1.2 BASF SE
- 17.1.2.1. Company Overview
- 17.1.2.2. Products
- 17.1.2.3. Company Financials
- 17.1.2.4. SWOT Analysis
- 17.1.3 Mitsubishi Chemical Group Corporation
- 17.1.3.1. Company Overview
- 17.1.3.2. Products
- 17.1.3.3. Company Financials
- 17.1.3.4. SWOT Analysis
- 17.1.4 UBE Corporation
- 17.1.4.1. Company Overview
- 17.1.4.2. Products
- 17.1.4.3. Company Financials
- 17.1.4.4. SWOT Analysis
- 17.1.5 Umicore SA
- 17.1.5.1. Company Overview
- 17.1.5.2. Products
- 17.1.5.3. Company Financials
- 17.1.5.4. SWOT Analysis
- 17.1.6 Contemporary Amperex Technology Co Limited
- 17.1.6.1. Company Overview
- 17.1.6.2. Products
- 17.1.6.3. Company Financials
- 17.1.6.4. SWOT Analysis
- 17.1.7 Nichia Corporation
- 17.1.7.1. Company Overview
- 17.1.7.2. Products
- 17.1.7.3. Company Financials
- 17.1.7.4. SWOT Analysis
- 17.1.8 ENTEK International LLC
- 17.1.8.1. Company Overview
- 17.1.8.2. Products
- 17.1.8.3. Company Financials
- 17.1.8.4. SWOT Analysis
- 17.1.9 LG Chem
- 17.1.9.1. Company Overview
- 17.1.9.2. Products
- 17.1.9.3. Company Financials
- 17.1.9.4. SWOT Analysis
- 17.1.10 Kureha Corporation*List Not Exhaustive 6 4 List of Other Prominent Companies6 5 Market Ranking/ Share Analysi
- 17.1.10.1. Company Overview
- 17.1.10.2. Products
- 17.1.10.3. Company Financials
- 17.1.10.4. SWOT Analysis
- 17.1.1 Sumitomo Chemical Co Ltd
- 17.2. Market Entropy
- 17.2.1 Company's Key Areas Served
- 17.2.2 Recent Developments
- 17.3. Company Market Share Analysis 2025
- 17.3.1 Top 5 Companies Market Share Analysis
- 17.3.2 Top 3 Companies Market Share Analysis
- 17.4. List of Potential Customers
- 18. Research Methodology
List of Figures
- Figure 1: Global Asia Pacific Electric Vehicle Battery Materials Market Revenue Breakdown (Million, %) by Region 2025 & 2033
- Figure 2: Global Asia Pacific Electric Vehicle Battery Materials Market Volume Breakdown (Billion, %) by Region 2025 & 2033
- Figure 3: China Asia Pacific Electric Vehicle Battery Materials Market Revenue (Million), by Battery Type 2025 & 2033
- Figure 4: China Asia Pacific Electric Vehicle Battery Materials Market Volume (Billion), by Battery Type 2025 & 2033
- Figure 5: China Asia Pacific Electric Vehicle Battery Materials Market Revenue Share (%), by Battery Type 2025 & 2033
- Figure 6: China Asia Pacific Electric Vehicle Battery Materials Market Volume Share (%), by Battery Type 2025 & 2033
- Figure 7: China Asia Pacific Electric Vehicle Battery Materials Market Revenue (Million), by Material 2025 & 2033
- Figure 8: China Asia Pacific Electric Vehicle Battery Materials Market Volume (Billion), by Material 2025 & 2033
- Figure 9: China Asia Pacific Electric Vehicle Battery Materials Market Revenue Share (%), by Material 2025 & 2033
- Figure 10: China Asia Pacific Electric Vehicle Battery Materials Market Volume Share (%), by Material 2025 & 2033
- Figure 11: China Asia Pacific Electric Vehicle Battery Materials Market Revenue (Million), by Geography 2025 & 2033
- Figure 12: China Asia Pacific Electric Vehicle Battery Materials Market Volume (Billion), by Geography 2025 & 2033
- Figure 13: China Asia Pacific Electric Vehicle Battery Materials Market Revenue Share (%), by Geography 2025 & 2033
- Figure 14: China Asia Pacific Electric Vehicle Battery Materials Market Volume Share (%), by Geography 2025 & 2033
- Figure 15: China Asia Pacific Electric Vehicle Battery Materials Market Revenue (Million), by Country 2025 & 2033
- Figure 16: China Asia Pacific Electric Vehicle Battery Materials Market Volume (Billion), by Country 2025 & 2033
- Figure 17: China Asia Pacific Electric Vehicle Battery Materials Market Revenue Share (%), by Country 2025 & 2033
- Figure 18: China Asia Pacific Electric Vehicle Battery Materials Market Volume Share (%), by Country 2025 & 2033
- Figure 19: India Asia Pacific Electric Vehicle Battery Materials Market Revenue (Million), by Battery Type 2025 & 2033
- Figure 20: India Asia Pacific Electric Vehicle Battery Materials Market Volume (Billion), by Battery Type 2025 & 2033
- Figure 21: India Asia Pacific Electric Vehicle Battery Materials Market Revenue Share (%), by Battery Type 2025 & 2033
- Figure 22: India Asia Pacific Electric Vehicle Battery Materials Market Volume Share (%), by Battery Type 2025 & 2033
- Figure 23: India Asia Pacific Electric Vehicle Battery Materials Market Revenue (Million), by Material 2025 & 2033
- Figure 24: India Asia Pacific Electric Vehicle Battery Materials Market Volume (Billion), by Material 2025 & 2033
- Figure 25: India Asia Pacific Electric Vehicle Battery Materials Market Revenue Share (%), by Material 2025 & 2033
- Figure 26: India Asia Pacific Electric Vehicle Battery Materials Market Volume Share (%), by Material 2025 & 2033
- Figure 27: India Asia Pacific Electric Vehicle Battery Materials Market Revenue (Million), by Geography 2025 & 2033
- Figure 28: India Asia Pacific Electric Vehicle Battery Materials Market Volume (Billion), by Geography 2025 & 2033
- Figure 29: India Asia Pacific Electric Vehicle Battery Materials Market Revenue Share (%), by Geography 2025 & 2033
- Figure 30: India Asia Pacific Electric Vehicle Battery Materials Market Volume Share (%), by Geography 2025 & 2033
- Figure 31: India Asia Pacific Electric Vehicle Battery Materials Market Revenue (Million), by Country 2025 & 2033
- Figure 32: India Asia Pacific Electric Vehicle Battery Materials Market Volume (Billion), by Country 2025 & 2033
- Figure 33: India Asia Pacific Electric Vehicle Battery Materials Market Revenue Share (%), by Country 2025 & 2033
- Figure 34: India Asia Pacific Electric Vehicle Battery Materials Market Volume Share (%), by Country 2025 & 2033
- Figure 35: Australia Asia Pacific Electric Vehicle Battery Materials Market Revenue (Million), by Battery Type 2025 & 2033
- Figure 36: Australia Asia Pacific Electric Vehicle Battery Materials Market Volume (Billion), by Battery Type 2025 & 2033
- Figure 37: Australia Asia Pacific Electric Vehicle Battery Materials Market Revenue Share (%), by Battery Type 2025 & 2033
- Figure 38: Australia Asia Pacific Electric Vehicle Battery Materials Market Volume Share (%), by Battery Type 2025 & 2033
- Figure 39: Australia Asia Pacific Electric Vehicle Battery Materials Market Revenue (Million), by Material 2025 & 2033
- Figure 40: Australia Asia Pacific Electric Vehicle Battery Materials Market Volume (Billion), by Material 2025 & 2033
- Figure 41: Australia Asia Pacific Electric Vehicle Battery Materials Market Revenue Share (%), by Material 2025 & 2033
- Figure 42: Australia Asia Pacific Electric Vehicle Battery Materials Market Volume Share (%), by Material 2025 & 2033
- Figure 43: Australia Asia Pacific Electric Vehicle Battery Materials Market Revenue (Million), by Geography 2025 & 2033
- Figure 44: Australia Asia Pacific Electric Vehicle Battery Materials Market Volume (Billion), by Geography 2025 & 2033
- Figure 45: Australia Asia Pacific Electric Vehicle Battery Materials Market Revenue Share (%), by Geography 2025 & 2033
- Figure 46: Australia Asia Pacific Electric Vehicle Battery Materials Market Volume Share (%), by Geography 2025 & 2033
- Figure 47: Australia Asia Pacific Electric Vehicle Battery Materials Market Revenue (Million), by Country 2025 & 2033
- Figure 48: Australia Asia Pacific Electric Vehicle Battery Materials Market Volume (Billion), by Country 2025 & 2033
- Figure 49: Australia Asia Pacific Electric Vehicle Battery Materials Market Revenue Share (%), by Country 2025 & 2033
- Figure 50: Australia Asia Pacific Electric Vehicle Battery Materials Market Volume Share (%), by Country 2025 & 2033
- Figure 51: Japan Asia Pacific Electric Vehicle Battery Materials Market Revenue (Million), by Battery Type 2025 & 2033
- Figure 52: Japan Asia Pacific Electric Vehicle Battery Materials Market Volume (Billion), by Battery Type 2025 & 2033
- Figure 53: Japan Asia Pacific Electric Vehicle Battery Materials Market Revenue Share (%), by Battery Type 2025 & 2033
- Figure 54: Japan Asia Pacific Electric Vehicle Battery Materials Market Volume Share (%), by Battery Type 2025 & 2033
- Figure 55: Japan Asia Pacific Electric Vehicle Battery Materials Market Revenue (Million), by Material 2025 & 2033
- Figure 56: Japan Asia Pacific Electric Vehicle Battery Materials Market Volume (Billion), by Material 2025 & 2033
- Figure 57: Japan Asia Pacific Electric Vehicle Battery Materials Market Revenue Share (%), by Material 2025 & 2033
- Figure 58: Japan Asia Pacific Electric Vehicle Battery Materials Market Volume Share (%), by Material 2025 & 2033
- Figure 59: Japan Asia Pacific Electric Vehicle Battery Materials Market Revenue (Million), by Geography 2025 & 2033
- Figure 60: Japan Asia Pacific Electric Vehicle Battery Materials Market Volume (Billion), by Geography 2025 & 2033
- Figure 61: Japan Asia Pacific Electric Vehicle Battery Materials Market Revenue Share (%), by Geography 2025 & 2033
- Figure 62: Japan Asia Pacific Electric Vehicle Battery Materials Market Volume Share (%), by Geography 2025 & 2033
- Figure 63: Japan Asia Pacific Electric Vehicle Battery Materials Market Revenue (Million), by Country 2025 & 2033
- Figure 64: Japan Asia Pacific Electric Vehicle Battery Materials Market Volume (Billion), by Country 2025 & 2033
- Figure 65: Japan Asia Pacific Electric Vehicle Battery Materials Market Revenue Share (%), by Country 2025 & 2033
- Figure 66: Japan Asia Pacific Electric Vehicle Battery Materials Market Volume Share (%), by Country 2025 & 2033
- Figure 67: South Korea Asia Pacific Electric Vehicle Battery Materials Market Revenue (Million), by Battery Type 2025 & 2033
- Figure 68: South Korea Asia Pacific Electric Vehicle Battery Materials Market Volume (Billion), by Battery Type 2025 & 2033
- Figure 69: South Korea Asia Pacific Electric Vehicle Battery Materials Market Revenue Share (%), by Battery Type 2025 & 2033
- Figure 70: South Korea Asia Pacific Electric Vehicle Battery Materials Market Volume Share (%), by Battery Type 2025 & 2033
- Figure 71: South Korea Asia Pacific Electric Vehicle Battery Materials Market Revenue (Million), by Material 2025 & 2033
- Figure 72: South Korea Asia Pacific Electric Vehicle Battery Materials Market Volume (Billion), by Material 2025 & 2033
- Figure 73: South Korea Asia Pacific Electric Vehicle Battery Materials Market Revenue Share (%), by Material 2025 & 2033
- Figure 74: South Korea Asia Pacific Electric Vehicle Battery Materials Market Volume Share (%), by Material 2025 & 2033
- Figure 75: South Korea Asia Pacific Electric Vehicle Battery Materials Market Revenue (Million), by Geography 2025 & 2033
- Figure 76: South Korea Asia Pacific Electric Vehicle Battery Materials Market Volume (Billion), by Geography 2025 & 2033
- Figure 77: South Korea Asia Pacific Electric Vehicle Battery Materials Market Revenue Share (%), by Geography 2025 & 2033
- Figure 78: South Korea Asia Pacific Electric Vehicle Battery Materials Market Volume Share (%), by Geography 2025 & 2033
- Figure 79: South Korea Asia Pacific Electric Vehicle Battery Materials Market Revenue (Million), by Country 2025 & 2033
- Figure 80: South Korea Asia Pacific Electric Vehicle Battery Materials Market Volume (Billion), by Country 2025 & 2033
- Figure 81: South Korea Asia Pacific Electric Vehicle Battery Materials Market Revenue Share (%), by Country 2025 & 2033
- Figure 82: South Korea Asia Pacific Electric Vehicle Battery Materials Market Volume Share (%), by Country 2025 & 2033
- Figure 83: Malaysia Asia Pacific Electric Vehicle Battery Materials Market Revenue (Million), by Battery Type 2025 & 2033
- Figure 84: Malaysia Asia Pacific Electric Vehicle Battery Materials Market Volume (Billion), by Battery Type 2025 & 2033
- Figure 85: Malaysia Asia Pacific Electric Vehicle Battery Materials Market Revenue Share (%), by Battery Type 2025 & 2033
- Figure 86: Malaysia Asia Pacific Electric Vehicle Battery Materials Market Volume Share (%), by Battery Type 2025 & 2033
- Figure 87: Malaysia Asia Pacific Electric Vehicle Battery Materials Market Revenue (Million), by Material 2025 & 2033
- Figure 88: Malaysia Asia Pacific Electric Vehicle Battery Materials Market Volume (Billion), by Material 2025 & 2033
- Figure 89: Malaysia Asia Pacific Electric Vehicle Battery Materials Market Revenue Share (%), by Material 2025 & 2033
- Figure 90: Malaysia Asia Pacific Electric Vehicle Battery Materials Market Volume Share (%), by Material 2025 & 2033
- Figure 91: Malaysia Asia Pacific Electric Vehicle Battery Materials Market Revenue (Million), by Geography 2025 & 2033
- Figure 92: Malaysia Asia Pacific Electric Vehicle Battery Materials Market Volume (Billion), by Geography 2025 & 2033
- Figure 93: Malaysia Asia Pacific Electric Vehicle Battery Materials Market Revenue Share (%), by Geography 2025 & 2033
- Figure 94: Malaysia Asia Pacific Electric Vehicle Battery Materials Market Volume Share (%), by Geography 2025 & 2033
- Figure 95: Malaysia Asia Pacific Electric Vehicle Battery Materials Market Revenue (Million), by Country 2025 & 2033
- Figure 96: Malaysia Asia Pacific Electric Vehicle Battery Materials Market Volume (Billion), by Country 2025 & 2033
- Figure 97: Malaysia Asia Pacific Electric Vehicle Battery Materials Market Revenue Share (%), by Country 2025 & 2033
- Figure 98: Malaysia Asia Pacific Electric Vehicle Battery Materials Market Volume Share (%), by Country 2025 & 2033
- Figure 99: Thailand Asia Pacific Electric Vehicle Battery Materials Market Revenue (Million), by Battery Type 2025 & 2033
- Figure 100: Thailand Asia Pacific Electric Vehicle Battery Materials Market Volume (Billion), by Battery Type 2025 & 2033
- Figure 101: Thailand Asia Pacific Electric Vehicle Battery Materials Market Revenue Share (%), by Battery Type 2025 & 2033
- Figure 102: Thailand Asia Pacific Electric Vehicle Battery Materials Market Volume Share (%), by Battery Type 2025 & 2033
- Figure 103: Thailand Asia Pacific Electric Vehicle Battery Materials Market Revenue (Million), by Material 2025 & 2033
- Figure 104: Thailand Asia Pacific Electric Vehicle Battery Materials Market Volume (Billion), by Material 2025 & 2033
- Figure 105: Thailand Asia Pacific Electric Vehicle Battery Materials Market Revenue Share (%), by Material 2025 & 2033
- Figure 106: Thailand Asia Pacific Electric Vehicle Battery Materials Market Volume Share (%), by Material 2025 & 2033
- Figure 107: Thailand Asia Pacific Electric Vehicle Battery Materials Market Revenue (Million), by Geography 2025 & 2033
- Figure 108: Thailand Asia Pacific Electric Vehicle Battery Materials Market Volume (Billion), by Geography 2025 & 2033
- Figure 109: Thailand Asia Pacific Electric Vehicle Battery Materials Market Revenue Share (%), by Geography 2025 & 2033
- Figure 110: Thailand Asia Pacific Electric Vehicle Battery Materials Market Volume Share (%), by Geography 2025 & 2033
- Figure 111: Thailand Asia Pacific Electric Vehicle Battery Materials Market Revenue (Million), by Country 2025 & 2033
- Figure 112: Thailand Asia Pacific Electric Vehicle Battery Materials Market Volume (Billion), by Country 2025 & 2033
- Figure 113: Thailand Asia Pacific Electric Vehicle Battery Materials Market Revenue Share (%), by Country 2025 & 2033
- Figure 114: Thailand Asia Pacific Electric Vehicle Battery Materials Market Volume Share (%), by Country 2025 & 2033
- Figure 115: Indonesia Asia Pacific Electric Vehicle Battery Materials Market Revenue (Million), by Battery Type 2025 & 2033
- Figure 116: Indonesia Asia Pacific Electric Vehicle Battery Materials Market Volume (Billion), by Battery Type 2025 & 2033
- Figure 117: Indonesia Asia Pacific Electric Vehicle Battery Materials Market Revenue Share (%), by Battery Type 2025 & 2033
- Figure 118: Indonesia Asia Pacific Electric Vehicle Battery Materials Market Volume Share (%), by Battery Type 2025 & 2033
- Figure 119: Indonesia Asia Pacific Electric Vehicle Battery Materials Market Revenue (Million), by Material 2025 & 2033
- Figure 120: Indonesia Asia Pacific Electric Vehicle Battery Materials Market Volume (Billion), by Material 2025 & 2033
- Figure 121: Indonesia Asia Pacific Electric Vehicle Battery Materials Market Revenue Share (%), by Material 2025 & 2033
- Figure 122: Indonesia Asia Pacific Electric Vehicle Battery Materials Market Volume Share (%), by Material 2025 & 2033
- Figure 123: Indonesia Asia Pacific Electric Vehicle Battery Materials Market Revenue (Million), by Geography 2025 & 2033
- Figure 124: Indonesia Asia Pacific Electric Vehicle Battery Materials Market Volume (Billion), by Geography 2025 & 2033
- Figure 125: Indonesia Asia Pacific Electric Vehicle Battery Materials Market Revenue Share (%), by Geography 2025 & 2033
- Figure 126: Indonesia Asia Pacific Electric Vehicle Battery Materials Market Volume Share (%), by Geography 2025 & 2033
- Figure 127: Indonesia Asia Pacific Electric Vehicle Battery Materials Market Revenue (Million), by Country 2025 & 2033
- Figure 128: Indonesia Asia Pacific Electric Vehicle Battery Materials Market Volume (Billion), by Country 2025 & 2033
- Figure 129: Indonesia Asia Pacific Electric Vehicle Battery Materials Market Revenue Share (%), by Country 2025 & 2033
- Figure 130: Indonesia Asia Pacific Electric Vehicle Battery Materials Market Volume Share (%), by Country 2025 & 2033
- Figure 131: Vietnam Asia Pacific Electric Vehicle Battery Materials Market Revenue (Million), by Battery Type 2025 & 2033
- Figure 132: Vietnam Asia Pacific Electric Vehicle Battery Materials Market Volume (Billion), by Battery Type 2025 & 2033
- Figure 133: Vietnam Asia Pacific Electric Vehicle Battery Materials Market Revenue Share (%), by Battery Type 2025 & 2033
- Figure 134: Vietnam Asia Pacific Electric Vehicle Battery Materials Market Volume Share (%), by Battery Type 2025 & 2033
- Figure 135: Vietnam Asia Pacific Electric Vehicle Battery Materials Market Revenue (Million), by Material 2025 & 2033
- Figure 136: Vietnam Asia Pacific Electric Vehicle Battery Materials Market Volume (Billion), by Material 2025 & 2033
- Figure 137: Vietnam Asia Pacific Electric Vehicle Battery Materials Market Revenue Share (%), by Material 2025 & 2033
- Figure 138: Vietnam Asia Pacific Electric Vehicle Battery Materials Market Volume Share (%), by Material 2025 & 2033
- Figure 139: Vietnam Asia Pacific Electric Vehicle Battery Materials Market Revenue (Million), by Geography 2025 & 2033
- Figure 140: Vietnam Asia Pacific Electric Vehicle Battery Materials Market Volume (Billion), by Geography 2025 & 2033
- Figure 141: Vietnam Asia Pacific Electric Vehicle Battery Materials Market Revenue Share (%), by Geography 2025 & 2033
- Figure 142: Vietnam Asia Pacific Electric Vehicle Battery Materials Market Volume Share (%), by Geography 2025 & 2033
- Figure 143: Vietnam Asia Pacific Electric Vehicle Battery Materials Market Revenue (Million), by Country 2025 & 2033
- Figure 144: Vietnam Asia Pacific Electric Vehicle Battery Materials Market Volume (Billion), by Country 2025 & 2033
- Figure 145: Vietnam Asia Pacific Electric Vehicle Battery Materials Market Revenue Share (%), by Country 2025 & 2033
- Figure 146: Vietnam Asia Pacific Electric Vehicle Battery Materials Market Volume Share (%), by Country 2025 & 2033
- Figure 147: Rest of Asia Pacific Asia Pacific Electric Vehicle Battery Materials Market Revenue (Million), by Battery Type 2025 & 2033
- Figure 148: Rest of Asia Pacific Asia Pacific Electric Vehicle Battery Materials Market Volume (Billion), by Battery Type 2025 & 2033
- Figure 149: Rest of Asia Pacific Asia Pacific Electric Vehicle Battery Materials Market Revenue Share (%), by Battery Type 2025 & 2033
- Figure 150: Rest of Asia Pacific Asia Pacific Electric Vehicle Battery Materials Market Volume Share (%), by Battery Type 2025 & 2033
- Figure 151: Rest of Asia Pacific Asia Pacific Electric Vehicle Battery Materials Market Revenue (Million), by Material 2025 & 2033
- Figure 152: Rest of Asia Pacific Asia Pacific Electric Vehicle Battery Materials Market Volume (Billion), by Material 2025 & 2033
- Figure 153: Rest of Asia Pacific Asia Pacific Electric Vehicle Battery Materials Market Revenue Share (%), by Material 2025 & 2033
- Figure 154: Rest of Asia Pacific Asia Pacific Electric Vehicle Battery Materials Market Volume Share (%), by Material 2025 & 2033
- Figure 155: Rest of Asia Pacific Asia Pacific Electric Vehicle Battery Materials Market Revenue (Million), by Geography 2025 & 2033
- Figure 156: Rest of Asia Pacific Asia Pacific Electric Vehicle Battery Materials Market Volume (Billion), by Geography 2025 & 2033
- Figure 157: Rest of Asia Pacific Asia Pacific Electric Vehicle Battery Materials Market Revenue Share (%), by Geography 2025 & 2033
- Figure 158: Rest of Asia Pacific Asia Pacific Electric Vehicle Battery Materials Market Volume Share (%), by Geography 2025 & 2033
- Figure 159: Rest of Asia Pacific Asia Pacific Electric Vehicle Battery Materials Market Revenue (Million), by Country 2025 & 2033
- Figure 160: Rest of Asia Pacific Asia Pacific Electric Vehicle Battery Materials Market Volume (Billion), by Country 2025 & 2033
- Figure 161: Rest of Asia Pacific Asia Pacific Electric Vehicle Battery Materials Market Revenue Share (%), by Country 2025 & 2033
- Figure 162: Rest of Asia Pacific Asia Pacific Electric Vehicle Battery Materials Market Volume Share (%), by Country 2025 & 2033
List of Tables
- Table 1: Global Asia Pacific Electric Vehicle Battery Materials Market Revenue Million Forecast, by Battery Type 2020 & 2033
- Table 2: Global Asia Pacific Electric Vehicle Battery Materials Market Volume Billion Forecast, by Battery Type 2020 & 2033
- Table 3: Global Asia Pacific Electric Vehicle Battery Materials Market Revenue Million Forecast, by Material 2020 & 2033
- Table 4: Global Asia Pacific Electric Vehicle Battery Materials Market Volume Billion Forecast, by Material 2020 & 2033
- Table 5: Global Asia Pacific Electric Vehicle Battery Materials Market Revenue Million Forecast, by Geography 2020 & 2033
- Table 6: Global Asia Pacific Electric Vehicle Battery Materials Market Volume Billion Forecast, by Geography 2020 & 2033
- Table 7: Global Asia Pacific Electric Vehicle Battery Materials Market Revenue Million Forecast, by Region 2020 & 2033
- Table 8: Global Asia Pacific Electric Vehicle Battery Materials Market Volume Billion Forecast, by Region 2020 & 2033
- Table 9: Global Asia Pacific Electric Vehicle Battery Materials Market Revenue Million Forecast, by Battery Type 2020 & 2033
- Table 10: Global Asia Pacific Electric Vehicle Battery Materials Market Volume Billion Forecast, by Battery Type 2020 & 2033
- Table 11: Global Asia Pacific Electric Vehicle Battery Materials Market Revenue Million Forecast, by Material 2020 & 2033
- Table 12: Global Asia Pacific Electric Vehicle Battery Materials Market Volume Billion Forecast, by Material 2020 & 2033
- Table 13: Global Asia Pacific Electric Vehicle Battery Materials Market Revenue Million Forecast, by Geography 2020 & 2033
- Table 14: Global Asia Pacific Electric Vehicle Battery Materials Market Volume Billion Forecast, by Geography 2020 & 2033
- Table 15: Global Asia Pacific Electric Vehicle Battery Materials Market Revenue Million Forecast, by Country 2020 & 2033
- Table 16: Global Asia Pacific Electric Vehicle Battery Materials Market Volume Billion Forecast, by Country 2020 & 2033
- Table 17: Global Asia Pacific Electric Vehicle Battery Materials Market Revenue Million Forecast, by Battery Type 2020 & 2033
- Table 18: Global Asia Pacific Electric Vehicle Battery Materials Market Volume Billion Forecast, by Battery Type 2020 & 2033
- Table 19: Global Asia Pacific Electric Vehicle Battery Materials Market Revenue Million Forecast, by Material 2020 & 2033
- Table 20: Global Asia Pacific Electric Vehicle Battery Materials Market Volume Billion Forecast, by Material 2020 & 2033
- Table 21: Global Asia Pacific Electric Vehicle Battery Materials Market Revenue Million Forecast, by Geography 2020 & 2033
- Table 22: Global Asia Pacific Electric Vehicle Battery Materials Market Volume Billion Forecast, by Geography 2020 & 2033
- Table 23: Global Asia Pacific Electric Vehicle Battery Materials Market Revenue Million Forecast, by Country 2020 & 2033
- Table 24: Global Asia Pacific Electric Vehicle Battery Materials Market Volume Billion Forecast, by Country 2020 & 2033
- Table 25: Global Asia Pacific Electric Vehicle Battery Materials Market Revenue Million Forecast, by Battery Type 2020 & 2033
- Table 26: Global Asia Pacific Electric Vehicle Battery Materials Market Volume Billion Forecast, by Battery Type 2020 & 2033
- Table 27: Global Asia Pacific Electric Vehicle Battery Materials Market Revenue Million Forecast, by Material 2020 & 2033
- Table 28: Global Asia Pacific Electric Vehicle Battery Materials Market Volume Billion Forecast, by Material 2020 & 2033
- Table 29: Global Asia Pacific Electric Vehicle Battery Materials Market Revenue Million Forecast, by Geography 2020 & 2033
- Table 30: Global Asia Pacific Electric Vehicle Battery Materials Market Volume Billion Forecast, by Geography 2020 & 2033
- Table 31: Global Asia Pacific Electric Vehicle Battery Materials Market Revenue Million Forecast, by Country 2020 & 2033
- Table 32: Global Asia Pacific Electric Vehicle Battery Materials Market Volume Billion Forecast, by Country 2020 & 2033
- Table 33: Global Asia Pacific Electric Vehicle Battery Materials Market Revenue Million Forecast, by Battery Type 2020 & 2033
- Table 34: Global Asia Pacific Electric Vehicle Battery Materials Market Volume Billion Forecast, by Battery Type 2020 & 2033
- Table 35: Global Asia Pacific Electric Vehicle Battery Materials Market Revenue Million Forecast, by Material 2020 & 2033
- Table 36: Global Asia Pacific Electric Vehicle Battery Materials Market Volume Billion Forecast, by Material 2020 & 2033
- Table 37: Global Asia Pacific Electric Vehicle Battery Materials Market Revenue Million Forecast, by Geography 2020 & 2033
- Table 38: Global Asia Pacific Electric Vehicle Battery Materials Market Volume Billion Forecast, by Geography 2020 & 2033
- Table 39: Global Asia Pacific Electric Vehicle Battery Materials Market Revenue Million Forecast, by Country 2020 & 2033
- Table 40: Global Asia Pacific Electric Vehicle Battery Materials Market Volume Billion Forecast, by Country 2020 & 2033
- Table 41: Global Asia Pacific Electric Vehicle Battery Materials Market Revenue Million Forecast, by Battery Type 2020 & 2033
- Table 42: Global Asia Pacific Electric Vehicle Battery Materials Market Volume Billion Forecast, by Battery Type 2020 & 2033
- Table 43: Global Asia Pacific Electric Vehicle Battery Materials Market Revenue Million Forecast, by Material 2020 & 2033
- Table 44: Global Asia Pacific Electric Vehicle Battery Materials Market Volume Billion Forecast, by Material 2020 & 2033
- Table 45: Global Asia Pacific Electric Vehicle Battery Materials Market Revenue Million Forecast, by Geography 2020 & 2033
- Table 46: Global Asia Pacific Electric Vehicle Battery Materials Market Volume Billion Forecast, by Geography 2020 & 2033
- Table 47: Global Asia Pacific Electric Vehicle Battery Materials Market Revenue Million Forecast, by Country 2020 & 2033
- Table 48: Global Asia Pacific Electric Vehicle Battery Materials Market Volume Billion Forecast, by Country 2020 & 2033
- Table 49: Global Asia Pacific Electric Vehicle Battery Materials Market Revenue Million Forecast, by Battery Type 2020 & 2033
- Table 50: Global Asia Pacific Electric Vehicle Battery Materials Market Volume Billion Forecast, by Battery Type 2020 & 2033
- Table 51: Global Asia Pacific Electric Vehicle Battery Materials Market Revenue Million Forecast, by Material 2020 & 2033
- Table 52: Global Asia Pacific Electric Vehicle Battery Materials Market Volume Billion Forecast, by Material 2020 & 2033
- Table 53: Global Asia Pacific Electric Vehicle Battery Materials Market Revenue Million Forecast, by Geography 2020 & 2033
- Table 54: Global Asia Pacific Electric Vehicle Battery Materials Market Volume Billion Forecast, by Geography 2020 & 2033
- Table 55: Global Asia Pacific Electric Vehicle Battery Materials Market Revenue Million Forecast, by Country 2020 & 2033
- Table 56: Global Asia Pacific Electric Vehicle Battery Materials Market Volume Billion Forecast, by Country 2020 & 2033
- Table 57: Global Asia Pacific Electric Vehicle Battery Materials Market Revenue Million Forecast, by Battery Type 2020 & 2033
- Table 58: Global Asia Pacific Electric Vehicle Battery Materials Market Volume Billion Forecast, by Battery Type 2020 & 2033
- Table 59: Global Asia Pacific Electric Vehicle Battery Materials Market Revenue Million Forecast, by Material 2020 & 2033
- Table 60: Global Asia Pacific Electric Vehicle Battery Materials Market Volume Billion Forecast, by Material 2020 & 2033
- Table 61: Global Asia Pacific Electric Vehicle Battery Materials Market Revenue Million Forecast, by Geography 2020 & 2033
- Table 62: Global Asia Pacific Electric Vehicle Battery Materials Market Volume Billion Forecast, by Geography 2020 & 2033
- Table 63: Global Asia Pacific Electric Vehicle Battery Materials Market Revenue Million Forecast, by Country 2020 & 2033
- Table 64: Global Asia Pacific Electric Vehicle Battery Materials Market Volume Billion Forecast, by Country 2020 & 2033
- Table 65: Global Asia Pacific Electric Vehicle Battery Materials Market Revenue Million Forecast, by Battery Type 2020 & 2033
- Table 66: Global Asia Pacific Electric Vehicle Battery Materials Market Volume Billion Forecast, by Battery Type 2020 & 2033
- Table 67: Global Asia Pacific Electric Vehicle Battery Materials Market Revenue Million Forecast, by Material 2020 & 2033
- Table 68: Global Asia Pacific Electric Vehicle Battery Materials Market Volume Billion Forecast, by Material 2020 & 2033
- Table 69: Global Asia Pacific Electric Vehicle Battery Materials Market Revenue Million Forecast, by Geography 2020 & 2033
- Table 70: Global Asia Pacific Electric Vehicle Battery Materials Market Volume Billion Forecast, by Geography 2020 & 2033
- Table 71: Global Asia Pacific Electric Vehicle Battery Materials Market Revenue Million Forecast, by Country 2020 & 2033
- Table 72: Global Asia Pacific Electric Vehicle Battery Materials Market Volume Billion Forecast, by Country 2020 & 2033
- Table 73: Global Asia Pacific Electric Vehicle Battery Materials Market Revenue Million Forecast, by Battery Type 2020 & 2033
- Table 74: Global Asia Pacific Electric Vehicle Battery Materials Market Volume Billion Forecast, by Battery Type 2020 & 2033
- Table 75: Global Asia Pacific Electric Vehicle Battery Materials Market Revenue Million Forecast, by Material 2020 & 2033
- Table 76: Global Asia Pacific Electric Vehicle Battery Materials Market Volume Billion Forecast, by Material 2020 & 2033
- Table 77: Global Asia Pacific Electric Vehicle Battery Materials Market Revenue Million Forecast, by Geography 2020 & 2033
- Table 78: Global Asia Pacific Electric Vehicle Battery Materials Market Volume Billion Forecast, by Geography 2020 & 2033
- Table 79: Global Asia Pacific Electric Vehicle Battery Materials Market Revenue Million Forecast, by Country 2020 & 2033
- Table 80: Global Asia Pacific Electric Vehicle Battery Materials Market Volume Billion Forecast, by Country 2020 & 2033
- Table 81: Global Asia Pacific Electric Vehicle Battery Materials Market Revenue Million Forecast, by Battery Type 2020 & 2033
- Table 82: Global Asia Pacific Electric Vehicle Battery Materials Market Volume Billion Forecast, by Battery Type 2020 & 2033
- Table 83: Global Asia Pacific Electric Vehicle Battery Materials Market Revenue Million Forecast, by Material 2020 & 2033
- Table 84: Global Asia Pacific Electric Vehicle Battery Materials Market Volume Billion Forecast, by Material 2020 & 2033
- Table 85: Global Asia Pacific Electric Vehicle Battery Materials Market Revenue Million Forecast, by Geography 2020 & 2033
- Table 86: Global Asia Pacific Electric Vehicle Battery Materials Market Volume Billion Forecast, by Geography 2020 & 2033
- Table 87: Global Asia Pacific Electric Vehicle Battery Materials Market Revenue Million Forecast, by Country 2020 & 2033
- Table 88: Global Asia Pacific Electric Vehicle Battery Materials Market Volume Billion Forecast, by Country 2020 & 2033
Frequently Asked Questions
1. What is the projected Compound Annual Growth Rate (CAGR) of the Asia Pacific Electric Vehicle Battery Materials Market?
The projected CAGR is approximately 13.61%.
2. Which companies are prominent players in the Asia Pacific Electric Vehicle Battery Materials Market?
Key companies in the market include Sumitomo Chemical Co Ltd, BASF SE, Mitsubishi Chemical Group Corporation, UBE Corporation, Umicore SA, Contemporary Amperex Technology Co Limited, Nichia Corporation, ENTEK International LLC, LG Chem, Kureha Corporation*List Not Exhaustive 6 4 List of Other Prominent Companies6 5 Market Ranking/ Share Analysi.
3. What are the main segments of the Asia Pacific Electric Vehicle Battery Materials Market?
The market segments include Battery Type, Material, Geography.
4. Can you provide details about the market size?
The market size is estimated to be USD 16.84 Million as of 2022.
5. What are some drivers contributing to market growth?
4.; Growing Electric Vehicle Sales4.; Supportive Government Policies and Regulations.
6. What are the notable trends driving market growth?
Lithium-Ion Battery Type Dominate the Market.
7. Are there any restraints impacting market growth?
4.; Growing Electric Vehicle Sales4.; Supportive Government Policies and Regulations.
8. Can you provide examples of recent developments in the market?
November 2023: SK On Co., an electric vehicle battery maker, and BASF SE, a battery materials producer, collaborated to develop industry-leading battery materials for lithium-ion batteries in North America and the Asia-Pacific. The companies intended to improve long-term competitiveness amid slowing growth in the eco-friendly automobile industry.June 2023: Japan created a solid-air battery that can be recharged. Researchers have shown an all-solid-state rechargeable air battery made of a proton-conductive polymer electrolyte and a redox-active organic negative electrode. These batteries function well in the vicinity of their theoretical maximum capacity.
9. What pricing options are available for accessing the report?
Pricing options include single-user, multi-user, and enterprise licenses priced at USD 4750, USD 5250, and USD 8750 respectively.
10. Is the market size provided in terms of value or volume?
The market size is provided in terms of value, measured in Million and volume, measured in Billion.
11. Are there any specific market keywords associated with the report?
Yes, the market keyword associated with the report is "Asia Pacific Electric Vehicle Battery Materials Market," which aids in identifying and referencing the specific market segment covered.
12. How do I determine which pricing option suits my needs best?
The pricing options vary based on user requirements and access needs. Individual users may opt for single-user licenses, while businesses requiring broader access may choose multi-user or enterprise licenses for cost-effective access to the report.
13. Are there any additional resources or data provided in the Asia Pacific Electric Vehicle Battery Materials Market report?
While the report offers comprehensive insights, it's advisable to review the specific contents or supplementary materials provided to ascertain if additional resources or data are available.
14. How can I stay updated on further developments or reports in the Asia Pacific Electric Vehicle Battery Materials Market?
To stay informed about further developments, trends, and reports in the Asia Pacific Electric Vehicle Battery Materials Market, consider subscribing to industry newsletters, following relevant companies and organizations, or regularly checking reputable industry news sources and publications.
Methodology
Step 1 - Identification of Relevant Samples Size from Population Database


Step 2 - Approaches for Defining Global Market Size (Value, Volume* & Price*)

Note*: In applicable scenarios
Step 3 - Data Sources
Primary Research
- Web Analytics
- Survey Reports
- Research Institute
- Latest Research Reports
- Opinion Leaders
Secondary Research
- Annual Reports
- White Paper
- Latest Press Release
- Industry Association
- Paid Database
- Investor Presentations

Step 4 - Data Triangulation
Involves using different sources of information in order to increase the validity of a study
These sources are likely to be stakeholders in a program - participants, other researchers, program staff, other community members, and so on.
Then we put all data in single framework & apply various statistical tools to find out the dynamic on the market.
During the analysis stage, feedback from the stakeholder groups would be compared to determine areas of agreement as well as areas of divergence