
Key Insights
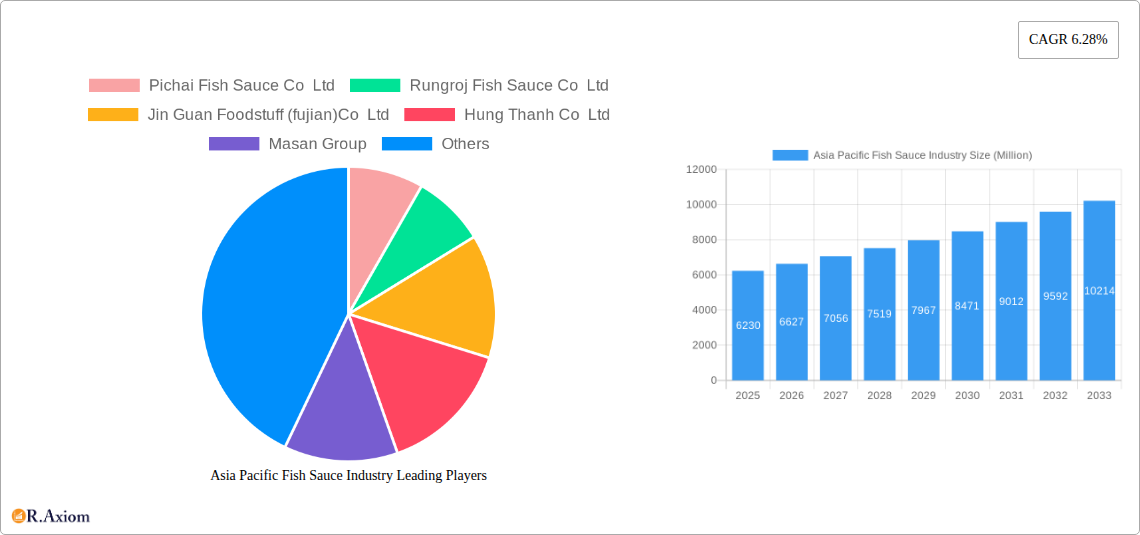
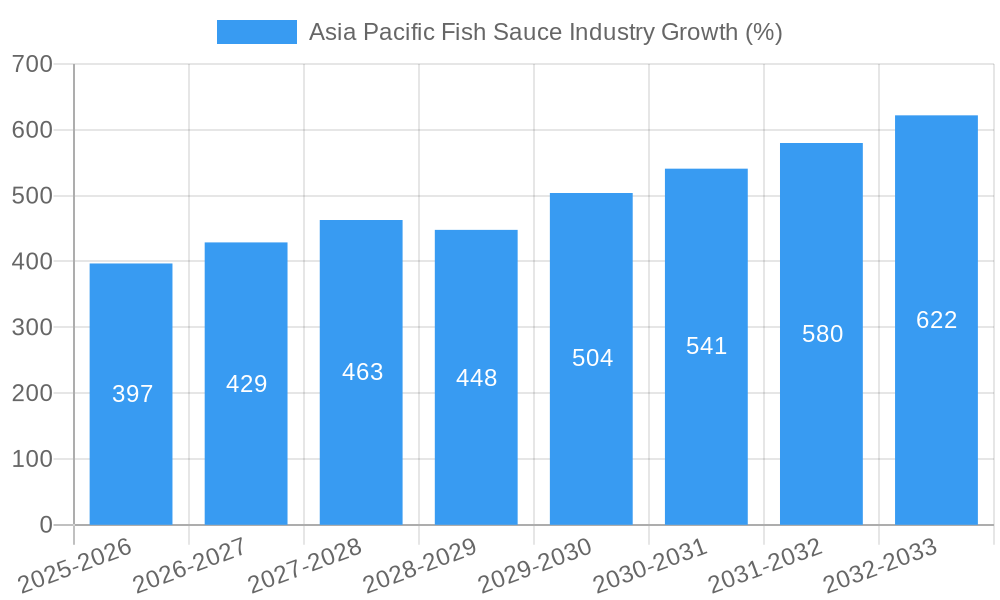
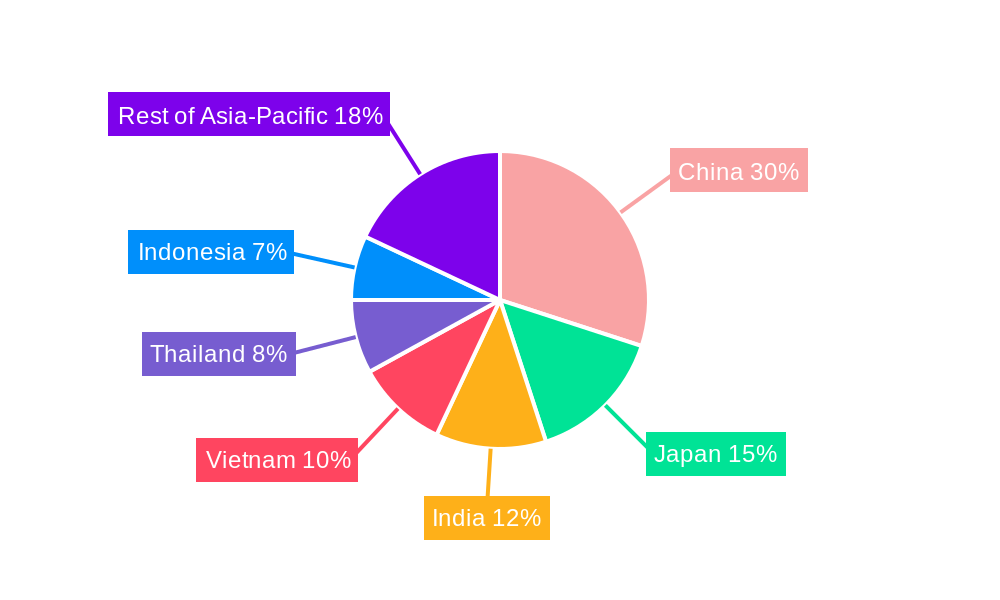
The Asia-Pacific fish sauce industry, valued at $6.23 billion in 2025, is projected to experience robust growth, driven by increasing consumer demand for authentic Asian flavors and the rising popularity of Southeast Asian cuisine globally. A compound annual growth rate (CAGR) of 6.28% is anticipated from 2025 to 2033, indicating a significant market expansion. This growth is fueled by several key factors. The increasing middle class in developing economies like India and Vietnam is leading to higher disposable incomes and a greater willingness to experiment with diverse culinary options, including fish sauce as a key ingredient. Furthermore, the burgeoning food service industry, particularly in urban areas, is contributing to increased consumption. The segment breakdown reveals a preference for premium fish sauce variants, driven by consumers' increasing awareness of quality and health benefits. China, Japan, and India are expected to remain the largest markets within the region, while countries like Vietnam and Thailand, known for their fish sauce production, will continue to leverage their expertise for export opportunities. However, challenges exist, including fluctuating raw material prices and increasing competition from substitute condiments. Strategic partnerships, product diversification (e.g., organic and sustainably sourced fish sauce), and expansion into new markets will be crucial for sustained growth.
The premium segment within the fish sauce market is anticipated to show the most significant growth due to increasing consumer preference for higher quality and potentially healthier options. This trend is observed across various end-user segments including food manufacturers, who are increasingly incorporating premium fish sauces in their products to appeal to discerning consumers. The traditional production methods are expected to continue to hold a significant market share, appealing to consumers who value authenticity and traditional flavors. However, the industrial production segment is projected to grow at a faster rate due to its ability to cater to the growing demand from larger food manufacturers. Geographical expansion into less penetrated markets within the Asia-Pacific region, along with targeted marketing campaigns emphasizing the versatility and health benefits of fish sauce, will be instrumental for sustained growth in the years to come.
This comprehensive report provides a detailed analysis of the Asia Pacific fish sauce industry, covering market size, growth drivers, competitive landscape, and future outlook. The study period spans from 2019 to 2033, with 2025 serving as the base and estimated year. The report offers actionable insights for industry stakeholders, including manufacturers, distributors, and investors. The report incorporates data from key players such as Pichai Fish Sauce Co Ltd, Rungroj Fish Sauce Co Ltd, Jin Guan Foodstuff (fujian) Co Ltd, Hung Thanh Co Ltd, Masan Group, Rayong Fish Sauce Industry co ltd, Nam Phuong Food (Barona Vietnam), Sin Guo Co (Pte) Ltd, Red Boat Fish Sauce, and Tang Sang Hah Co Ltd. This list is not exhaustive.
Asia Pacific Fish Sauce Industry Market Concentration & Innovation
This section analyzes the market concentration, innovation drivers, regulatory landscape, product substitutes, end-user trends, and mergers & acquisitions (M&A) activities within the Asia Pacific fish sauce industry. The market exhibits a moderately concentrated structure, with a few major players holding significant market share. However, smaller, regional players also contribute substantially to the overall market volume. Innovation in the industry focuses on product diversification, premiumization, and sustainable sourcing.
- Market Concentration: The top 5 players account for approximately xx% of the total market share in 2025, indicating a moderately concentrated market.
- Innovation Drivers: Growing consumer demand for premium and specialized fish sauces, coupled with technological advancements in processing and packaging, are driving innovation.
- Regulatory Frameworks: Varying food safety regulations across different Asia-Pacific countries influence the production and distribution of fish sauce. Compliance costs and varying standards pose challenges for manufacturers operating across multiple markets.
- Product Substitutes: Soy sauce, oyster sauce, and other condiments act as partial substitutes, particularly within specific culinary applications.
- End-User Trends: The increasing popularity of Asian cuisines globally boosts demand for fish sauce from both food manufacturers and the food service sector. Retail sales also play a significant role.
- M&A Activities: While specific M&A deal values aren't publicly available for all transactions, several smaller acquisitions have been observed in recent years, consolidating market share among existing players. The total M&A deal value in the historical period (2019-2024) is estimated at xx Million.
Asia Pacific Fish Sauce Industry Industry Trends & Insights
The Asia Pacific fish sauce market exhibits robust growth driven by factors such as the rising popularity of Asian cuisines, increasing disposable incomes, and changing consumer preferences. Technological advancements in production and packaging improve efficiency and product quality. The market has witnessed the emergence of premium fish sauce variants, capitalizing on increasing consumer demand for higher-quality products. Competitive dynamics are characterized by both intense competition among established players and the emergence of new entrants.
The market is projected to register a CAGR of xx% during the forecast period (2025-2033). Market penetration in key countries like Vietnam and Thailand is already high, while significant growth opportunities exist in other regions with expanding Asian food consumption.
Dominant Markets & Segments in Asia Pacific Fish Sauce Industry
Vietnam and Thailand remain dominant markets due to historical production and consumption patterns, strong local brands, and established supply chains. The premium segment is exhibiting faster growth compared to the basic segment driven by increasing consumer willingness to pay for higher quality and specific flavor profiles. The food service sector is a key driver of demand, with restaurants and food stalls significantly contributing to overall market consumption.
- Key Drivers in Vietnam and Thailand:
- Established production infrastructure and expertise.
- Strong local brands with high consumer loyalty.
- Favorable climatic conditions for fish sourcing.
- Government support for the fishing and food processing industries.
- Dominant Segment: Premium segment is growing at a faster rate due to increasing health consciousness, and preference for naturally brewed sauces.
- Dominant End-User: Food service sector is the largest segment due to the widespread use of fish sauce in numerous Asian cuisines.
Asia Pacific Fish Sauce Industry Product Developments
Recent product innovations include the introduction of new flavors, organic options, and convenient packaging formats. Technological advances focus on improving the consistency of the product, enhancing its flavor profile and shelf life, and streamlining production processes. Companies are emphasizing the health benefits of fish sauce, focusing on its umami properties and natural ingredients. Market fit is assessed through consumer preference surveys and market testing.
Report Scope & Segmentation Analysis
This report segments the Asia Pacific fish sauce market based on composition (basic, premium), end-user (food manufacturers, retail, food service), country (China, Japan, India, Vietnam, Thailand, Indonesia, Rest of Asia-Pacific), and product type (industrial, traditional). Each segment's growth projections, market size (in Million), and competitive dynamics are thoroughly analyzed. For example, the premium segment is expected to show significant growth in the forecast period, fueled by rising consumer disposable incomes and the increasing awareness of healthier options.
Key Drivers of Asia Pacific Fish Sauce Industry Growth
Key growth drivers include rising consumer preference for authentic Asian flavors, increasing urbanization and the growth of the food service sector, and the expansion of e-commerce platforms increasing accessibility. Furthermore, supportive government policies and advancements in fish sauce processing technologies contribute to market expansion.
Challenges in the Asia Pacific Fish Sauce Industry Sector
Challenges include fluctuating raw material prices, stringent food safety regulations, and increasing competition from substitute products. Supply chain disruptions, particularly those related to seafood sourcing, pose significant challenges to market stability and cost control. The industry faces pressure to adopt sustainable fishing practices and to improve traceability.
Emerging Opportunities in Asia Pacific Fish Sauce Industry
Emerging opportunities lie in expanding into new markets with growing demand for Asian cuisines, developing innovative product formats (e.g., ready-to-use sauces), and focusing on premium and specialized fish sauce varieties. The exploration of sustainable and ethically sourced ingredients presents significant growth potential.
Leading Players in the Asia Pacific Fish Sauce Industry Market
- Pichai Fish Sauce Co Ltd
- Rungroj Fish Sauce Co Ltd
- Jin Guan Foodstuff (fujian) Co Ltd
- Hung Thanh Co Ltd
- Masan Group
- Rayong Fish Sauce Industry co ltd
- Nam Phuong Food (Barona Vietnam)
- Sin Guo Co (Pte) Ltd
- Red Boat Fish Sauce
- Tang Sang Hah Co Ltd
Key Developments in Asia Pacific Fish Sauce Industry Industry
- September 2021: Red Boat Fish Sauce launched Kho Sauce, expanding its product portfolio.
- January 2023: Hoang Gia Fish Sauce introduced new product sizes and promotional strategies in the Australian market, increasing its market reach and brand awareness.
Strategic Outlook for Asia Pacific Fish Sauce Industry Market
The Asia Pacific fish sauce market holds significant future potential, driven by sustained growth in consumer demand, innovative product developments, and the expansion into new markets. The industry will benefit from embracing sustainable practices, ensuring the long-term health of both the environment and the market itself. Opportunities for consolidation and strategic partnerships also abound.
Asia Pacific Fish Sauce Industry Segmentation
-
1. Product Type
- 1.1. Industrial
- 1.2. Traditional
-
2. Composition
- 2.1. Basic
- 2.2. Premium
-
3. End-User
- 3.1. Food Manufacturers
- 3.2. Retail
- 3.3. Food Service
Asia Pacific Fish Sauce Industry Segmentation By Geography
-
1. Asia Pacific
- 1.1. China
- 1.2. Japan
- 1.3. South Korea
- 1.4. India
- 1.5. Australia
- 1.6. New Zealand
- 1.7. Indonesia
- 1.8. Malaysia
- 1.9. Singapore
- 1.10. Thailand
- 1.11. Vietnam
- 1.12. Philippines
Asia Pacific Fish Sauce Industry REPORT HIGHLIGHTS
| Aspects | Details |
|---|---|
| Study Period | 2019-2033 |
| Base Year | 2024 |
| Estimated Year | 2025 |
| Forecast Period | 2025-2033 |
| Historical Period | 2019-2024 |
| Growth Rate | CAGR of 6.28% from 2019-2033 |
| Segmentation |
|
Table of Contents
- 1. Introduction
- 1.1. Research Scope
- 1.2. Market Segmentation
- 1.3. Research Methodology
- 1.4. Definitions and Assumptions
- 2. Executive Summary
- 2.1. Introduction
- 3. Market Dynamics
- 3.1. Introduction
- 3.2. Market Drivers
- 3.2.1. Health Benefits Promoting Apple Cider Vinegar Demand; Unfiltered Apple Cider Vinegar Being Popular
- 3.3. Market Restrains
- 3.3.1. Rising Demand for Other Vinegar Types
- 3.4. Market Trends
- 3.4.1. Rise in the Demand for Fortified Fish Sauce
- 4. Market Factor Analysis
- 4.1. Porters Five Forces
- 4.2. Supply/Value Chain
- 4.3. PESTEL analysis
- 4.4. Market Entropy
- 4.5. Patent/Trademark Analysis
- 5. Asia Pacific Fish Sauce Industry Analysis, Insights and Forecast, 2019-2031
- 5.1. Market Analysis, Insights and Forecast - by Product Type
- 5.1.1. Industrial
- 5.1.2. Traditional
- 5.2. Market Analysis, Insights and Forecast - by Composition
- 5.2.1. Basic
- 5.2.2. Premium
- 5.3. Market Analysis, Insights and Forecast - by End-User
- 5.3.1. Food Manufacturers
- 5.3.2. Retail
- 5.3.3. Food Service
- 5.4. Market Analysis, Insights and Forecast - by Region
- 5.4.1. Asia Pacific
- 5.1. Market Analysis, Insights and Forecast - by Product Type
- 6. China Asia Pacific Fish Sauce Industry Analysis, Insights and Forecast, 2019-2031
- 7. Japan Asia Pacific Fish Sauce Industry Analysis, Insights and Forecast, 2019-2031
- 8. India Asia Pacific Fish Sauce Industry Analysis, Insights and Forecast, 2019-2031
- 9. South Korea Asia Pacific Fish Sauce Industry Analysis, Insights and Forecast, 2019-2031
- 10. Taiwan Asia Pacific Fish Sauce Industry Analysis, Insights and Forecast, 2019-2031
- 11. Australia Asia Pacific Fish Sauce Industry Analysis, Insights and Forecast, 2019-2031
- 12. Rest of Asia-Pacific Asia Pacific Fish Sauce Industry Analysis, Insights and Forecast, 2019-2031
- 13. Competitive Analysis
- 13.1. Market Share Analysis 2024
- 13.2. Company Profiles
- 13.2.1 Pichai Fish Sauce Co Ltd
- 13.2.1.1. Overview
- 13.2.1.2. Products
- 13.2.1.3. SWOT Analysis
- 13.2.1.4. Recent Developments
- 13.2.1.5. Financials (Based on Availability)
- 13.2.2 Rungroj Fish Sauce Co Ltd
- 13.2.2.1. Overview
- 13.2.2.2. Products
- 13.2.2.3. SWOT Analysis
- 13.2.2.4. Recent Developments
- 13.2.2.5. Financials (Based on Availability)
- 13.2.3 Jin Guan Foodstuff (fujian)Co Ltd
- 13.2.3.1. Overview
- 13.2.3.2. Products
- 13.2.3.3. SWOT Analysis
- 13.2.3.4. Recent Developments
- 13.2.3.5. Financials (Based on Availability)
- 13.2.4 Hung Thanh Co Ltd
- 13.2.4.1. Overview
- 13.2.4.2. Products
- 13.2.4.3. SWOT Analysis
- 13.2.4.4. Recent Developments
- 13.2.4.5. Financials (Based on Availability)
- 13.2.5 Masan Group
- 13.2.5.1. Overview
- 13.2.5.2. Products
- 13.2.5.3. SWOT Analysis
- 13.2.5.4. Recent Developments
- 13.2.5.5. Financials (Based on Availability)
- 13.2.6 Rayong Fish Sauce Industry co ltd
- 13.2.6.1. Overview
- 13.2.6.2. Products
- 13.2.6.3. SWOT Analysis
- 13.2.6.4. Recent Developments
- 13.2.6.5. Financials (Based on Availability)
- 13.2.7 Nam Phuong Food (Barona Vietnam)*List Not Exhaustive
- 13.2.7.1. Overview
- 13.2.7.2. Products
- 13.2.7.3. SWOT Analysis
- 13.2.7.4. Recent Developments
- 13.2.7.5. Financials (Based on Availability)
- 13.2.8 Sin Guo Co (Pte) Ltd
- 13.2.8.1. Overview
- 13.2.8.2. Products
- 13.2.8.3. SWOT Analysis
- 13.2.8.4. Recent Developments
- 13.2.8.5. Financials (Based on Availability)
- 13.2.9 Red Boat Fish Sauce
- 13.2.9.1. Overview
- 13.2.9.2. Products
- 13.2.9.3. SWOT Analysis
- 13.2.9.4. Recent Developments
- 13.2.9.5. Financials (Based on Availability)
- 13.2.10 Tang Sang Hah Co Ltd
- 13.2.10.1. Overview
- 13.2.10.2. Products
- 13.2.10.3. SWOT Analysis
- 13.2.10.4. Recent Developments
- 13.2.10.5. Financials (Based on Availability)
- 13.2.1 Pichai Fish Sauce Co Ltd
List of Figures
- Figure 1: Asia Pacific Fish Sauce Industry Revenue Breakdown (Million, %) by Product 2024 & 2032
- Figure 2: Asia Pacific Fish Sauce Industry Share (%) by Company 2024
List of Tables
- Table 1: Asia Pacific Fish Sauce Industry Revenue Million Forecast, by Region 2019 & 2032
- Table 2: Asia Pacific Fish Sauce Industry Revenue Million Forecast, by Product Type 2019 & 2032
- Table 3: Asia Pacific Fish Sauce Industry Revenue Million Forecast, by Composition 2019 & 2032
- Table 4: Asia Pacific Fish Sauce Industry Revenue Million Forecast, by End-User 2019 & 2032
- Table 5: Asia Pacific Fish Sauce Industry Revenue Million Forecast, by Region 2019 & 2032
- Table 6: Asia Pacific Fish Sauce Industry Revenue Million Forecast, by Country 2019 & 2032
- Table 7: China Asia Pacific Fish Sauce Industry Revenue (Million) Forecast, by Application 2019 & 2032
- Table 8: Japan Asia Pacific Fish Sauce Industry Revenue (Million) Forecast, by Application 2019 & 2032
- Table 9: India Asia Pacific Fish Sauce Industry Revenue (Million) Forecast, by Application 2019 & 2032
- Table 10: South Korea Asia Pacific Fish Sauce Industry Revenue (Million) Forecast, by Application 2019 & 2032
- Table 11: Taiwan Asia Pacific Fish Sauce Industry Revenue (Million) Forecast, by Application 2019 & 2032
- Table 12: Australia Asia Pacific Fish Sauce Industry Revenue (Million) Forecast, by Application 2019 & 2032
- Table 13: Rest of Asia-Pacific Asia Pacific Fish Sauce Industry Revenue (Million) Forecast, by Application 2019 & 2032
- Table 14: Asia Pacific Fish Sauce Industry Revenue Million Forecast, by Product Type 2019 & 2032
- Table 15: Asia Pacific Fish Sauce Industry Revenue Million Forecast, by Composition 2019 & 2032
- Table 16: Asia Pacific Fish Sauce Industry Revenue Million Forecast, by End-User 2019 & 2032
- Table 17: Asia Pacific Fish Sauce Industry Revenue Million Forecast, by Country 2019 & 2032
- Table 18: China Asia Pacific Fish Sauce Industry Revenue (Million) Forecast, by Application 2019 & 2032
- Table 19: Japan Asia Pacific Fish Sauce Industry Revenue (Million) Forecast, by Application 2019 & 2032
- Table 20: South Korea Asia Pacific Fish Sauce Industry Revenue (Million) Forecast, by Application 2019 & 2032
- Table 21: India Asia Pacific Fish Sauce Industry Revenue (Million) Forecast, by Application 2019 & 2032
- Table 22: Australia Asia Pacific Fish Sauce Industry Revenue (Million) Forecast, by Application 2019 & 2032
- Table 23: New Zealand Asia Pacific Fish Sauce Industry Revenue (Million) Forecast, by Application 2019 & 2032
- Table 24: Indonesia Asia Pacific Fish Sauce Industry Revenue (Million) Forecast, by Application 2019 & 2032
- Table 25: Malaysia Asia Pacific Fish Sauce Industry Revenue (Million) Forecast, by Application 2019 & 2032
- Table 26: Singapore Asia Pacific Fish Sauce Industry Revenue (Million) Forecast, by Application 2019 & 2032
- Table 27: Thailand Asia Pacific Fish Sauce Industry Revenue (Million) Forecast, by Application 2019 & 2032
- Table 28: Vietnam Asia Pacific Fish Sauce Industry Revenue (Million) Forecast, by Application 2019 & 2032
- Table 29: Philippines Asia Pacific Fish Sauce Industry Revenue (Million) Forecast, by Application 2019 & 2032
Frequently Asked Questions
1. What is the projected Compound Annual Growth Rate (CAGR) of the Asia Pacific Fish Sauce Industry?
The projected CAGR is approximately 6.28%.
2. Which companies are prominent players in the Asia Pacific Fish Sauce Industry?
Key companies in the market include Pichai Fish Sauce Co Ltd, Rungroj Fish Sauce Co Ltd, Jin Guan Foodstuff (fujian)Co Ltd, Hung Thanh Co Ltd, Masan Group, Rayong Fish Sauce Industry co ltd, Nam Phuong Food (Barona Vietnam)*List Not Exhaustive, Sin Guo Co (Pte) Ltd, Red Boat Fish Sauce, Tang Sang Hah Co Ltd.
3. What are the main segments of the Asia Pacific Fish Sauce Industry?
The market segments include Product Type, Composition, End-User.
4. Can you provide details about the market size?
The market size is estimated to be USD 6.23 Million as of 2022.
5. What are some drivers contributing to market growth?
Health Benefits Promoting Apple Cider Vinegar Demand; Unfiltered Apple Cider Vinegar Being Popular.
6. What are the notable trends driving market growth?
Rise in the Demand for Fortified Fish Sauce.
7. Are there any restraints impacting market growth?
Rising Demand for Other Vinegar Types.
8. Can you provide examples of recent developments in the market?
January 2023: Hoang Gia Fish Sauce launched new product sizes in the Australian market just in time for Lunar New Year 2023. In addition, the company has implemented several promotional strategies to increase sales and brand awareness, such as buy two get one free and combo offers. By introducing different product sizes, Hoang Gia fish sauce can cater to a broader range of customers who may have varying needs or preferences.
9. What pricing options are available for accessing the report?
Pricing options include single-user, multi-user, and enterprise licenses priced at USD 4750, USD 5250, and USD 8750 respectively.
10. Is the market size provided in terms of value or volume?
The market size is provided in terms of value, measured in Million.
11. Are there any specific market keywords associated with the report?
Yes, the market keyword associated with the report is "Asia Pacific Fish Sauce Industry," which aids in identifying and referencing the specific market segment covered.
12. How do I determine which pricing option suits my needs best?
The pricing options vary based on user requirements and access needs. Individual users may opt for single-user licenses, while businesses requiring broader access may choose multi-user or enterprise licenses for cost-effective access to the report.
13. Are there any additional resources or data provided in the Asia Pacific Fish Sauce Industry report?
While the report offers comprehensive insights, it's advisable to review the specific contents or supplementary materials provided to ascertain if additional resources or data are available.
14. How can I stay updated on further developments or reports in the Asia Pacific Fish Sauce Industry?
To stay informed about further developments, trends, and reports in the Asia Pacific Fish Sauce Industry, consider subscribing to industry newsletters, following relevant companies and organizations, or regularly checking reputable industry news sources and publications.
Methodology
Step 1 - Identification of Relevant Samples Size from Population Database


Step 2 - Approaches for Defining Global Market Size (Value, Volume* & Price*)

Note*: In applicable scenarios
Step 3 - Data Sources
Primary Research
- Web Analytics
- Survey Reports
- Research Institute
- Latest Research Reports
- Opinion Leaders
Secondary Research
- Annual Reports
- White Paper
- Latest Press Release
- Industry Association
- Paid Database
- Investor Presentations

Step 4 - Data Triangulation
Involves using different sources of information in order to increase the validity of a study
These sources are likely to be stakeholders in a program - participants, other researchers, program staff, other community members, and so on.
Then we put all data in single framework & apply various statistical tools to find out the dynamic on the market.
During the analysis stage, feedback from the stakeholder groups would be compared to determine areas of agreement as well as areas of divergence


