
Key Insights
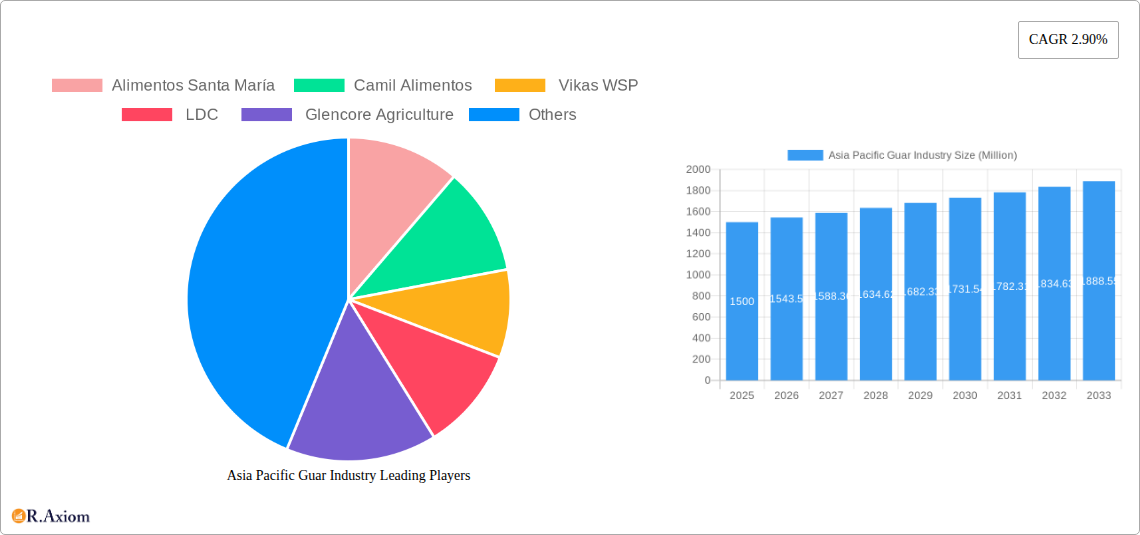
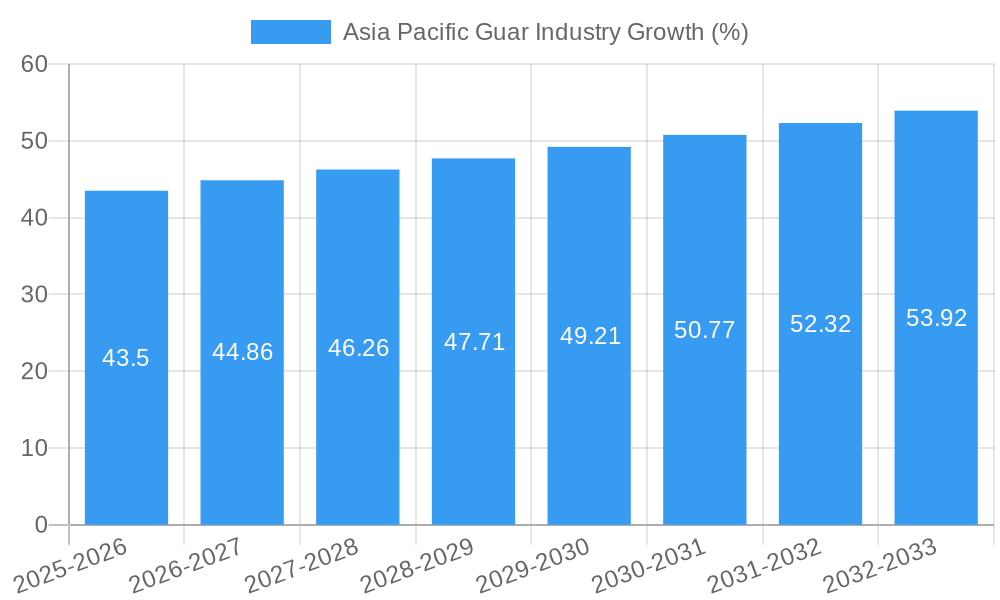
The Asia-Pacific guar gum industry, encompassing major players like Alimentos Santa María, Camil Alimentos, and Vikas WSP, is experiencing steady growth, projected at a 2.90% CAGR from 2025 to 2033. This growth is driven by increasing demand from the food and beverage sector, particularly in the production of ice cream, bakery goods, and dairy products, where guar gum acts as a stabilizer and thickener. Furthermore, the expanding oil and gas industry fuels demand for guar gum in fracturing fluids for enhanced oil recovery. The region's diverse economies, with significant contributions from China, India, Japan, and Australia, present both opportunities and challenges. India, a major producer, experiences fluctuating production levels due to varying monsoon seasons impacting guar bean yields, while China and Japan represent substantial consumption markets, significantly influencing price trends. Competition among producers is intense, with larger companies benefiting from economies of scale and established distribution networks. The industry also faces challenges from alternative thickening agents and potential price volatility depending on agricultural yields. Despite these fluctuations, the overall outlook for the Asia-Pacific guar gum market remains positive due to the continuous expansion in targeted industries and growing global demand.
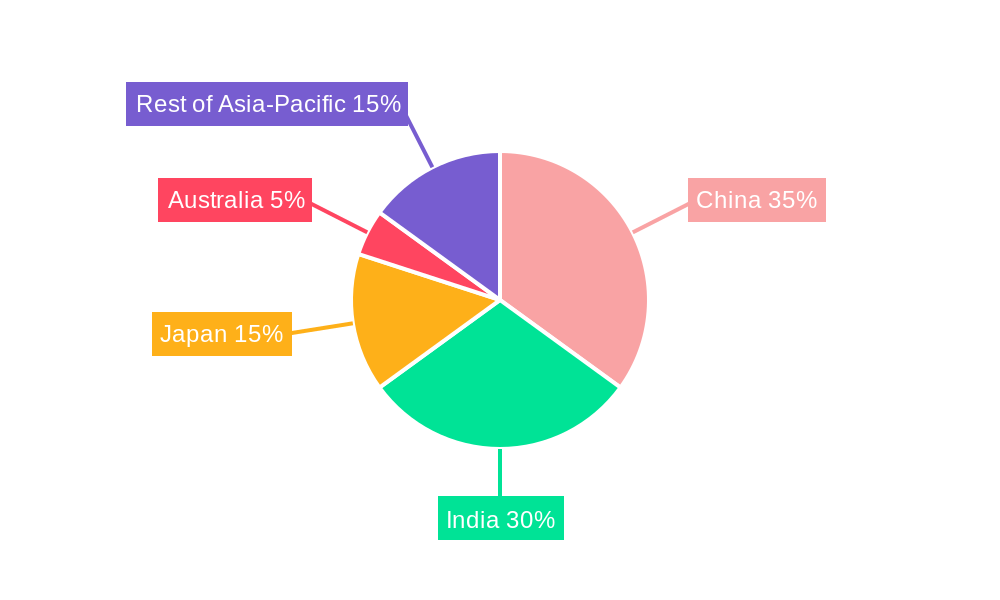
The regional breakdown reveals that China and India are dominant forces, shaping production and consumption patterns. China's significant consumption volume influences price dynamics, and any disruption in its demand can create ripple effects across the market. Japan, with its sophisticated food processing industry, contributes heavily to market growth. Australia, while a smaller player in terms of overall volume, adds to the regional diversity. Successful companies in this industry are those that can manage supply chain complexities, adapt to fluctuating raw material prices, and cater to diverse customer needs across the different sectors. Future growth hinges on strategic partnerships, technological advancements in guar gum processing, and diversification of product applications to cater to emerging needs within the food and beverage, pharmaceutical, and industrial sectors.
This in-depth report provides a comprehensive analysis of the Asia Pacific guar industry, covering the period from 2019 to 2033. The study incorporates detailed market sizing, segmentation, and forecasting, along with a thorough examination of key players, industry trends, and future opportunities. With a base year of 2025 and a forecast period spanning 2025-2033, this report is an essential resource for industry stakeholders seeking actionable insights and strategic guidance. The historical period covered is 2019-2024. Key regions analyzed include India, China, Japan, and Australia. Major companies analyzed include Alimentos Santa María, Camil Alimentos, Vikas WSP, LDC, Glencore Agriculture, AGD, GuarCorp, Arcor, Flo Chemical, and Molinos. The report uses Million as the unit for all values.
Asia Pacific Guar Industry Market Concentration & Innovation
This section analyzes the competitive landscape of the Asia Pacific guar industry, focusing on market concentration, innovation drivers, regulatory frameworks, product substitutes, end-user trends, and mergers and acquisitions (M&A) activities. The report assesses market share distribution among key players and evaluates the impact of M&A activities on market dynamics. While precise market share figures for each company require in-depth proprietary data, this report provides an estimate of the market's concentration level. For instance, the top five players may hold approximately xx% of the market share in 2025. Innovation is driven by the demand for higher-quality guar gum with specific properties and applications, leading to ongoing research and development in extraction, processing, and modification techniques.
- Market Concentration: The Asia Pacific guar market exhibits a moderately concentrated structure, with a few dominant players and several smaller regional participants.
- Innovation Drivers: Demand for specialized guar gum derivatives, sustainability concerns, and technological advancements in processing are key drivers of innovation.
- Regulatory Frameworks: Government regulations concerning food safety and labeling standards influence product development and market access.
- Product Substitutes: The industry faces competition from alternative thickening and stabilizing agents, which necessitates ongoing innovation to maintain market share.
- End-User Trends: Growing demand from food, pharmaceutical, and industrial sectors drives market growth and shapes product development strategies.
- M&A Activities: Consolidation through mergers and acquisitions is expected to continue, resulting in a shift in market share and competition. Estimated M&A deal value in the period 2019-2024 is xx Million.
Asia Pacific Guar Industry Industry Trends & Insights
This section explores the key trends and insights shaping the Asia Pacific guar industry. The report analyzes market growth drivers, including increasing demand from various end-use industries (e.g., food & beverage, oil & gas, pharmaceuticals), alongside technological disruptions such as advancements in guar gum extraction and processing techniques. Consumer preferences toward natural and sustainable products, as well as competitive dynamics among key players, are also examined. The Compound Annual Growth Rate (CAGR) during the forecast period (2025-2033) is projected to be xx%. Market penetration is estimated at xx% in 2025, expected to increase to xx% by 2033. The report examines the impact of these trends on pricing, demand, and market share, offering insights into future market development.
Dominant Markets & Segments in Asia Pacific Guar Industry
This section identifies the leading regions, countries, and segments within the Asia Pacific guar industry. A detailed analysis is provided for India, China, Japan, and Australia, covering production, consumption, import/export volumes and values, and price trends. Each country section will offer the following data:
India:
- Production Analysis: Production volume in 2025 estimated at xx Million tons, with a projected increase to xx Million tons by 2033.
- Consumption Analysis: Consumption volume in 2025 estimated at xx Million tons, with a projected increase to xx Million tons by 2033.
- Market Value: Market value in 2025 estimated at xx Million USD, with a projected increase to xx Million USD by 2033.
- Import Analysis: Import volume in 2025 estimated at xx Million tons, with a projected increase to xx Million tons by 2033. Import value in 2025 estimated at xx Million USD.
- Export Analysis: Export volume in 2025 estimated at xx Million tons, with a projected increase to xx Million tons by 2033. Export value in 2025 estimated at xx Million USD.
- Price Trend Analysis: Average price in 2025 estimated at xx USD/ton, with a projected increase to xx USD/ton by 2033.
China: (Similar data points as India)
Japan: (Similar data points as India)
Australia: (Similar data points as India)
India dominates the Asia-Pacific guar market due to its extensive cultivation and production. Factors contributing to its dominance include favorable climatic conditions, established infrastructure, and government support. China is a significant consumer and importer. Japan and Australia represent smaller markets but contribute to the overall regional dynamics.
Asia Pacific Guar Industry Product Developments
Recent innovations in the guar industry focus on developing specialized guar gum derivatives with tailored properties for specific applications. This includes high-viscosity guar gum for enhanced thickening in the food industry and modified guar gums for improved functionality in other sectors. These developments are driven by technological advancements in extraction and processing methods, leading to more efficient and cost-effective production, and allowing for a wider range of applications and improved market penetration across various sectors.
Report Scope & Segmentation Analysis
This report segments the Asia Pacific guar market by region (India, China, Japan, Australia, and others), application (food, oil & gas, pharmaceuticals, etc.), and guar gum type (refined, semi-refined, etc.). Growth projections, market sizes, and competitive dynamics are analyzed for each segment. The report provides detailed market size and growth projections for each segment, highlighting areas of high potential for investment and expansion. The competitive dynamics, including the presence of key players, are also analyzed for each segment.
Key Drivers of Asia Pacific Guar Industry Growth
The Asia Pacific guar industry's growth is primarily driven by increasing demand from the food and beverage industry, particularly in emerging economies. Advances in extraction and processing technologies are leading to higher-quality products, while regulatory support and growing environmental consciousness are also bolstering market expansion.
Challenges in the Asia Pacific Guar Industry Sector
Key challenges include fluctuating raw material prices, competition from substitutes, and concerns related to supply chain disruptions. The industry also faces challenges related to sustainability and environmental impact, which necessitate the adoption of environmentally friendly practices. Additionally, regulatory compliance and food safety regulations pose challenges for market entry and expansion.
Emerging Opportunities in Asia Pacific Guar Industry
Emerging opportunities lie in expanding into new applications, such as in cosmetics and personal care products. Demand for specialized guar gum derivatives with enhanced properties is expected to increase, while advancements in processing technologies will offer enhanced efficiency and sustainability, leading to overall growth of the market.
Leading Players in the Asia Pacific Guar Industry Market
- Alimentos Santa María
- Camil Alimentos
- Vikas WSP
- LDC
- Glencore Agriculture
- AGD
- GuarCorp
- Arcor
- Flo Chemical
- Molinos
Key Developments in Asia Pacific Guar Industry Industry
- 2022 Q4: Launch of a new, high-viscosity guar gum by GuarCorp.
- 2023 Q1: Acquisition of a smaller guar gum producer by Alimentos Santa Maria.
- 2023 Q3: Significant investment in a new guar gum processing plant in India by LDC.
Strategic Outlook for Asia Pacific Guar Industry Market
The Asia Pacific guar industry is poised for continued growth, fueled by increasing demand, technological advancements, and strategic investments. The focus on sustainability and development of specialized guar gum derivatives will present significant growth opportunities for leading players. Expansion into new application areas and markets will further propel market expansion during the forecast period.
Asia Pacific Guar Industry Segmentation
-
1. India
- 1.1. Production Analysis
- 1.2. Consumption Analysis and Market Value
- 1.3. Import Analysis by Volume and Value
- 1.4. Export Analysis by Volume and Value
- 1.5. Price Trend Analysis
-
2. China
- 2.1. Production Analysis
- 2.2. Consumption Analysis and Market Value
- 2.3. Import Analysis by Volume and Value
- 2.4. Export Analysis by Volume and Value
- 2.5. Price Trend Analysis
-
3. Japan
- 3.1. Production Analysis
- 3.2. Consumption Analysis and Market Value
- 3.3. Import Analysis by Volume and Value
- 3.4. Export Analysis by Volume and Value
- 3.5. Price Trend Analysis
-
4. Australia
- 4.1. Production Analysis
- 4.2. Consumption Analysis and Market Value
- 4.3. Import Analysis by Volume and Value
- 4.4. Export Analysis by Volume and Value
- 4.5. Price Trend Analysis
-
5. India
- 5.1. Production Analysis
- 5.2. Consumption Analysis and Market Value
- 5.3. Import Analysis by Volume and Value
- 5.4. Export Analysis by Volume and Value
- 5.5. Price Trend Analysis
-
6. China
- 6.1. Production Analysis
- 6.2. Consumption Analysis and Market Value
- 6.3. Import Analysis by Volume and Value
- 6.4. Export Analysis by Volume and Value
- 6.5. Price Trend Analysis
-
7. Japan
- 7.1. Production Analysis
- 7.2. Consumption Analysis and Market Value
- 7.3. Import Analysis by Volume and Value
- 7.4. Export Analysis by Volume and Value
- 7.5. Price Trend Analysis
-
8. Australia
- 8.1. Production Analysis
- 8.2. Consumption Analysis and Market Value
- 8.3. Import Analysis by Volume and Value
- 8.4. Export Analysis by Volume and Value
- 8.5. Price Trend Analysis
Asia Pacific Guar Industry Segmentation By Geography
-
1. Asia Pacific
- 1.1. China
- 1.2. Japan
- 1.3. South Korea
- 1.4. India
- 1.5. Australia
- 1.6. New Zealand
- 1.7. Indonesia
- 1.8. Malaysia
- 1.9. Singapore
- 1.10. Thailand
- 1.11. Vietnam
- 1.12. Philippines
Asia Pacific Guar Industry REPORT HIGHLIGHTS
| Aspects | Details |
|---|---|
| Study Period | 2019-2033 |
| Base Year | 2024 |
| Estimated Year | 2025 |
| Forecast Period | 2025-2033 |
| Historical Period | 2019-2024 |
| Growth Rate | CAGR of 2.90% from 2019-2033 |
| Segmentation |
|
Table of Contents
- 1. Introduction
- 1.1. Research Scope
- 1.2. Market Segmentation
- 1.3. Research Methodology
- 1.4. Definitions and Assumptions
- 2. Executive Summary
- 2.1. Introduction
- 3. Market Dynamics
- 3.1. Introduction
- 3.2. Market Drivers
- 3.2.1. Favorable Climatic Conditions; Blooming Export Opportunities
- 3.3. Market Restrains
- 3.3.1. High Adoption Cost of Modern Technology; Increasing Insect Infestations
- 3.4. Market Trends
- 3.4.1. Application in Various Industry is Driving Production
- 4. Market Factor Analysis
- 4.1. Porters Five Forces
- 4.2. Supply/Value Chain
- 4.3. PESTEL analysis
- 4.4. Market Entropy
- 4.5. Patent/Trademark Analysis
- 5. Asia Pacific Guar Industry Analysis, Insights and Forecast, 2019-2031
- 5.1. Market Analysis, Insights and Forecast - by India
- 5.1.1. Production Analysis
- 5.1.2. Consumption Analysis and Market Value
- 5.1.3. Import Analysis by Volume and Value
- 5.1.4. Export Analysis by Volume and Value
- 5.1.5. Price Trend Analysis
- 5.2. Market Analysis, Insights and Forecast - by China
- 5.2.1. Production Analysis
- 5.2.2. Consumption Analysis and Market Value
- 5.2.3. Import Analysis by Volume and Value
- 5.2.4. Export Analysis by Volume and Value
- 5.2.5. Price Trend Analysis
- 5.3. Market Analysis, Insights and Forecast - by Japan
- 5.3.1. Production Analysis
- 5.3.2. Consumption Analysis and Market Value
- 5.3.3. Import Analysis by Volume and Value
- 5.3.4. Export Analysis by Volume and Value
- 5.3.5. Price Trend Analysis
- 5.4. Market Analysis, Insights and Forecast - by Australia
- 5.4.1. Production Analysis
- 5.4.2. Consumption Analysis and Market Value
- 5.4.3. Import Analysis by Volume and Value
- 5.4.4. Export Analysis by Volume and Value
- 5.4.5. Price Trend Analysis
- 5.5. Market Analysis, Insights and Forecast - by India
- 5.5.1. Production Analysis
- 5.5.2. Consumption Analysis and Market Value
- 5.5.3. Import Analysis by Volume and Value
- 5.5.4. Export Analysis by Volume and Value
- 5.5.5. Price Trend Analysis
- 5.6. Market Analysis, Insights and Forecast - by China
- 5.6.1. Production Analysis
- 5.6.2. Consumption Analysis and Market Value
- 5.6.3. Import Analysis by Volume and Value
- 5.6.4. Export Analysis by Volume and Value
- 5.6.5. Price Trend Analysis
- 5.7. Market Analysis, Insights and Forecast - by Japan
- 5.7.1. Production Analysis
- 5.7.2. Consumption Analysis and Market Value
- 5.7.3. Import Analysis by Volume and Value
- 5.7.4. Export Analysis by Volume and Value
- 5.7.5. Price Trend Analysis
- 5.8. Market Analysis, Insights and Forecast - by Australia
- 5.8.1. Production Analysis
- 5.8.2. Consumption Analysis and Market Value
- 5.8.3. Import Analysis by Volume and Value
- 5.8.4. Export Analysis by Volume and Value
- 5.8.5. Price Trend Analysis
- 5.9. Market Analysis, Insights and Forecast - by Region
- 5.9.1. Asia Pacific
- 5.1. Market Analysis, Insights and Forecast - by India
- 6. China Asia Pacific Guar Industry Analysis, Insights and Forecast, 2019-2031
- 7. Japan Asia Pacific Guar Industry Analysis, Insights and Forecast, 2019-2031
- 8. India Asia Pacific Guar Industry Analysis, Insights and Forecast, 2019-2031
- 9. South Korea Asia Pacific Guar Industry Analysis, Insights and Forecast, 2019-2031
- 10. Taiwan Asia Pacific Guar Industry Analysis, Insights and Forecast, 2019-2031
- 11. Australia Asia Pacific Guar Industry Analysis, Insights and Forecast, 2019-2031
- 12. Rest of Asia-Pacific Asia Pacific Guar Industry Analysis, Insights and Forecast, 2019-2031
- 13. Competitive Analysis
- 13.1. Market Share Analysis 2024
- 13.2. Company Profiles
- 13.2.1 Alimentos Santa María
- 13.2.1.1. Overview
- 13.2.1.2. Products
- 13.2.1.3. SWOT Analysis
- 13.2.1.4. Recent Developments
- 13.2.1.5. Financials (Based on Availability)
- 13.2.2 Camil Alimentos
- 13.2.2.1. Overview
- 13.2.2.2. Products
- 13.2.2.3. SWOT Analysis
- 13.2.2.4. Recent Developments
- 13.2.2.5. Financials (Based on Availability)
- 13.2.3 Vikas WSP
- 13.2.3.1. Overview
- 13.2.3.2. Products
- 13.2.3.3. SWOT Analysis
- 13.2.3.4. Recent Developments
- 13.2.3.5. Financials (Based on Availability)
- 13.2.4 LDC
- 13.2.4.1. Overview
- 13.2.4.2. Products
- 13.2.4.3. SWOT Analysis
- 13.2.4.4. Recent Developments
- 13.2.4.5. Financials (Based on Availability)
- 13.2.5 Glencore Agriculture
- 13.2.5.1. Overview
- 13.2.5.2. Products
- 13.2.5.3. SWOT Analysis
- 13.2.5.4. Recent Developments
- 13.2.5.5. Financials (Based on Availability)
- 13.2.6 AGD
- 13.2.6.1. Overview
- 13.2.6.2. Products
- 13.2.6.3. SWOT Analysis
- 13.2.6.4. Recent Developments
- 13.2.6.5. Financials (Based on Availability)
- 13.2.7 GuarCorp
- 13.2.7.1. Overview
- 13.2.7.2. Products
- 13.2.7.3. SWOT Analysis
- 13.2.7.4. Recent Developments
- 13.2.7.5. Financials (Based on Availability)
- 13.2.8 Arcor
- 13.2.8.1. Overview
- 13.2.8.2. Products
- 13.2.8.3. SWOT Analysis
- 13.2.8.4. Recent Developments
- 13.2.8.5. Financials (Based on Availability)
- 13.2.9 Flo Chemical
- 13.2.9.1. Overview
- 13.2.9.2. Products
- 13.2.9.3. SWOT Analysis
- 13.2.9.4. Recent Developments
- 13.2.9.5. Financials (Based on Availability)
- 13.2.10 Molinos
- 13.2.10.1. Overview
- 13.2.10.2. Products
- 13.2.10.3. SWOT Analysis
- 13.2.10.4. Recent Developments
- 13.2.10.5. Financials (Based on Availability)
- 13.2.1 Alimentos Santa María
List of Figures
- Figure 1: Asia Pacific Guar Industry Revenue Breakdown (Million, %) by Product 2024 & 2032
- Figure 2: Asia Pacific Guar Industry Share (%) by Company 2024
List of Tables
- Table 1: Asia Pacific Guar Industry Revenue Million Forecast, by Region 2019 & 2032
- Table 2: Asia Pacific Guar Industry Volume Metric Tons Forecast, by Region 2019 & 2032
- Table 3: Asia Pacific Guar Industry Revenue Million Forecast, by India 2019 & 2032
- Table 4: Asia Pacific Guar Industry Volume Metric Tons Forecast, by India 2019 & 2032
- Table 5: Asia Pacific Guar Industry Revenue Million Forecast, by China 2019 & 2032
- Table 6: Asia Pacific Guar Industry Volume Metric Tons Forecast, by China 2019 & 2032
- Table 7: Asia Pacific Guar Industry Revenue Million Forecast, by Japan 2019 & 2032
- Table 8: Asia Pacific Guar Industry Volume Metric Tons Forecast, by Japan 2019 & 2032
- Table 9: Asia Pacific Guar Industry Revenue Million Forecast, by Australia 2019 & 2032
- Table 10: Asia Pacific Guar Industry Volume Metric Tons Forecast, by Australia 2019 & 2032
- Table 11: Asia Pacific Guar Industry Revenue Million Forecast, by India 2019 & 2032
- Table 12: Asia Pacific Guar Industry Volume Metric Tons Forecast, by India 2019 & 2032
- Table 13: Asia Pacific Guar Industry Revenue Million Forecast, by China 2019 & 2032
- Table 14: Asia Pacific Guar Industry Volume Metric Tons Forecast, by China 2019 & 2032
- Table 15: Asia Pacific Guar Industry Revenue Million Forecast, by Japan 2019 & 2032
- Table 16: Asia Pacific Guar Industry Volume Metric Tons Forecast, by Japan 2019 & 2032
- Table 17: Asia Pacific Guar Industry Revenue Million Forecast, by Australia 2019 & 2032
- Table 18: Asia Pacific Guar Industry Volume Metric Tons Forecast, by Australia 2019 & 2032
- Table 19: Asia Pacific Guar Industry Revenue Million Forecast, by Region 2019 & 2032
- Table 20: Asia Pacific Guar Industry Volume Metric Tons Forecast, by Region 2019 & 2032
- Table 21: Asia Pacific Guar Industry Revenue Million Forecast, by Country 2019 & 2032
- Table 22: Asia Pacific Guar Industry Volume Metric Tons Forecast, by Country 2019 & 2032
- Table 23: China Asia Pacific Guar Industry Revenue (Million) Forecast, by Application 2019 & 2032
- Table 24: China Asia Pacific Guar Industry Volume (Metric Tons) Forecast, by Application 2019 & 2032
- Table 25: Japan Asia Pacific Guar Industry Revenue (Million) Forecast, by Application 2019 & 2032
- Table 26: Japan Asia Pacific Guar Industry Volume (Metric Tons) Forecast, by Application 2019 & 2032
- Table 27: India Asia Pacific Guar Industry Revenue (Million) Forecast, by Application 2019 & 2032
- Table 28: India Asia Pacific Guar Industry Volume (Metric Tons) Forecast, by Application 2019 & 2032
- Table 29: South Korea Asia Pacific Guar Industry Revenue (Million) Forecast, by Application 2019 & 2032
- Table 30: South Korea Asia Pacific Guar Industry Volume (Metric Tons) Forecast, by Application 2019 & 2032
- Table 31: Taiwan Asia Pacific Guar Industry Revenue (Million) Forecast, by Application 2019 & 2032
- Table 32: Taiwan Asia Pacific Guar Industry Volume (Metric Tons) Forecast, by Application 2019 & 2032
- Table 33: Australia Asia Pacific Guar Industry Revenue (Million) Forecast, by Application 2019 & 2032
- Table 34: Australia Asia Pacific Guar Industry Volume (Metric Tons) Forecast, by Application 2019 & 2032
- Table 35: Rest of Asia-Pacific Asia Pacific Guar Industry Revenue (Million) Forecast, by Application 2019 & 2032
- Table 36: Rest of Asia-Pacific Asia Pacific Guar Industry Volume (Metric Tons) Forecast, by Application 2019 & 2032
- Table 37: Asia Pacific Guar Industry Revenue Million Forecast, by India 2019 & 2032
- Table 38: Asia Pacific Guar Industry Volume Metric Tons Forecast, by India 2019 & 2032
- Table 39: Asia Pacific Guar Industry Revenue Million Forecast, by China 2019 & 2032
- Table 40: Asia Pacific Guar Industry Volume Metric Tons Forecast, by China 2019 & 2032
- Table 41: Asia Pacific Guar Industry Revenue Million Forecast, by Japan 2019 & 2032
- Table 42: Asia Pacific Guar Industry Volume Metric Tons Forecast, by Japan 2019 & 2032
- Table 43: Asia Pacific Guar Industry Revenue Million Forecast, by Australia 2019 & 2032
- Table 44: Asia Pacific Guar Industry Volume Metric Tons Forecast, by Australia 2019 & 2032
- Table 45: Asia Pacific Guar Industry Revenue Million Forecast, by India 2019 & 2032
- Table 46: Asia Pacific Guar Industry Volume Metric Tons Forecast, by India 2019 & 2032
- Table 47: Asia Pacific Guar Industry Revenue Million Forecast, by China 2019 & 2032
- Table 48: Asia Pacific Guar Industry Volume Metric Tons Forecast, by China 2019 & 2032
- Table 49: Asia Pacific Guar Industry Revenue Million Forecast, by Japan 2019 & 2032
- Table 50: Asia Pacific Guar Industry Volume Metric Tons Forecast, by Japan 2019 & 2032
- Table 51: Asia Pacific Guar Industry Revenue Million Forecast, by Australia 2019 & 2032
- Table 52: Asia Pacific Guar Industry Volume Metric Tons Forecast, by Australia 2019 & 2032
- Table 53: Asia Pacific Guar Industry Revenue Million Forecast, by Country 2019 & 2032
- Table 54: Asia Pacific Guar Industry Volume Metric Tons Forecast, by Country 2019 & 2032
- Table 55: China Asia Pacific Guar Industry Revenue (Million) Forecast, by Application 2019 & 2032
- Table 56: China Asia Pacific Guar Industry Volume (Metric Tons) Forecast, by Application 2019 & 2032
- Table 57: Japan Asia Pacific Guar Industry Revenue (Million) Forecast, by Application 2019 & 2032
- Table 58: Japan Asia Pacific Guar Industry Volume (Metric Tons) Forecast, by Application 2019 & 2032
- Table 59: South Korea Asia Pacific Guar Industry Revenue (Million) Forecast, by Application 2019 & 2032
- Table 60: South Korea Asia Pacific Guar Industry Volume (Metric Tons) Forecast, by Application 2019 & 2032
- Table 61: India Asia Pacific Guar Industry Revenue (Million) Forecast, by Application 2019 & 2032
- Table 62: India Asia Pacific Guar Industry Volume (Metric Tons) Forecast, by Application 2019 & 2032
- Table 63: Australia Asia Pacific Guar Industry Revenue (Million) Forecast, by Application 2019 & 2032
- Table 64: Australia Asia Pacific Guar Industry Volume (Metric Tons) Forecast, by Application 2019 & 2032
- Table 65: New Zealand Asia Pacific Guar Industry Revenue (Million) Forecast, by Application 2019 & 2032
- Table 66: New Zealand Asia Pacific Guar Industry Volume (Metric Tons) Forecast, by Application 2019 & 2032
- Table 67: Indonesia Asia Pacific Guar Industry Revenue (Million) Forecast, by Application 2019 & 2032
- Table 68: Indonesia Asia Pacific Guar Industry Volume (Metric Tons) Forecast, by Application 2019 & 2032
- Table 69: Malaysia Asia Pacific Guar Industry Revenue (Million) Forecast, by Application 2019 & 2032
- Table 70: Malaysia Asia Pacific Guar Industry Volume (Metric Tons) Forecast, by Application 2019 & 2032
- Table 71: Singapore Asia Pacific Guar Industry Revenue (Million) Forecast, by Application 2019 & 2032
- Table 72: Singapore Asia Pacific Guar Industry Volume (Metric Tons) Forecast, by Application 2019 & 2032
- Table 73: Thailand Asia Pacific Guar Industry Revenue (Million) Forecast, by Application 2019 & 2032
- Table 74: Thailand Asia Pacific Guar Industry Volume (Metric Tons) Forecast, by Application 2019 & 2032
- Table 75: Vietnam Asia Pacific Guar Industry Revenue (Million) Forecast, by Application 2019 & 2032
- Table 76: Vietnam Asia Pacific Guar Industry Volume (Metric Tons) Forecast, by Application 2019 & 2032
- Table 77: Philippines Asia Pacific Guar Industry Revenue (Million) Forecast, by Application 2019 & 2032
- Table 78: Philippines Asia Pacific Guar Industry Volume (Metric Tons) Forecast, by Application 2019 & 2032
Frequently Asked Questions
1. What is the projected Compound Annual Growth Rate (CAGR) of the Asia Pacific Guar Industry?
The projected CAGR is approximately 2.90%.
2. Which companies are prominent players in the Asia Pacific Guar Industry?
Key companies in the market include Alimentos Santa María , Camil Alimentos , Vikas WSP , LDC , Glencore Agriculture, AGD, GuarCorp , Arcor , Flo Chemical , Molinos .
3. What are the main segments of the Asia Pacific Guar Industry?
The market segments include India, China, Japan, Australia, India, China, Japan, Australia.
4. Can you provide details about the market size?
The market size is estimated to be USD XXX Million as of 2022.
5. What are some drivers contributing to market growth?
Favorable Climatic Conditions; Blooming Export Opportunities.
6. What are the notable trends driving market growth?
Application in Various Industry is Driving Production.
7. Are there any restraints impacting market growth?
High Adoption Cost of Modern Technology; Increasing Insect Infestations.
8. Can you provide examples of recent developments in the market?
N/A
9. What pricing options are available for accessing the report?
Pricing options include single-user, multi-user, and enterprise licenses priced at USD 3800, USD 4500, and USD 5800 respectively.
10. Is the market size provided in terms of value or volume?
The market size is provided in terms of value, measured in Million and volume, measured in Metric Tons.
11. Are there any specific market keywords associated with the report?
Yes, the market keyword associated with the report is "Asia Pacific Guar Industry," which aids in identifying and referencing the specific market segment covered.
12. How do I determine which pricing option suits my needs best?
The pricing options vary based on user requirements and access needs. Individual users may opt for single-user licenses, while businesses requiring broader access may choose multi-user or enterprise licenses for cost-effective access to the report.
13. Are there any additional resources or data provided in the Asia Pacific Guar Industry report?
While the report offers comprehensive insights, it's advisable to review the specific contents or supplementary materials provided to ascertain if additional resources or data are available.
14. How can I stay updated on further developments or reports in the Asia Pacific Guar Industry?
To stay informed about further developments, trends, and reports in the Asia Pacific Guar Industry, consider subscribing to industry newsletters, following relevant companies and organizations, or regularly checking reputable industry news sources and publications.
Methodology
Step 1 - Identification of Relevant Samples Size from Population Database


Step 2 - Approaches for Defining Global Market Size (Value, Volume* & Price*)

Note*: In applicable scenarios
Step 3 - Data Sources
Primary Research
- Web Analytics
- Survey Reports
- Research Institute
- Latest Research Reports
- Opinion Leaders
Secondary Research
- Annual Reports
- White Paper
- Latest Press Release
- Industry Association
- Paid Database
- Investor Presentations

Step 4 - Data Triangulation
Involves using different sources of information in order to increase the validity of a study
These sources are likely to be stakeholders in a program - participants, other researchers, program staff, other community members, and so on.
Then we put all data in single framework & apply various statistical tools to find out the dynamic on the market.
During the analysis stage, feedback from the stakeholder groups would be compared to determine areas of agreement as well as areas of divergence


