

Key Insights
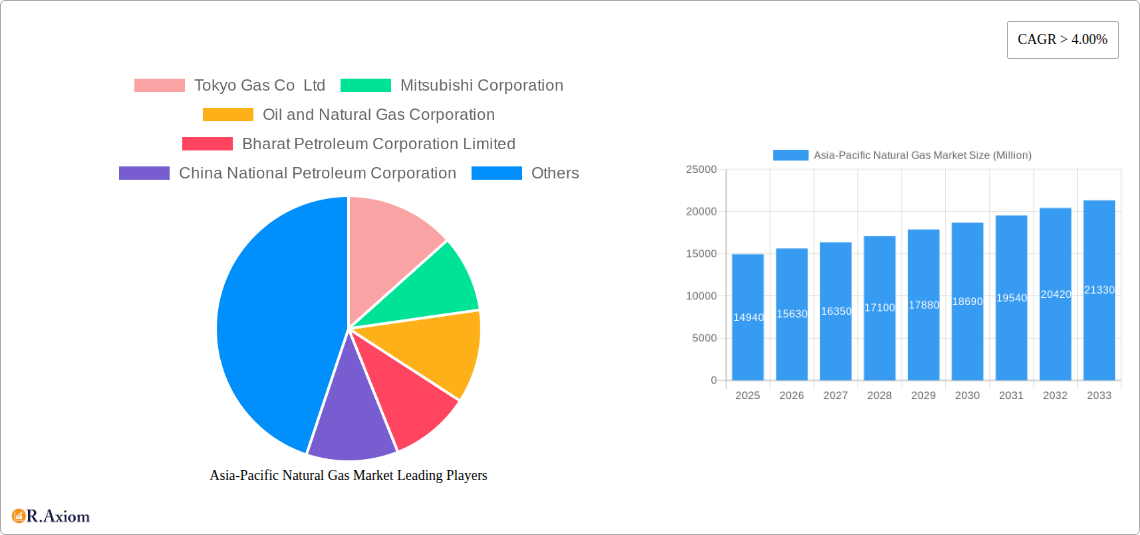
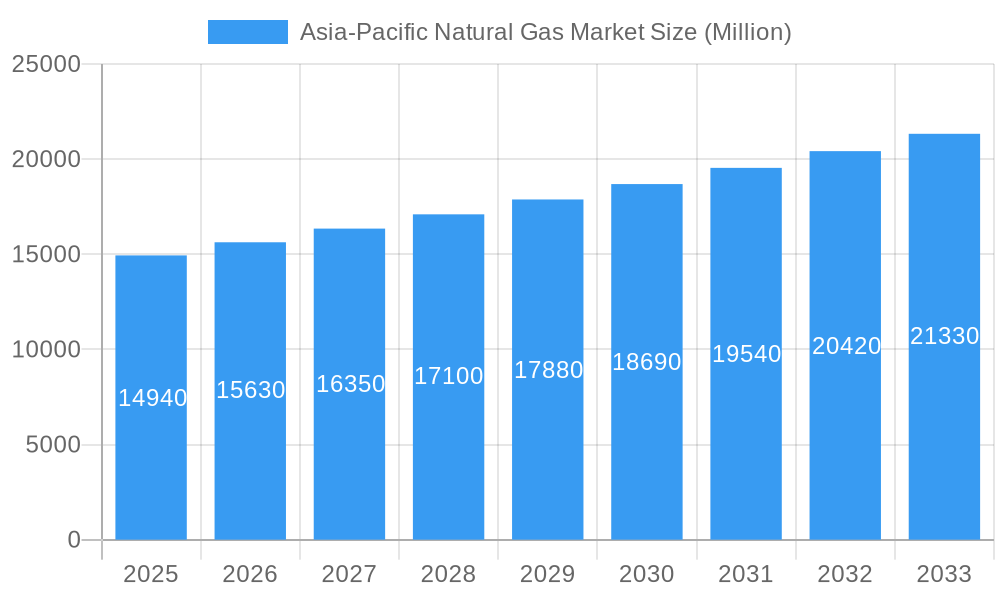
The Asia-Pacific natural gas market, valued at $14,940 million in 2025, is projected to experience robust growth, driven by increasing energy demand across the region's rapidly developing economies. China, Japan, India, and South Korea are key contributors, with substantial investments in infrastructure development, particularly LNG import terminals, facilitating a shift towards cleaner energy sources. The rising industrialization and urbanization in these countries fuel the demand for natural gas in power generation, industrial processes, and residential heating. Furthermore, government initiatives promoting cleaner energy and reducing reliance on coal contribute significantly to market expansion. Growth is segmented across various types, with LNG expected to lead due to its ease of transportation and storage, catering to the diverse needs of utilities, industrial sectors, and residential consumers. However, challenges remain, including price volatility linked to global supply chains and geopolitical factors, as well as the need for continued investment in pipeline infrastructure to optimize distribution networks efficiently throughout the region.
Asia-Pacific Natural Gas Market Market Size (In Billion)
The market's Compound Annual Growth Rate (CAGR) exceeding 4.00% from 2025 to 2033 indicates a sustained upward trajectory. While unconventional natural gas resources present opportunities for domestic production in certain countries, the market will continue to rely heavily on imports of LNG. Competition among major players like Tokyo Gas Co. Ltd, Mitsubishi Corporation, and GAIL Limited will intensify as they strive to secure market share and expand their operations in this dynamic landscape. The residential segment is poised for considerable growth, driven by rising living standards and increasing adoption of natural gas for heating and cooking. However, environmental concerns related to methane emissions need to be addressed proactively through technological advancements and stringent regulations to ensure sustainable growth of the Asia-Pacific natural gas market.
Asia-Pacific Natural Gas Market Company Market Share
Asia-Pacific Natural Gas Market Report: 2019-2033
This comprehensive report provides an in-depth analysis of the Asia-Pacific natural gas market, covering historical data (2019-2024), the base year (2025), and a detailed forecast (2025-2033). The report segments the market by type (conventional, unconventional, LNG), application (power generation, industrial, residential, transportation), and end-user industry (utilities, industrial, residential, transportation), offering actionable insights for industry stakeholders. Key players such as Tokyo Gas Co Ltd, Mitsubishi Corporation, Oil and Natural Gas Corporation, Bharat Petroleum Corporation Limited, China National Petroleum Corporation, Korea Gas Corporation, China Petroleum & Chemical Corporation, Chevron Corporation, GAIL Limited, and ENN Energy Holdings Limited are analyzed, providing a complete picture of this dynamic market.
Asia-Pacific Natural Gas Market Concentration & Innovation
The Asia-Pacific natural gas market exhibits a moderately concentrated structure, with a few major players holding significant market share. While exact figures vary by segment and country, the top five companies likely account for xx% of the overall market value in 2025. However, the market is characterized by intense competition, particularly in downstream segments like LNG distribution and retail. Innovation is driven by several factors:
- Technological advancements: Improvements in exploration and extraction technologies (e.g., shale gas extraction, improved LNG liquefaction and regasification) are boosting production.
- Regulatory frameworks: Government policies promoting natural gas as a cleaner energy source and supporting infrastructure development are influencing market dynamics. Variations in regulatory environments across countries create both opportunities and challenges.
- Product substitutes: Competition from renewable energy sources (solar, wind) and other fuels (coal, petroleum) puts pressure on natural gas prices and market share. The development of hydrogen blending technologies presents both a threat and opportunity.
- End-user trends: Shifting energy consumption patterns across various sectors (industrial, residential, transportation) and growing urbanization are major drivers of market growth.
- M&A activities: Strategic mergers and acquisitions (M&A) are shaping the competitive landscape. While specific deal values vary, large-scale M&A activity in the past five years has likely exceeded USD xx billion, primarily focused on consolidation of downstream operations and expansion into new markets. The average deal size for major acquisitions in this period has been approximately USD xx million.
Asia-Pacific Natural Gas Market Industry Trends & Insights
The Asia-Pacific natural gas market is expected to experience significant growth during the forecast period (2025-2033), with a projected CAGR of xx%. Several factors contribute to this growth:
Strong economic growth in several Asia-Pacific countries, particularly in India and China, fuels increased energy demand. The rising middle class and urbanization are driving increased consumption in residential and transportation sectors. Government initiatives promoting natural gas as a transition fuel in the move towards a lower-carbon energy mix stimulate investment in infrastructure and exploration. Technological disruptions in the upstream sector, notably in unconventional gas extraction, are increasing the availability of natural gas reserves. However, price volatility linked to global supply chains, geopolitical factors, and competition from renewable energy sources are key challenges that influence market dynamics. The market penetration of natural gas in power generation is expected to reach xx% by 2033, while its penetration in industrial applications will likely reach xx%. The consumer preference is shifting towards cleaner energy sources, presenting both opportunities and constraints for natural gas market expansion.
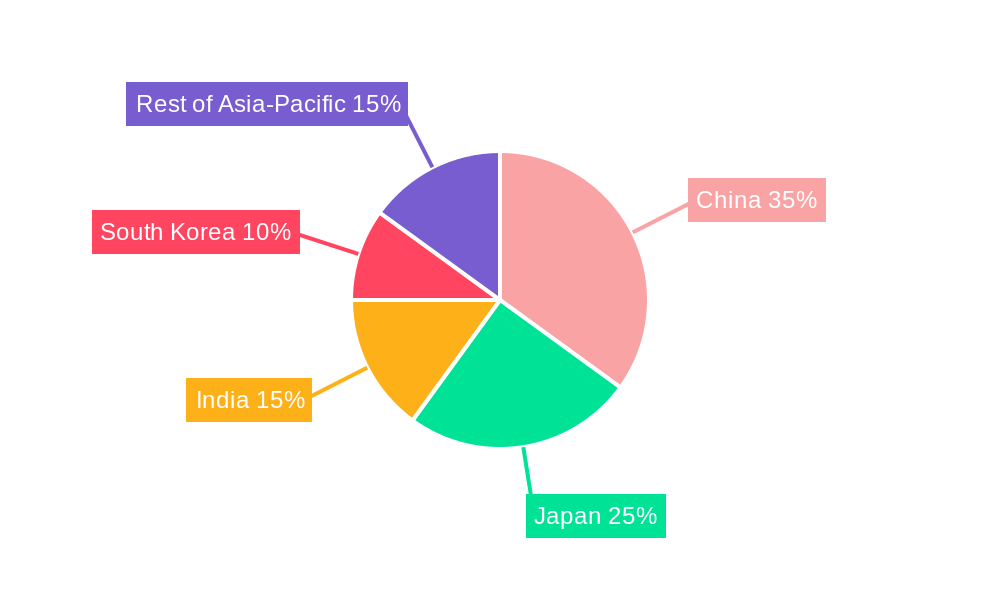
Dominant Markets & Segments in Asia-Pacific Natural Gas Market
Leading Regions/Countries: China and India are the dominant markets in the Asia-Pacific region due to their large populations, rapid economic growth, and substantial energy demands. Other key markets include Australia, Japan, South Korea, and several Southeast Asian nations.
Dominant Segments:
- By Type: LNG holds a significant share due to its ease of transportation and growing global trade. However, conventional natural gas remains a dominant source. The growth in unconventional natural gas is expected to increase, although regulations and environmental concerns remain important factors.
- By Application: Power generation is currently the largest application segment, followed by industrial use. However, the residential and transportation sectors are projected to experience strong growth driven by government initiatives to expand gas infrastructure and consumer preference for cleaner fuels.
- By End-User Industry: The industrial sector is a major consumer, particularly in manufacturing and heavy industries. Utilities account for substantial consumption in power generation. The residential and transportation sectors are steadily increasing their reliance on natural gas.
Key Drivers for dominant segments:
- Economic policies: Government subsidies, tax incentives, and supportive regulations are key drivers for natural gas adoption, especially in the residential sector.
- Infrastructure development: Investments in pipelines, LNG terminals, and distribution networks are crucial for market expansion.
Asia-Pacific Natural Gas Market Product Developments
Recent product innovations focus on enhancing efficiency and environmental performance. The development of hydrogen blending technology, as demonstrated by GAIL in India, is a significant example of adapting to evolving consumer preferences and regulatory requirements. This strategy aims to reduce carbon emissions and improve the overall sustainability of natural gas. Furthermore, advancements in LNG transportation and storage technologies are making natural gas more accessible to remote areas and reducing its environmental impact. These innovations improve the market fit of natural gas in a changing energy landscape.
Report Scope & Segmentation Analysis
The report provides a comprehensive segmentation of the Asia-Pacific natural gas market.
By Type: The market is segmented into conventional natural gas, unconventional natural gas (including shale gas), and liquefied natural gas (LNG). Growth projections vary significantly across these segments, with LNG expected to have strong growth.
By Application: This includes power generation, industrial use, residential use, and transportation. Market size and growth rates vary across these applications, with power generation currently dominating.
By End-User Industry: The report analyzes the utilities, industrial, residential, and transportation sectors. Each segment presents unique growth dynamics and competitive pressures.
Key Drivers of Asia-Pacific Natural Gas Market Growth
Strong economic growth across the region is a primary driver. Government policies favoring natural gas as a cleaner fuel and supporting infrastructure development significantly influence the market. Technological advancements in exploration, production, and transportation of LNG are also critical factors.
Challenges in the Asia-Pacific Natural Gas Market Sector
Regulatory hurdles and inconsistent policies across different countries present challenges. Supply chain disruptions and price volatility of natural gas in the global market affect market stability. Competition from renewable energy sources puts pressure on natural gas prices and market share.
Emerging Opportunities in Asia-Pacific Natural Gas Market
Expansion of gas infrastructure into under-served areas holds significant potential. Growth in the residential and transportation sectors presents considerable opportunities. The development and adoption of technologies like hydrogen blending open new avenues for sustainable growth.
Leading Players in the Asia-Pacific Natural Gas Market Market
Key Developments in Asia-Pacific Natural Gas Market Industry
- July 2022: The Indian government targets a 15% share of natural gas in the energy mix by 2030, significantly boosting domestic demand and infrastructure investments. 95.21 lakh PNG connections and 4531 CNG stations were established as of May 31, 2022.
- May 2022: CNOOC's USD 2.42 billion investment in LNG tankers signals strong future demand and capacity expansion within the LNG sector, impacting international trade dynamics.
- January 2022: GAIL's hydrogen blending initiative in India marks a significant step towards decarbonizing natural gas and creating new market opportunities.
Strategic Outlook for Asia-Pacific Natural Gas Market Market
The Asia-Pacific natural gas market is poised for sustained growth, driven by strong economic development and supportive government policies. Technological innovation, particularly in LNG and hydrogen blending, will play a crucial role in shaping the market's future. Continued investment in infrastructure and addressing environmental concerns will be essential for ensuring long-term sustainability. The market offers considerable opportunities for both established players and new entrants.
Asia-Pacific Natural Gas Market Segmentation
- 1. China
- 2. India
- 3. Japan
- 4. South Korea
- 5. Rest of Asia-Pacific
Asia-Pacific Natural Gas Market Segmentation By Geography
-
1. Asia Pacific
- 1.1. China
- 1.2. Japan
- 1.3. South Korea
- 1.4. India
- 1.5. Australia
- 1.6. New Zealand
- 1.7. Indonesia
- 1.8. Malaysia
- 1.9. Singapore
- 1.10. Thailand
- 1.11. Vietnam
- 1.12. Philippines
Asia-Pacific Natural Gas Market Regional Market Share
Geographic Coverage of Asia-Pacific Natural Gas Market
Asia-Pacific Natural Gas Market REPORT HIGHLIGHTS
| Aspects | Details |
|---|---|
| Study Period | 2020-2034 |
| Base Year | 2025 |
| Estimated Year | 2026 |
| Forecast Period | 2026-2034 |
| Historical Period | 2020-2025 |
| Growth Rate | CAGR of > 4.00% from 2020-2034 |
| Segmentation |
|
Table of Contents
- 1. Introduction
- 1.1. Research Scope
- 1.2. Market Segmentation
- 1.3. Research Objective
- 1.4. Definitions and Assumptions
- 2. Executive Summary
- 2.1. Market Snapshot
- 3. Market Dynamics
- 3.1. Market Drivers
- 3.2. Market Restrains
- 3.3. Market Trends
- 3.4. Market Opportunities
- 4. Market Factor Analysis
- 4.1. Porters Five Forces
- 4.1.1. Bargaining Power of Suppliers
- 4.1.2. Bargaining Power of Buyers
- 4.1.3. Threat of New Entrants
- 4.1.4. Threat of Substitutes
- 4.1.5. Competitive Rivalry
- 4.2. PESTEL analysis
- 4.3. BCG Analysis
- 4.3.1. Stars (High Growth, High Market Share)
- 4.3.2. Cash Cows (Low Growth, High Market Share)
- 4.3.3. Question Mark (High Growth, Low Market Share)
- 4.3.4. Dogs (Low Growth, Low Market Share)
- 4.4. Ansoff Matrix Analysis
- 4.5. Supply Chain Analysis
- 4.6. Regulatory Landscape
- 4.7. Current Market Potential and Opportunity Assessment (TAM–SAM–SOM Framework)
- 4.8. RAX Analyst Note
- 4.1. Porters Five Forces
- 5. Market Analysis, Insights and Forecast 2021-2033
- 5.1. Market Analysis, Insights and Forecast - by China
- 5.2. Market Analysis, Insights and Forecast - by India
- 5.3. Market Analysis, Insights and Forecast - by Japan
- 5.4. Market Analysis, Insights and Forecast - by South Korea
- 5.5. Market Analysis, Insights and Forecast - by Rest of Asia-Pacific
- 5.6. Market Analysis, Insights and Forecast - by Region
- 5.6.1. Asia Pacific
- 6. Asia-Pacific Natural Gas Market Analysis, Insights and Forecast, 2021-2033
- 6.1. Market Analysis, Insights and Forecast - by China
- 6.2. Market Analysis, Insights and Forecast - by India
- 6.3. Market Analysis, Insights and Forecast - by Japan
- 6.4. Market Analysis, Insights and Forecast - by South Korea
- 6.5. Market Analysis, Insights and Forecast - by Rest of Asia-Pacific
- 7. Competitive Analysis
- 7.1. Company Profiles
- 7.1.1 Tokyo Gas Co Ltd
- 7.1.1.1. Company Overview
- 7.1.1.2. Products
- 7.1.1.3. Company Financials
- 7.1.1.4. SWOT Analysis
- 7.1.2 Mitsubishi Corporation
- 7.1.2.1. Company Overview
- 7.1.2.2. Products
- 7.1.2.3. Company Financials
- 7.1.2.4. SWOT Analysis
- 7.1.3 Oil and Natural Gas Corporation
- 7.1.3.1. Company Overview
- 7.1.3.2. Products
- 7.1.3.3. Company Financials
- 7.1.3.4. SWOT Analysis
- 7.1.4 Bharat Petroleum Corporation Limited
- 7.1.4.1. Company Overview
- 7.1.4.2. Products
- 7.1.4.3. Company Financials
- 7.1.4.4. SWOT Analysis
- 7.1.5 China National Petroleum Corporation
- 7.1.5.1. Company Overview
- 7.1.5.2. Products
- 7.1.5.3. Company Financials
- 7.1.5.4. SWOT Analysis
- 7.1.6 Korea Gas Corporation
- 7.1.6.1. Company Overview
- 7.1.6.2. Products
- 7.1.6.3. Company Financials
- 7.1.6.4. SWOT Analysis
- 7.1.7 China Petroleum & Chemical Corporation
- 7.1.7.1. Company Overview
- 7.1.7.2. Products
- 7.1.7.3. Company Financials
- 7.1.7.4. SWOT Analysis
- 7.1.8 Chevron Corporation
- 7.1.8.1. Company Overview
- 7.1.8.2. Products
- 7.1.8.3. Company Financials
- 7.1.8.4. SWOT Analysis
- 7.1.9 GAIL Limited
- 7.1.9.1. Company Overview
- 7.1.9.2. Products
- 7.1.9.3. Company Financials
- 7.1.9.4. SWOT Analysis
- 7.1.10 ENN Energy Holdings Limited*List Not Exhaustive
- 7.1.10.1. Company Overview
- 7.1.10.2. Products
- 7.1.10.3. Company Financials
- 7.1.10.4. SWOT Analysis
- 7.1.1 Tokyo Gas Co Ltd
- 7.2. Market Entropy
- 7.2.1 Company's Key Areas Served
- 7.2.2 Recent Developments
- 7.3. Company Market Share Analysis 2025
- 7.3.1 Top 5 Companies Market Share Analysis
- 7.3.2 Top 3 Companies Market Share Analysis
- 7.4. List of Potential Customers
- 8. Research Methodology
List of Figures
- Figure 1: Asia-Pacific Natural Gas Market Revenue Breakdown (Million, %) by Product 2025 & 2033
- Figure 2: Asia-Pacific Natural Gas Market Share (%) by Company 2025
List of Tables
- Table 1: Asia-Pacific Natural Gas Market Revenue Million Forecast, by China 2020 & 2033
- Table 2: Asia-Pacific Natural Gas Market Volume K Tons Forecast, by China 2020 & 2033
- Table 3: Asia-Pacific Natural Gas Market Revenue Million Forecast, by India 2020 & 2033
- Table 4: Asia-Pacific Natural Gas Market Volume K Tons Forecast, by India 2020 & 2033
- Table 5: Asia-Pacific Natural Gas Market Revenue Million Forecast, by Japan 2020 & 2033
- Table 6: Asia-Pacific Natural Gas Market Volume K Tons Forecast, by Japan 2020 & 2033
- Table 7: Asia-Pacific Natural Gas Market Revenue Million Forecast, by South Korea 2020 & 2033
- Table 8: Asia-Pacific Natural Gas Market Volume K Tons Forecast, by South Korea 2020 & 2033
- Table 9: Asia-Pacific Natural Gas Market Revenue Million Forecast, by Rest of Asia-Pacific 2020 & 2033
- Table 10: Asia-Pacific Natural Gas Market Volume K Tons Forecast, by Rest of Asia-Pacific 2020 & 2033
- Table 11: Asia-Pacific Natural Gas Market Revenue Million Forecast, by Region 2020 & 2033
- Table 12: Asia-Pacific Natural Gas Market Volume K Tons Forecast, by Region 2020 & 2033
- Table 13: Asia-Pacific Natural Gas Market Revenue Million Forecast, by China 2020 & 2033
- Table 14: Asia-Pacific Natural Gas Market Volume K Tons Forecast, by China 2020 & 2033
- Table 15: Asia-Pacific Natural Gas Market Revenue Million Forecast, by India 2020 & 2033
- Table 16: Asia-Pacific Natural Gas Market Volume K Tons Forecast, by India 2020 & 2033
- Table 17: Asia-Pacific Natural Gas Market Revenue Million Forecast, by Japan 2020 & 2033
- Table 18: Asia-Pacific Natural Gas Market Volume K Tons Forecast, by Japan 2020 & 2033
- Table 19: Asia-Pacific Natural Gas Market Revenue Million Forecast, by South Korea 2020 & 2033
- Table 20: Asia-Pacific Natural Gas Market Volume K Tons Forecast, by South Korea 2020 & 2033
- Table 21: Asia-Pacific Natural Gas Market Revenue Million Forecast, by Rest of Asia-Pacific 2020 & 2033
- Table 22: Asia-Pacific Natural Gas Market Volume K Tons Forecast, by Rest of Asia-Pacific 2020 & 2033
- Table 23: Asia-Pacific Natural Gas Market Revenue Million Forecast, by Country 2020 & 2033
- Table 24: Asia-Pacific Natural Gas Market Volume K Tons Forecast, by Country 2020 & 2033
- Table 25: China Asia-Pacific Natural Gas Market Revenue (Million) Forecast, by Application 2020 & 2033
- Table 26: China Asia-Pacific Natural Gas Market Volume (K Tons) Forecast, by Application 2020 & 2033
- Table 27: Japan Asia-Pacific Natural Gas Market Revenue (Million) Forecast, by Application 2020 & 2033
- Table 28: Japan Asia-Pacific Natural Gas Market Volume (K Tons) Forecast, by Application 2020 & 2033
- Table 29: South Korea Asia-Pacific Natural Gas Market Revenue (Million) Forecast, by Application 2020 & 2033
- Table 30: South Korea Asia-Pacific Natural Gas Market Volume (K Tons) Forecast, by Application 2020 & 2033
- Table 31: India Asia-Pacific Natural Gas Market Revenue (Million) Forecast, by Application 2020 & 2033
- Table 32: India Asia-Pacific Natural Gas Market Volume (K Tons) Forecast, by Application 2020 & 2033
- Table 33: Australia Asia-Pacific Natural Gas Market Revenue (Million) Forecast, by Application 2020 & 2033
- Table 34: Australia Asia-Pacific Natural Gas Market Volume (K Tons) Forecast, by Application 2020 & 2033
- Table 35: New Zealand Asia-Pacific Natural Gas Market Revenue (Million) Forecast, by Application 2020 & 2033
- Table 36: New Zealand Asia-Pacific Natural Gas Market Volume (K Tons) Forecast, by Application 2020 & 2033
- Table 37: Indonesia Asia-Pacific Natural Gas Market Revenue (Million) Forecast, by Application 2020 & 2033
- Table 38: Indonesia Asia-Pacific Natural Gas Market Volume (K Tons) Forecast, by Application 2020 & 2033
- Table 39: Malaysia Asia-Pacific Natural Gas Market Revenue (Million) Forecast, by Application 2020 & 2033
- Table 40: Malaysia Asia-Pacific Natural Gas Market Volume (K Tons) Forecast, by Application 2020 & 2033
- Table 41: Singapore Asia-Pacific Natural Gas Market Revenue (Million) Forecast, by Application 2020 & 2033
- Table 42: Singapore Asia-Pacific Natural Gas Market Volume (K Tons) Forecast, by Application 2020 & 2033
- Table 43: Thailand Asia-Pacific Natural Gas Market Revenue (Million) Forecast, by Application 2020 & 2033
- Table 44: Thailand Asia-Pacific Natural Gas Market Volume (K Tons) Forecast, by Application 2020 & 2033
- Table 45: Vietnam Asia-Pacific Natural Gas Market Revenue (Million) Forecast, by Application 2020 & 2033
- Table 46: Vietnam Asia-Pacific Natural Gas Market Volume (K Tons) Forecast, by Application 2020 & 2033
- Table 47: Philippines Asia-Pacific Natural Gas Market Revenue (Million) Forecast, by Application 2020 & 2033
- Table 48: Philippines Asia-Pacific Natural Gas Market Volume (K Tons) Forecast, by Application 2020 & 2033
Frequently Asked Questions
1. What is the projected Compound Annual Growth Rate (CAGR) of the Asia-Pacific Natural Gas Market?
The projected CAGR is approximately > 4.00%.
2. Which companies are prominent players in the Asia-Pacific Natural Gas Market?
Key companies in the market include Tokyo Gas Co Ltd, Mitsubishi Corporation, Oil and Natural Gas Corporation, Bharat Petroleum Corporation Limited, China National Petroleum Corporation, Korea Gas Corporation, China Petroleum & Chemical Corporation, Chevron Corporation, GAIL Limited, ENN Energy Holdings Limited*List Not Exhaustive.
3. What are the main segments of the Asia-Pacific Natural Gas Market?
The market segments include China, India, Japan, South Korea, Rest of Asia-Pacific.
4. Can you provide details about the market size?
The market size is estimated to be USD 14940 Million as of 2022.
5. What are some drivers contributing to market growth?
4.; Increasing Electricity Demand4.; Rsing Investments in the Coal Industry.
6. What are the notable trends driving market growth?
Increasing Investments in Natural Gas Production to Drive the Market.
7. Are there any restraints impacting market growth?
4.; Increasing Installation of Renewable Energy Sources.
8. Can you provide examples of recent developments in the market?
July 2022: The Indian government announced that it had set a target to raise the share of natural gas in the energy mix to 15% by 2030 from the current 6.3%. According to the data demonstrated by the Ministry of Petroleum & Natural Gas, 95.21 lakh PNG (Domestic) connections have been provided, and the authorized entities have established 4531 CNG (Transport) stations as of 31 May 2022.
9. What pricing options are available for accessing the report?
Pricing options include single-user, multi-user, and enterprise licenses priced at USD 4750, USD 5250, and USD 8750 respectively.
10. Is the market size provided in terms of value or volume?
The market size is provided in terms of value, measured in Million and volume, measured in K Tons.
11. Are there any specific market keywords associated with the report?
Yes, the market keyword associated with the report is "Asia-Pacific Natural Gas Market," which aids in identifying and referencing the specific market segment covered.
12. How do I determine which pricing option suits my needs best?
The pricing options vary based on user requirements and access needs. Individual users may opt for single-user licenses, while businesses requiring broader access may choose multi-user or enterprise licenses for cost-effective access to the report.
13. Are there any additional resources or data provided in the Asia-Pacific Natural Gas Market report?
While the report offers comprehensive insights, it's advisable to review the specific contents or supplementary materials provided to ascertain if additional resources or data are available.
14. How can I stay updated on further developments or reports in the Asia-Pacific Natural Gas Market?
To stay informed about further developments, trends, and reports in the Asia-Pacific Natural Gas Market, consider subscribing to industry newsletters, following relevant companies and organizations, or regularly checking reputable industry news sources and publications.
Methodology
Step 1 - Identification of Relevant Samples Size from Population Database


Step 2 - Approaches for Defining Global Market Size (Value, Volume* & Price*)

Note*: In applicable scenarios
Step 3 - Data Sources
Primary Research
- Web Analytics
- Survey Reports
- Research Institute
- Latest Research Reports
- Opinion Leaders
Secondary Research
- Annual Reports
- White Paper
- Latest Press Release
- Industry Association
- Paid Database
- Investor Presentations

Step 4 - Data Triangulation
Involves using different sources of information in order to increase the validity of a study
These sources are likely to be stakeholders in a program - participants, other researchers, program staff, other community members, and so on.
Then we put all data in single framework & apply various statistical tools to find out the dynamic on the market.
During the analysis stage, feedback from the stakeholder groups would be compared to determine areas of agreement as well as areas of divergence