

Key Insights
The global athletic shoe market, valued at $173.89 billion in 2025, is projected to experience robust growth, driven by several key factors. Increasing health consciousness and participation in fitness activities, coupled with rising disposable incomes in developing economies, are significantly boosting demand. The market is segmented by product type (running shoes, sports shoes, trekking/hiking shoes, and others), end-user (men, women, and children), and distribution channel (specialty stores, supermarkets/hypermarkets, and online retailers). The strong online retail segment reflects the growing preference for e-commerce, offering convenience and wider selections. Major industry players like Nike, Adidas, Under Armour, and Asics are constantly innovating with technologically advanced footwear, incorporating features like enhanced cushioning, breathability, and durability, further stimulating market expansion. The Asia-Pacific region, fueled by a burgeoning middle class and increasing sports participation, is expected to demonstrate substantial growth in the coming years. However, factors like fluctuating raw material prices and the potential for economic downturns could pose challenges. The competitive landscape is characterized by intense rivalry among established brands and emerging players, leading to strategic partnerships, product diversification, and aggressive marketing initiatives.
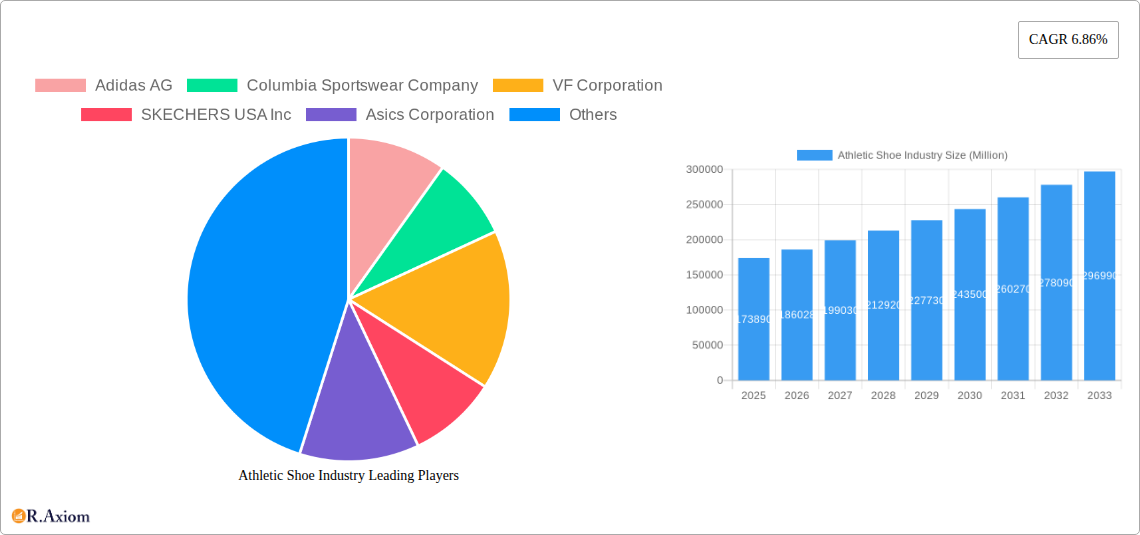
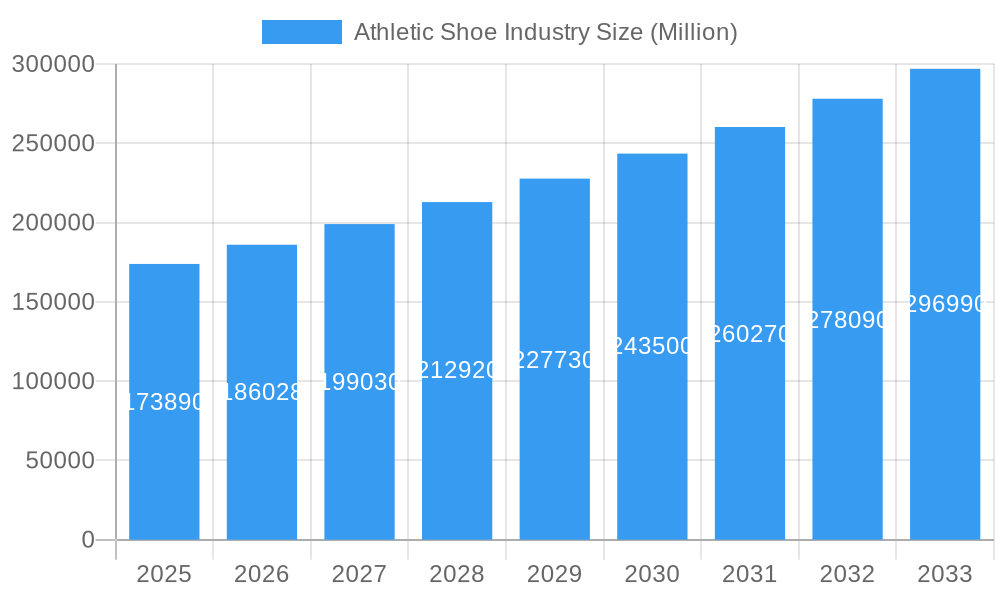
Athletic Shoe Industry Market Size (In Billion)
Despite potential challenges, the long-term outlook for the athletic shoe market remains positive, particularly given the increasing global focus on health and wellness. The market's segmentation provides various opportunities for specialized products and targeted marketing. The continued expansion of e-commerce and the growth of athletic and fitness-related events will likely further fuel demand. Brands are focusing on sustainability and ethical sourcing to appeal to environmentally conscious consumers, shaping future market trends. Geographical expansion into untapped markets, particularly in developing economies, presents promising avenues for growth. Strategic collaborations and acquisitions will also play a crucial role in shaping the market's future, driving innovation and expanding market share. The projected Compound Annual Growth Rate (CAGR) of 6.86% indicates a strong and consistent growth trajectory for the athletic shoe market through 2033.
Athletic Shoe Industry Company Market Share
Athletic Shoe Industry Market Report: 2019-2033
This comprehensive report provides a detailed analysis of the global athletic shoe industry, offering invaluable insights for stakeholders seeking to understand market trends, competitive dynamics, and future growth opportunities. Covering the period from 2019 to 2033, with 2025 as the base year, this report analyzes a market valued at $xx Million in 2025, projected to reach $xx Million by 2033, exhibiting a CAGR of xx% during the forecast period (2025-2033).
Athletic Shoe Industry Market Concentration & Innovation
This section delves into the competitive landscape of the athletic shoe industry, analyzing market concentration, innovation drivers, regulatory aspects, and strategic activities. The industry is characterized by a high degree of concentration, with key players such as Nike Inc., Adidas AG, and Puma SE holding significant market share. In 2024, Nike held an estimated xx% market share, followed by Adidas AG at xx% and Puma SE at xx%. The remaining share is distributed among other significant players including Under Armour Inc, SKECHERS USA Inc, Asics Corporation, VF Corporation, New Balance Athletics Inc, and Columbia Sportswear Company. Innovation is a crucial driver, with companies constantly investing in new materials, designs, and technologies to enhance performance and appeal.
- Market Share Concentration: High, with top 3 players holding over xx% of the market.
- Innovation Drivers: Technological advancements in materials, manufacturing, and design. Focus on sustainability and personalized products.
- Regulatory Frameworks: Vary by region, impacting manufacturing and labeling requirements.
- Product Substitutes: Limited, but increasing competition from casual footwear brands.
- End-User Trends: Growing demand for specialized footwear catering to specific sports and activities. Increasing preference for sustainable and ethically sourced products.
- M&A Activities: Significant M&A activity observed in the historical period (2019-2024), with deal values exceeding $xx Million in total. This includes acquisitions focused on expanding product lines, enhancing distribution networks, and acquiring specialized technologies.
Athletic Shoe Industry Industry Trends & Insights
The athletic shoe market is experiencing robust growth driven by several factors, including rising health consciousness, increasing participation in sports and fitness activities, growing disposable incomes in emerging economies, and the proliferation of e-commerce platforms. The industry is also witnessing significant technological disruptions, particularly in materials science and manufacturing processes. 3D printing and advanced materials like graphene are transforming shoe design and production. Consumer preferences are shifting towards sustainable and ethical products, prompting brands to adopt eco-friendly practices. The competitive landscape remains fiercely contested, with established players and new entrants vying for market share through innovation, branding, and strategic partnerships. The market is expected to maintain a healthy growth trajectory, driven by these factors.
Dominant Markets & Segments in Athletic Shoe Industry
This section identifies the leading regions, countries, and market segments within the athletic shoe industry.
By Product Type:
- Running Shoes: Remains the largest segment, driven by the popularity of running as a fitness activity and the increasing demand for high-performance running shoes.
- Sports Shoes: A significant segment catering to various sports and activities, showcasing considerable growth driven by the increase in participation in team sports and individual athletic pursuits.
- Trekking/Hiking Shoes: This segment demonstrates robust growth due to the growing popularity of outdoor activities like hiking and trekking.
- Other Product Types: Includes casual athletic shoes, walking shoes, and other specialized footwear.
By End User:
- Men: The largest segment, driven by higher participation rates in sports and fitness activities compared to women and children.
- Women: Experiencing significant growth, mirroring the growing participation of women in sports and fitness activities.
- Kids/Children: A steadily growing segment as children's participation in sports and physical activities increases.
By Distribution Channel:
- Sports and Athletic Goods Stores: Remains a dominant channel, offering specialized expertise and a wide product selection.
- Supermarkets/Hypermarkets: A growing channel of distribution, offering convenience and accessibility to a broad consumer base.
- Online Retail Stores: The fastest-growing channel, offering convenience and a wide range of choices.
- Other Distribution Channels: Includes direct-to-consumer sales, specialty stores, and other channels.
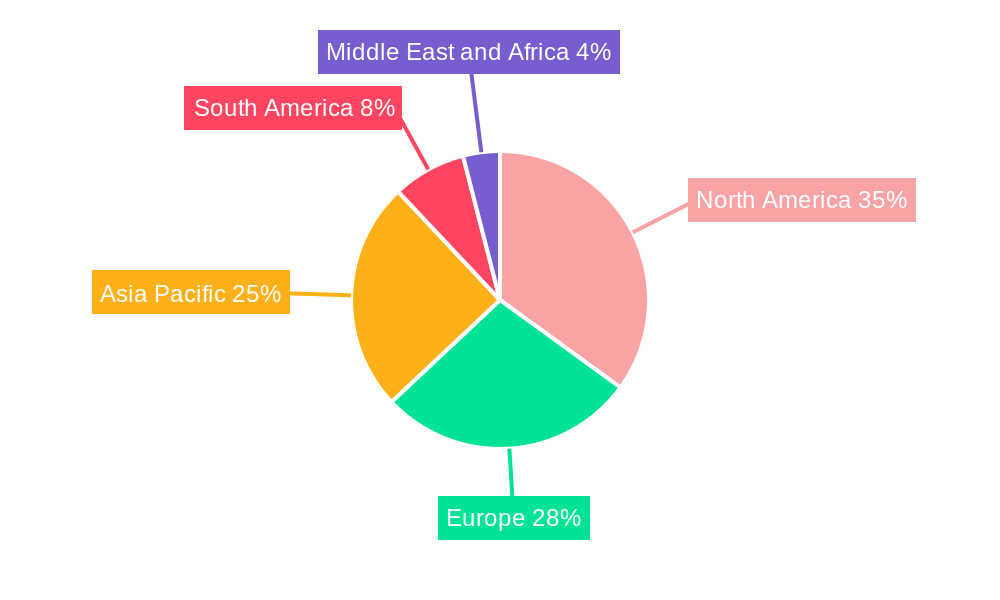
Dominant Regions/Countries: North America and Western Europe currently hold the largest market share due to high per capita income and strong consumer demand, but Asia-Pacific is projected to experience the fastest growth over the forecast period. Key drivers in these regions include:
- Economic Policies: Supportive government policies promoting sports and fitness activities.
- Infrastructure: Well-developed infrastructure supporting sports and recreational activities.
- Consumer Preferences: Growing preference for comfort, style, and technological advancements in footwear.
Athletic Shoe Industry Product Developments
Recent product innovations emphasize technological advancements in materials and design. Brands are incorporating sustainable materials, improved cushioning systems, and data-driven insights to create highly personalized and performance-enhancing footwear. This includes the integration of smart technologies for performance monitoring and personalized feedback. The focus is on creating products that seamlessly blend performance, comfort, and style, catering to the evolving needs and preferences of consumers.
Report Scope & Segmentation Analysis
This report provides a comprehensive analysis of the global athletic shoe market, segmented by product type (running shoes, sports shoes, trekking/hiking shoes, other product types), end-user (men, women, kids/children), and distribution channel (sports and athletic goods stores, supermarkets/hypermarkets, online retail stores, other distribution channels). Each segment's market size, growth projections, and competitive dynamics are analyzed in detail, providing actionable insights into the market's structure and future trajectory. Growth projections are detailed within the relevant section above. Competitive dynamics are largely shaped by brand recognition, innovation, and pricing strategies.
Key Drivers of Athletic Shoe Industry Growth
The athletic shoe industry's growth is propelled by several key factors: increasing health and fitness awareness, rising disposable incomes, particularly in emerging markets, and the proliferation of e-commerce. Technological advancements, like the use of innovative materials and 3D printing, are streamlining production and enhancing product performance. Favorable government policies promoting sports and fitness further contribute to market expansion.
Challenges in the Athletic Shoe Industry Sector
The athletic shoe industry faces challenges, including intense competition, fluctuating raw material costs, and increasing pressure to adopt sustainable manufacturing practices. Supply chain disruptions can significantly impact production and delivery, leading to potential revenue losses. Stringent regulatory requirements regarding materials and manufacturing processes can add to the costs and complexity of operations. The industry faces pressure from counterfeiting and gray market products, which undermines brand value and profits.
Emerging Opportunities in Athletic Shoe Industry
Emerging opportunities include the growing market for sustainable and ethically sourced footwear, the rise of personalized footwear solutions through 3D printing and data-driven design, and expansion into new and untapped markets in developing economies. The integration of smart technologies into athletic shoes, offering performance tracking and personalized feedback, presents significant potential for growth.
Leading Players in the Athletic Shoe Industry Market
- Adidas AG
- Columbia Sportswear Company
- VF Corporation
- SKECHERS USA Inc
- Asics Corporation
- Puma SE
- Under Armour Inc
- Nike Inc
- New Balance Athletics Inc
- Fila
Key Developments in Athletic Shoe Industry Industry
- June 2024: Nike launched the Converse Run Star Trainer, a low-profile shoe combining retro and modern aesthetics, broadening its product portfolio and targeting a younger demographic.
- June 2024: PUMA's partnership with HYROX expands its brand reach into the fitness racing market, enhancing brand visibility and driving sales of its apparel and footwear.
- June 2024: PUMA launched Deviate NITRO 3 training shoes, leveraging its NITROFOAM technology to enhance product performance and attract customers seeking high-quality training footwear.
Strategic Outlook for Athletic Shoe Industry Market
The athletic shoe industry is poised for continued growth, driven by increasing health consciousness, technological advancements, and the expansion into new markets. Brands that prioritize sustainability, personalization, and technological innovation will be best positioned to capture market share. The ongoing shift towards e-commerce will continue to reshape the industry's distribution landscape. Focus on data-driven insights to understand evolving consumer preferences will become increasingly crucial for success.
Athletic Shoe Industry Segmentation
-
1. Product Type
- 1.1. Running Shoes
- 1.2. Sports Shoes
- 1.3. Trekking/Hiking Shoes
- 1.4. Other Product Types
-
2. End User
- 2.1. Men
- 2.2. Women
- 2.3. Kids/Children
-
3. Distribution Channel
- 3.1. Sports and Atheletic Goods Stores
- 3.2. Supermarkets/Hypermarkets
- 3.3. Online Retail Stores
- 3.4. Other Distribution Channels
Athletic Shoe Industry Segmentation By Geography
-
1. North America
- 1.1. United States
- 1.2. Canada
- 1.3. Mexico
- 1.4. Rest of North America
-
2. Europe
- 2.1. United Kingdom
- 2.2. Germany
- 2.3. Spain
- 2.4. France
- 2.5. Italy
- 2.6. Netherlands
- 2.7. Rest of Europe
-
3. Asia Pacific
- 3.1. China
- 3.2. Japan
- 3.3. India
- 3.4. Australia
- 3.5. Rest of Asia Pacific
-
4. South America
- 4.1. Brazil
- 4.2. Argentina
- 4.3. Rest of South America
-
5. Middle East and Africa
- 5.1. Saudi Arabia
- 5.2. South Africa
- 5.3. Rest of Middle East and Africa
Athletic Shoe Industry Regional Market Share
Geographic Coverage of Athletic Shoe Industry
Athletic Shoe Industry REPORT HIGHLIGHTS
| Aspects | Details |
|---|---|
| Study Period | 2020-2034 |
| Base Year | 2025 |
| Estimated Year | 2026 |
| Forecast Period | 2026-2034 |
| Historical Period | 2020-2025 |
| Growth Rate | CAGR of 6.86% from 2020-2034 |
| Segmentation |
|
Table of Contents
- 1. Introduction
- 1.1. Research Scope
- 1.2. Market Segmentation
- 1.3. Research Objective
- 1.4. Definitions and Assumptions
- 2. Executive Summary
- 2.1. Market Snapshot
- 3. Market Dynamics
- 3.1. Market Drivers
- 3.2. Market Restrains
- 3.3. Market Trends
- 3.4. Market Opportunities
- 4. Market Factor Analysis
- 4.1. Porters Five Forces
- 4.1.1. Bargaining Power of Suppliers
- 4.1.2. Bargaining Power of Buyers
- 4.1.3. Threat of New Entrants
- 4.1.4. Threat of Substitutes
- 4.1.5. Competitive Rivalry
- 4.2. PESTEL analysis
- 4.3. BCG Analysis
- 4.3.1. Stars (High Growth, High Market Share)
- 4.3.2. Cash Cows (Low Growth, High Market Share)
- 4.3.3. Question Mark (High Growth, Low Market Share)
- 4.3.4. Dogs (Low Growth, Low Market Share)
- 4.4. Ansoff Matrix Analysis
- 4.5. Supply Chain Analysis
- 4.6. Regulatory Landscape
- 4.7. Current Market Potential and Opportunity Assessment (TAM–SAM–SOM Framework)
- 4.8. RAX Analyst Note
- 4.1. Porters Five Forces
- 5. Market Analysis, Insights and Forecast 2021-2033
- 5.1. Market Analysis, Insights and Forecast - by Product Type
- 5.1.1. Running Shoes
- 5.1.2. Sports Shoes
- 5.1.3. Trekking/Hiking Shoes
- 5.1.4. Other Product Types
- 5.2. Market Analysis, Insights and Forecast - by End User
- 5.2.1. Men
- 5.2.2. Women
- 5.2.3. Kids/Children
- 5.3. Market Analysis, Insights and Forecast - by Distribution Channel
- 5.3.1. Sports and Atheletic Goods Stores
- 5.3.2. Supermarkets/Hypermarkets
- 5.3.3. Online Retail Stores
- 5.3.4. Other Distribution Channels
- 5.4. Market Analysis, Insights and Forecast - by Region
- 5.4.1. North America
- 5.4.2. Europe
- 5.4.3. Asia Pacific
- 5.4.4. South America
- 5.4.5. Middle East and Africa
- 5.1. Market Analysis, Insights and Forecast - by Product Type
- 6. Global Athletic Shoe Industry Analysis, Insights and Forecast, 2021-2033
- 6.1. Market Analysis, Insights and Forecast - by Product Type
- 6.1.1. Running Shoes
- 6.1.2. Sports Shoes
- 6.1.3. Trekking/Hiking Shoes
- 6.1.4. Other Product Types
- 6.2. Market Analysis, Insights and Forecast - by End User
- 6.2.1. Men
- 6.2.2. Women
- 6.2.3. Kids/Children
- 6.3. Market Analysis, Insights and Forecast - by Distribution Channel
- 6.3.1. Sports and Atheletic Goods Stores
- 6.3.2. Supermarkets/Hypermarkets
- 6.3.3. Online Retail Stores
- 6.3.4. Other Distribution Channels
- 6.1. Market Analysis, Insights and Forecast - by Product Type
- 7. North America Athletic Shoe Industry Analysis, Insights and Forecast, 2020-2032
- 7.1. Market Analysis, Insights and Forecast - by Product Type
- 7.1.1. Running Shoes
- 7.1.2. Sports Shoes
- 7.1.3. Trekking/Hiking Shoes
- 7.1.4. Other Product Types
- 7.2. Market Analysis, Insights and Forecast - by End User
- 7.2.1. Men
- 7.2.2. Women
- 7.2.3. Kids/Children
- 7.3. Market Analysis, Insights and Forecast - by Distribution Channel
- 7.3.1. Sports and Atheletic Goods Stores
- 7.3.2. Supermarkets/Hypermarkets
- 7.3.3. Online Retail Stores
- 7.3.4. Other Distribution Channels
- 7.1. Market Analysis, Insights and Forecast - by Product Type
- 8. Europe Athletic Shoe Industry Analysis, Insights and Forecast, 2020-2032
- 8.1. Market Analysis, Insights and Forecast - by Product Type
- 8.1.1. Running Shoes
- 8.1.2. Sports Shoes
- 8.1.3. Trekking/Hiking Shoes
- 8.1.4. Other Product Types
- 8.2. Market Analysis, Insights and Forecast - by End User
- 8.2.1. Men
- 8.2.2. Women
- 8.2.3. Kids/Children
- 8.3. Market Analysis, Insights and Forecast - by Distribution Channel
- 8.3.1. Sports and Atheletic Goods Stores
- 8.3.2. Supermarkets/Hypermarkets
- 8.3.3. Online Retail Stores
- 8.3.4. Other Distribution Channels
- 8.1. Market Analysis, Insights and Forecast - by Product Type
- 9. Asia Pacific Athletic Shoe Industry Analysis, Insights and Forecast, 2020-2032
- 9.1. Market Analysis, Insights and Forecast - by Product Type
- 9.1.1. Running Shoes
- 9.1.2. Sports Shoes
- 9.1.3. Trekking/Hiking Shoes
- 9.1.4. Other Product Types
- 9.2. Market Analysis, Insights and Forecast - by End User
- 9.2.1. Men
- 9.2.2. Women
- 9.2.3. Kids/Children
- 9.3. Market Analysis, Insights and Forecast - by Distribution Channel
- 9.3.1. Sports and Atheletic Goods Stores
- 9.3.2. Supermarkets/Hypermarkets
- 9.3.3. Online Retail Stores
- 9.3.4. Other Distribution Channels
- 9.1. Market Analysis, Insights and Forecast - by Product Type
- 10. South America Athletic Shoe Industry Analysis, Insights and Forecast, 2020-2032
- 10.1. Market Analysis, Insights and Forecast - by Product Type
- 10.1.1. Running Shoes
- 10.1.2. Sports Shoes
- 10.1.3. Trekking/Hiking Shoes
- 10.1.4. Other Product Types
- 10.2. Market Analysis, Insights and Forecast - by End User
- 10.2.1. Men
- 10.2.2. Women
- 10.2.3. Kids/Children
- 10.3. Market Analysis, Insights and Forecast - by Distribution Channel
- 10.3.1. Sports and Atheletic Goods Stores
- 10.3.2. Supermarkets/Hypermarkets
- 10.3.3. Online Retail Stores
- 10.3.4. Other Distribution Channels
- 10.1. Market Analysis, Insights and Forecast - by Product Type
- 11. Middle East and Africa Athletic Shoe Industry Analysis, Insights and Forecast, 2020-2032
- 11.1. Market Analysis, Insights and Forecast - by Product Type
- 11.1.1. Running Shoes
- 11.1.2. Sports Shoes
- 11.1.3. Trekking/Hiking Shoes
- 11.1.4. Other Product Types
- 11.2. Market Analysis, Insights and Forecast - by End User
- 11.2.1. Men
- 11.2.2. Women
- 11.2.3. Kids/Children
- 11.3. Market Analysis, Insights and Forecast - by Distribution Channel
- 11.3.1. Sports and Atheletic Goods Stores
- 11.3.2. Supermarkets/Hypermarkets
- 11.3.3. Online Retail Stores
- 11.3.4. Other Distribution Channels
- 11.1. Market Analysis, Insights and Forecast - by Product Type
- 12. Competitive Analysis
- 12.1. Company Profiles
- 12.1.1 Adidas AG
- 12.1.1.1. Company Overview
- 12.1.1.2. Products
- 12.1.1.3. Company Financials
- 12.1.1.4. SWOT Analysis
- 12.1.2 Columbia Sportswear Company
- 12.1.2.1. Company Overview
- 12.1.2.2. Products
- 12.1.2.3. Company Financials
- 12.1.2.4. SWOT Analysis
- 12.1.3 VF Corporation
- 12.1.3.1. Company Overview
- 12.1.3.2. Products
- 12.1.3.3. Company Financials
- 12.1.3.4. SWOT Analysis
- 12.1.4 SKECHERS USA Inc
- 12.1.4.1. Company Overview
- 12.1.4.2. Products
- 12.1.4.3. Company Financials
- 12.1.4.4. SWOT Analysis
- 12.1.5 Asics Corporation
- 12.1.5.1. Company Overview
- 12.1.5.2. Products
- 12.1.5.3. Company Financials
- 12.1.5.4. SWOT Analysis
- 12.1.6 Puma SE
- 12.1.6.1. Company Overview
- 12.1.6.2. Products
- 12.1.6.3. Company Financials
- 12.1.6.4. SWOT Analysis
- 12.1.7 Under Armour Inc
- 12.1.7.1. Company Overview
- 12.1.7.2. Products
- 12.1.7.3. Company Financials
- 12.1.7.4. SWOT Analysis
- 12.1.8 Nike Inc
- 12.1.8.1. Company Overview
- 12.1.8.2. Products
- 12.1.8.3. Company Financials
- 12.1.8.4. SWOT Analysis
- 12.1.9 New Balance Athletics Inc
- 12.1.9.1. Company Overview
- 12.1.9.2. Products
- 12.1.9.3. Company Financials
- 12.1.9.4. SWOT Analysis
- 12.1.10 Fila
- 12.1.10.1. Company Overview
- 12.1.10.2. Products
- 12.1.10.3. Company Financials
- 12.1.10.4. SWOT Analysis
- 12.1.1 Adidas AG
- 12.2. Market Entropy
- 12.2.1 Company's Key Areas Served
- 12.2.2 Recent Developments
- 12.3. Company Market Share Analysis 2025
- 12.3.1 Top 5 Companies Market Share Analysis
- 12.3.2 Top 3 Companies Market Share Analysis
- 12.4. List of Potential Customers
- 13. Research Methodology
List of Figures
- Figure 1: Global Athletic Shoe Industry Revenue Breakdown (Million, %) by Region 2025 & 2033
- Figure 2: Global Athletic Shoe Industry Volume Breakdown (K Units, %) by Region 2025 & 2033
- Figure 3: North America Athletic Shoe Industry Revenue (Million), by Product Type 2025 & 2033
- Figure 4: North America Athletic Shoe Industry Volume (K Units), by Product Type 2025 & 2033
- Figure 5: North America Athletic Shoe Industry Revenue Share (%), by Product Type 2025 & 2033
- Figure 6: North America Athletic Shoe Industry Volume Share (%), by Product Type 2025 & 2033
- Figure 7: North America Athletic Shoe Industry Revenue (Million), by End User 2025 & 2033
- Figure 8: North America Athletic Shoe Industry Volume (K Units), by End User 2025 & 2033
- Figure 9: North America Athletic Shoe Industry Revenue Share (%), by End User 2025 & 2033
- Figure 10: North America Athletic Shoe Industry Volume Share (%), by End User 2025 & 2033
- Figure 11: North America Athletic Shoe Industry Revenue (Million), by Distribution Channel 2025 & 2033
- Figure 12: North America Athletic Shoe Industry Volume (K Units), by Distribution Channel 2025 & 2033
- Figure 13: North America Athletic Shoe Industry Revenue Share (%), by Distribution Channel 2025 & 2033
- Figure 14: North America Athletic Shoe Industry Volume Share (%), by Distribution Channel 2025 & 2033
- Figure 15: North America Athletic Shoe Industry Revenue (Million), by Country 2025 & 2033
- Figure 16: North America Athletic Shoe Industry Volume (K Units), by Country 2025 & 2033
- Figure 17: North America Athletic Shoe Industry Revenue Share (%), by Country 2025 & 2033
- Figure 18: North America Athletic Shoe Industry Volume Share (%), by Country 2025 & 2033
- Figure 19: Europe Athletic Shoe Industry Revenue (Million), by Product Type 2025 & 2033
- Figure 20: Europe Athletic Shoe Industry Volume (K Units), by Product Type 2025 & 2033
- Figure 21: Europe Athletic Shoe Industry Revenue Share (%), by Product Type 2025 & 2033
- Figure 22: Europe Athletic Shoe Industry Volume Share (%), by Product Type 2025 & 2033
- Figure 23: Europe Athletic Shoe Industry Revenue (Million), by End User 2025 & 2033
- Figure 24: Europe Athletic Shoe Industry Volume (K Units), by End User 2025 & 2033
- Figure 25: Europe Athletic Shoe Industry Revenue Share (%), by End User 2025 & 2033
- Figure 26: Europe Athletic Shoe Industry Volume Share (%), by End User 2025 & 2033
- Figure 27: Europe Athletic Shoe Industry Revenue (Million), by Distribution Channel 2025 & 2033
- Figure 28: Europe Athletic Shoe Industry Volume (K Units), by Distribution Channel 2025 & 2033
- Figure 29: Europe Athletic Shoe Industry Revenue Share (%), by Distribution Channel 2025 & 2033
- Figure 30: Europe Athletic Shoe Industry Volume Share (%), by Distribution Channel 2025 & 2033
- Figure 31: Europe Athletic Shoe Industry Revenue (Million), by Country 2025 & 2033
- Figure 32: Europe Athletic Shoe Industry Volume (K Units), by Country 2025 & 2033
- Figure 33: Europe Athletic Shoe Industry Revenue Share (%), by Country 2025 & 2033
- Figure 34: Europe Athletic Shoe Industry Volume Share (%), by Country 2025 & 2033
- Figure 35: Asia Pacific Athletic Shoe Industry Revenue (Million), by Product Type 2025 & 2033
- Figure 36: Asia Pacific Athletic Shoe Industry Volume (K Units), by Product Type 2025 & 2033
- Figure 37: Asia Pacific Athletic Shoe Industry Revenue Share (%), by Product Type 2025 & 2033
- Figure 38: Asia Pacific Athletic Shoe Industry Volume Share (%), by Product Type 2025 & 2033
- Figure 39: Asia Pacific Athletic Shoe Industry Revenue (Million), by End User 2025 & 2033
- Figure 40: Asia Pacific Athletic Shoe Industry Volume (K Units), by End User 2025 & 2033
- Figure 41: Asia Pacific Athletic Shoe Industry Revenue Share (%), by End User 2025 & 2033
- Figure 42: Asia Pacific Athletic Shoe Industry Volume Share (%), by End User 2025 & 2033
- Figure 43: Asia Pacific Athletic Shoe Industry Revenue (Million), by Distribution Channel 2025 & 2033
- Figure 44: Asia Pacific Athletic Shoe Industry Volume (K Units), by Distribution Channel 2025 & 2033
- Figure 45: Asia Pacific Athletic Shoe Industry Revenue Share (%), by Distribution Channel 2025 & 2033
- Figure 46: Asia Pacific Athletic Shoe Industry Volume Share (%), by Distribution Channel 2025 & 2033
- Figure 47: Asia Pacific Athletic Shoe Industry Revenue (Million), by Country 2025 & 2033
- Figure 48: Asia Pacific Athletic Shoe Industry Volume (K Units), by Country 2025 & 2033
- Figure 49: Asia Pacific Athletic Shoe Industry Revenue Share (%), by Country 2025 & 2033
- Figure 50: Asia Pacific Athletic Shoe Industry Volume Share (%), by Country 2025 & 2033
- Figure 51: South America Athletic Shoe Industry Revenue (Million), by Product Type 2025 & 2033
- Figure 52: South America Athletic Shoe Industry Volume (K Units), by Product Type 2025 & 2033
- Figure 53: South America Athletic Shoe Industry Revenue Share (%), by Product Type 2025 & 2033
- Figure 54: South America Athletic Shoe Industry Volume Share (%), by Product Type 2025 & 2033
- Figure 55: South America Athletic Shoe Industry Revenue (Million), by End User 2025 & 2033
- Figure 56: South America Athletic Shoe Industry Volume (K Units), by End User 2025 & 2033
- Figure 57: South America Athletic Shoe Industry Revenue Share (%), by End User 2025 & 2033
- Figure 58: South America Athletic Shoe Industry Volume Share (%), by End User 2025 & 2033
- Figure 59: South America Athletic Shoe Industry Revenue (Million), by Distribution Channel 2025 & 2033
- Figure 60: South America Athletic Shoe Industry Volume (K Units), by Distribution Channel 2025 & 2033
- Figure 61: South America Athletic Shoe Industry Revenue Share (%), by Distribution Channel 2025 & 2033
- Figure 62: South America Athletic Shoe Industry Volume Share (%), by Distribution Channel 2025 & 2033
- Figure 63: South America Athletic Shoe Industry Revenue (Million), by Country 2025 & 2033
- Figure 64: South America Athletic Shoe Industry Volume (K Units), by Country 2025 & 2033
- Figure 65: South America Athletic Shoe Industry Revenue Share (%), by Country 2025 & 2033
- Figure 66: South America Athletic Shoe Industry Volume Share (%), by Country 2025 & 2033
- Figure 67: Middle East and Africa Athletic Shoe Industry Revenue (Million), by Product Type 2025 & 2033
- Figure 68: Middle East and Africa Athletic Shoe Industry Volume (K Units), by Product Type 2025 & 2033
- Figure 69: Middle East and Africa Athletic Shoe Industry Revenue Share (%), by Product Type 2025 & 2033
- Figure 70: Middle East and Africa Athletic Shoe Industry Volume Share (%), by Product Type 2025 & 2033
- Figure 71: Middle East and Africa Athletic Shoe Industry Revenue (Million), by End User 2025 & 2033
- Figure 72: Middle East and Africa Athletic Shoe Industry Volume (K Units), by End User 2025 & 2033
- Figure 73: Middle East and Africa Athletic Shoe Industry Revenue Share (%), by End User 2025 & 2033
- Figure 74: Middle East and Africa Athletic Shoe Industry Volume Share (%), by End User 2025 & 2033
- Figure 75: Middle East and Africa Athletic Shoe Industry Revenue (Million), by Distribution Channel 2025 & 2033
- Figure 76: Middle East and Africa Athletic Shoe Industry Volume (K Units), by Distribution Channel 2025 & 2033
- Figure 77: Middle East and Africa Athletic Shoe Industry Revenue Share (%), by Distribution Channel 2025 & 2033
- Figure 78: Middle East and Africa Athletic Shoe Industry Volume Share (%), by Distribution Channel 2025 & 2033
- Figure 79: Middle East and Africa Athletic Shoe Industry Revenue (Million), by Country 2025 & 2033
- Figure 80: Middle East and Africa Athletic Shoe Industry Volume (K Units), by Country 2025 & 2033
- Figure 81: Middle East and Africa Athletic Shoe Industry Revenue Share (%), by Country 2025 & 2033
- Figure 82: Middle East and Africa Athletic Shoe Industry Volume Share (%), by Country 2025 & 2033
List of Tables
- Table 1: Global Athletic Shoe Industry Revenue Million Forecast, by Product Type 2020 & 2033
- Table 2: Global Athletic Shoe Industry Volume K Units Forecast, by Product Type 2020 & 2033
- Table 3: Global Athletic Shoe Industry Revenue Million Forecast, by End User 2020 & 2033
- Table 4: Global Athletic Shoe Industry Volume K Units Forecast, by End User 2020 & 2033
- Table 5: Global Athletic Shoe Industry Revenue Million Forecast, by Distribution Channel 2020 & 2033
- Table 6: Global Athletic Shoe Industry Volume K Units Forecast, by Distribution Channel 2020 & 2033
- Table 7: Global Athletic Shoe Industry Revenue Million Forecast, by Region 2020 & 2033
- Table 8: Global Athletic Shoe Industry Volume K Units Forecast, by Region 2020 & 2033
- Table 9: Global Athletic Shoe Industry Revenue Million Forecast, by Product Type 2020 & 2033
- Table 10: Global Athletic Shoe Industry Volume K Units Forecast, by Product Type 2020 & 2033
- Table 11: Global Athletic Shoe Industry Revenue Million Forecast, by End User 2020 & 2033
- Table 12: Global Athletic Shoe Industry Volume K Units Forecast, by End User 2020 & 2033
- Table 13: Global Athletic Shoe Industry Revenue Million Forecast, by Distribution Channel 2020 & 2033
- Table 14: Global Athletic Shoe Industry Volume K Units Forecast, by Distribution Channel 2020 & 2033
- Table 15: Global Athletic Shoe Industry Revenue Million Forecast, by Country 2020 & 2033
- Table 16: Global Athletic Shoe Industry Volume K Units Forecast, by Country 2020 & 2033
- Table 17: United States Athletic Shoe Industry Revenue (Million) Forecast, by Application 2020 & 2033
- Table 18: United States Athletic Shoe Industry Volume (K Units) Forecast, by Application 2020 & 2033
- Table 19: Canada Athletic Shoe Industry Revenue (Million) Forecast, by Application 2020 & 2033
- Table 20: Canada Athletic Shoe Industry Volume (K Units) Forecast, by Application 2020 & 2033
- Table 21: Mexico Athletic Shoe Industry Revenue (Million) Forecast, by Application 2020 & 2033
- Table 22: Mexico Athletic Shoe Industry Volume (K Units) Forecast, by Application 2020 & 2033
- Table 23: Rest of North America Athletic Shoe Industry Revenue (Million) Forecast, by Application 2020 & 2033
- Table 24: Rest of North America Athletic Shoe Industry Volume (K Units) Forecast, by Application 2020 & 2033
- Table 25: Global Athletic Shoe Industry Revenue Million Forecast, by Product Type 2020 & 2033
- Table 26: Global Athletic Shoe Industry Volume K Units Forecast, by Product Type 2020 & 2033
- Table 27: Global Athletic Shoe Industry Revenue Million Forecast, by End User 2020 & 2033
- Table 28: Global Athletic Shoe Industry Volume K Units Forecast, by End User 2020 & 2033
- Table 29: Global Athletic Shoe Industry Revenue Million Forecast, by Distribution Channel 2020 & 2033
- Table 30: Global Athletic Shoe Industry Volume K Units Forecast, by Distribution Channel 2020 & 2033
- Table 31: Global Athletic Shoe Industry Revenue Million Forecast, by Country 2020 & 2033
- Table 32: Global Athletic Shoe Industry Volume K Units Forecast, by Country 2020 & 2033
- Table 33: United Kingdom Athletic Shoe Industry Revenue (Million) Forecast, by Application 2020 & 2033
- Table 34: United Kingdom Athletic Shoe Industry Volume (K Units) Forecast, by Application 2020 & 2033
- Table 35: Germany Athletic Shoe Industry Revenue (Million) Forecast, by Application 2020 & 2033
- Table 36: Germany Athletic Shoe Industry Volume (K Units) Forecast, by Application 2020 & 2033
- Table 37: Spain Athletic Shoe Industry Revenue (Million) Forecast, by Application 2020 & 2033
- Table 38: Spain Athletic Shoe Industry Volume (K Units) Forecast, by Application 2020 & 2033
- Table 39: France Athletic Shoe Industry Revenue (Million) Forecast, by Application 2020 & 2033
- Table 40: France Athletic Shoe Industry Volume (K Units) Forecast, by Application 2020 & 2033
- Table 41: Italy Athletic Shoe Industry Revenue (Million) Forecast, by Application 2020 & 2033
- Table 42: Italy Athletic Shoe Industry Volume (K Units) Forecast, by Application 2020 & 2033
- Table 43: Netherlands Athletic Shoe Industry Revenue (Million) Forecast, by Application 2020 & 2033
- Table 44: Netherlands Athletic Shoe Industry Volume (K Units) Forecast, by Application 2020 & 2033
- Table 45: Rest of Europe Athletic Shoe Industry Revenue (Million) Forecast, by Application 2020 & 2033
- Table 46: Rest of Europe Athletic Shoe Industry Volume (K Units) Forecast, by Application 2020 & 2033
- Table 47: Global Athletic Shoe Industry Revenue Million Forecast, by Product Type 2020 & 2033
- Table 48: Global Athletic Shoe Industry Volume K Units Forecast, by Product Type 2020 & 2033
- Table 49: Global Athletic Shoe Industry Revenue Million Forecast, by End User 2020 & 2033
- Table 50: Global Athletic Shoe Industry Volume K Units Forecast, by End User 2020 & 2033
- Table 51: Global Athletic Shoe Industry Revenue Million Forecast, by Distribution Channel 2020 & 2033
- Table 52: Global Athletic Shoe Industry Volume K Units Forecast, by Distribution Channel 2020 & 2033
- Table 53: Global Athletic Shoe Industry Revenue Million Forecast, by Country 2020 & 2033
- Table 54: Global Athletic Shoe Industry Volume K Units Forecast, by Country 2020 & 2033
- Table 55: China Athletic Shoe Industry Revenue (Million) Forecast, by Application 2020 & 2033
- Table 56: China Athletic Shoe Industry Volume (K Units) Forecast, by Application 2020 & 2033
- Table 57: Japan Athletic Shoe Industry Revenue (Million) Forecast, by Application 2020 & 2033
- Table 58: Japan Athletic Shoe Industry Volume (K Units) Forecast, by Application 2020 & 2033
- Table 59: India Athletic Shoe Industry Revenue (Million) Forecast, by Application 2020 & 2033
- Table 60: India Athletic Shoe Industry Volume (K Units) Forecast, by Application 2020 & 2033
- Table 61: Australia Athletic Shoe Industry Revenue (Million) Forecast, by Application 2020 & 2033
- Table 62: Australia Athletic Shoe Industry Volume (K Units) Forecast, by Application 2020 & 2033
- Table 63: Rest of Asia Pacific Athletic Shoe Industry Revenue (Million) Forecast, by Application 2020 & 2033
- Table 64: Rest of Asia Pacific Athletic Shoe Industry Volume (K Units) Forecast, by Application 2020 & 2033
- Table 65: Global Athletic Shoe Industry Revenue Million Forecast, by Product Type 2020 & 2033
- Table 66: Global Athletic Shoe Industry Volume K Units Forecast, by Product Type 2020 & 2033
- Table 67: Global Athletic Shoe Industry Revenue Million Forecast, by End User 2020 & 2033
- Table 68: Global Athletic Shoe Industry Volume K Units Forecast, by End User 2020 & 2033
- Table 69: Global Athletic Shoe Industry Revenue Million Forecast, by Distribution Channel 2020 & 2033
- Table 70: Global Athletic Shoe Industry Volume K Units Forecast, by Distribution Channel 2020 & 2033
- Table 71: Global Athletic Shoe Industry Revenue Million Forecast, by Country 2020 & 2033
- Table 72: Global Athletic Shoe Industry Volume K Units Forecast, by Country 2020 & 2033
- Table 73: Brazil Athletic Shoe Industry Revenue (Million) Forecast, by Application 2020 & 2033
- Table 74: Brazil Athletic Shoe Industry Volume (K Units) Forecast, by Application 2020 & 2033
- Table 75: Argentina Athletic Shoe Industry Revenue (Million) Forecast, by Application 2020 & 2033
- Table 76: Argentina Athletic Shoe Industry Volume (K Units) Forecast, by Application 2020 & 2033
- Table 77: Rest of South America Athletic Shoe Industry Revenue (Million) Forecast, by Application 2020 & 2033
- Table 78: Rest of South America Athletic Shoe Industry Volume (K Units) Forecast, by Application 2020 & 2033
- Table 79: Global Athletic Shoe Industry Revenue Million Forecast, by Product Type 2020 & 2033
- Table 80: Global Athletic Shoe Industry Volume K Units Forecast, by Product Type 2020 & 2033
- Table 81: Global Athletic Shoe Industry Revenue Million Forecast, by End User 2020 & 2033
- Table 82: Global Athletic Shoe Industry Volume K Units Forecast, by End User 2020 & 2033
- Table 83: Global Athletic Shoe Industry Revenue Million Forecast, by Distribution Channel 2020 & 2033
- Table 84: Global Athletic Shoe Industry Volume K Units Forecast, by Distribution Channel 2020 & 2033
- Table 85: Global Athletic Shoe Industry Revenue Million Forecast, by Country 2020 & 2033
- Table 86: Global Athletic Shoe Industry Volume K Units Forecast, by Country 2020 & 2033
- Table 87: Saudi Arabia Athletic Shoe Industry Revenue (Million) Forecast, by Application 2020 & 2033
- Table 88: Saudi Arabia Athletic Shoe Industry Volume (K Units) Forecast, by Application 2020 & 2033
- Table 89: South Africa Athletic Shoe Industry Revenue (Million) Forecast, by Application 2020 & 2033
- Table 90: South Africa Athletic Shoe Industry Volume (K Units) Forecast, by Application 2020 & 2033
- Table 91: Rest of Middle East and Africa Athletic Shoe Industry Revenue (Million) Forecast, by Application 2020 & 2033
- Table 92: Rest of Middle East and Africa Athletic Shoe Industry Volume (K Units) Forecast, by Application 2020 & 2033
Frequently Asked Questions
1. What is the projected Compound Annual Growth Rate (CAGR) of the Athletic Shoe Industry?
The projected CAGR is approximately 6.86%.
2. Which companies are prominent players in the Athletic Shoe Industry?
Key companies in the market include Adidas AG, Columbia Sportswear Company, VF Corporation, SKECHERS USA Inc, Asics Corporation, Puma SE, Under Armour Inc, Nike Inc, New Balance Athletics Inc, Fila.
3. What are the main segments of the Athletic Shoe Industry?
The market segments include Product Type, End User, Distribution Channel.
4. Can you provide details about the market size?
The market size is estimated to be USD 173.89 Million as of 2022.
5. What are some drivers contributing to market growth?
Aggressive Marketing And Strategies By Brands; Enhanced Participation In Recreational And Outdoor/Sports Activities.
6. What are the notable trends driving market growth?
Growing Sports Participation and Influence of Athleisure.
7. Are there any restraints impacting market growth?
Unorganized Footwear Sector And Availability Of Counterfeit Goods.
8. Can you provide examples of recent developments in the market?
June 2024: Nike launched the Converse Run Star Trainer, a low-profile shoe built from the ground up, combining retro and modern aesthetics. The silhouette is inspired by Converse’s deep history in sport but designed for modern life.
9. What pricing options are available for accessing the report?
Pricing options include single-user, multi-user, and enterprise licenses priced at USD 4750, USD 5250, and USD 8750 respectively.
10. Is the market size provided in terms of value or volume?
The market size is provided in terms of value, measured in Million and volume, measured in K Units.
11. Are there any specific market keywords associated with the report?
Yes, the market keyword associated with the report is "Athletic Shoe Industry," which aids in identifying and referencing the specific market segment covered.
12. How do I determine which pricing option suits my needs best?
The pricing options vary based on user requirements and access needs. Individual users may opt for single-user licenses, while businesses requiring broader access may choose multi-user or enterprise licenses for cost-effective access to the report.
13. Are there any additional resources or data provided in the Athletic Shoe Industry report?
While the report offers comprehensive insights, it's advisable to review the specific contents or supplementary materials provided to ascertain if additional resources or data are available.
14. How can I stay updated on further developments or reports in the Athletic Shoe Industry?
To stay informed about further developments, trends, and reports in the Athletic Shoe Industry, consider subscribing to industry newsletters, following relevant companies and organizations, or regularly checking reputable industry news sources and publications.
Methodology
Step 1 - Identification of Relevant Samples Size from Population Database


Step 2 - Approaches for Defining Global Market Size (Value, Volume* & Price*)

Note*: In applicable scenarios
Step 3 - Data Sources
Primary Research
- Web Analytics
- Survey Reports
- Research Institute
- Latest Research Reports
- Opinion Leaders
Secondary Research
- Annual Reports
- White Paper
- Latest Press Release
- Industry Association
- Paid Database
- Investor Presentations

Step 4 - Data Triangulation
Involves using different sources of information in order to increase the validity of a study
These sources are likely to be stakeholders in a program - participants, other researchers, program staff, other community members, and so on.
Then we put all data in single framework & apply various statistical tools to find out the dynamic on the market.
During the analysis stage, feedback from the stakeholder groups would be compared to determine areas of agreement as well as areas of divergence