
Key Insights
The Australia & New Zealand medical imaging services market presents a robust growth opportunity, projected to expand significantly over the forecast period (2025-2033). Driven by factors such as an aging population leading to increased prevalence of chronic diseases requiring imaging diagnostics, technological advancements in imaging modalities (like MRI and CT scans offering improved resolution and speed), and rising government investments in healthcare infrastructure, the market is poised for considerable expansion. The increasing adoption of minimally invasive procedures also contributes to the demand for advanced imaging techniques for accurate diagnosis and treatment planning. Market segmentation reveals strong performance across various applications, with cardiology, oncology, and neurology leading the way due to the high incidence of related diseases. Hospitals and diagnostic centers constitute the major end-users, reflecting the centralized nature of medical imaging services delivery. While the market faces potential restraints, such as high equipment costs and skilled personnel shortages, the overall positive trajectory remains strong, particularly considering the ongoing technological innovation and improved access to healthcare services within the region.
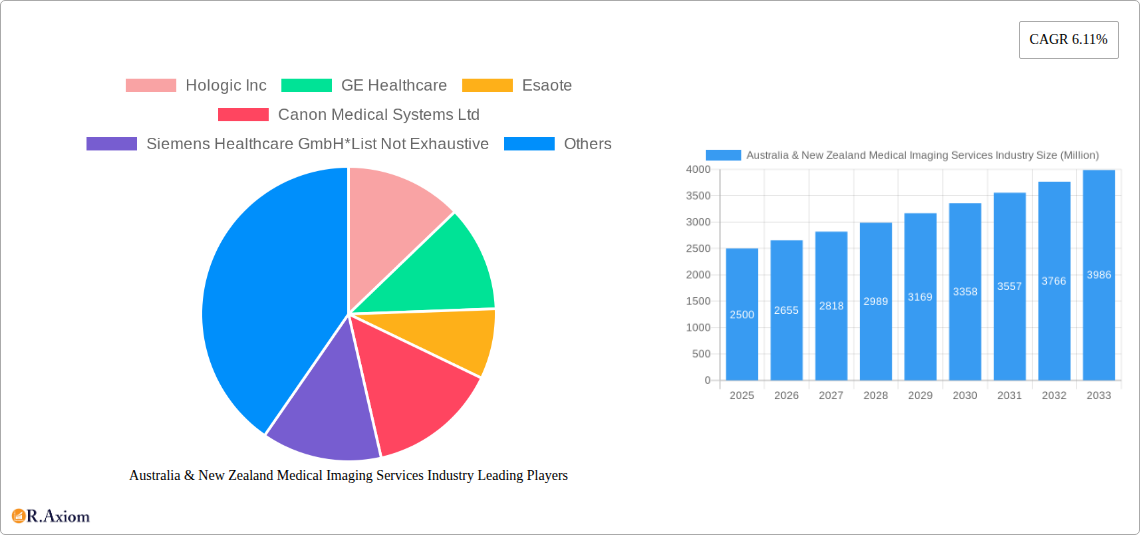
The market's growth is further fueled by the rising adoption of tele-radiology and AI-driven image analysis, streamlining workflows and improving diagnostic accuracy. Specific growth within segments is anticipated to vary. For instance, the demand for advanced modalities like MRI and CT is expected to outpace that of conventional X-ray, reflecting the ongoing shift towards higher-resolution imaging techniques. Competition among established players like Hologic Inc., GE Healthcare, and Siemens Healthcare GmbH, along with the emergence of new technological solutions, will shape the market landscape. Furthermore, government initiatives promoting early disease detection and preventive healthcare are likely to further stimulate market growth. The geographical concentration of the market within major urban centers presents both opportunity and challenge, necessitating targeted strategies to ensure equitable access to quality imaging services across the region. The forecast period suggests continued expansion, highlighting the significant investment and growth potential within the Australia & New Zealand medical imaging services sector.
This comprehensive report provides a detailed analysis of the Australia & New Zealand medical imaging services industry, offering invaluable insights for stakeholders including investors, industry professionals, and researchers. Covering the period 2019-2033, with a focus on 2025, this report meticulously examines market trends, segment performance, competitive dynamics, and future growth opportunities.
Australia & New Zealand Medical Imaging Services Industry Market Concentration & Innovation
The Australian and New Zealand medical imaging services market exhibits moderate concentration, with several multinational corporations holding significant market share. Key players include Hologic Inc, GE Healthcare, Esaote, Canon Medical Systems Ltd, Siemens Healthcare GmbH, Carestream Health, Koninklijke Philips NV, and Fujifilm Holdings Corporation. However, the market also accommodates numerous smaller, specialized providers. Precise market share data for each company is proprietary and varies by modality and region, estimated to range from 5% to 20% for major players in 2025.
Innovation is driven by advancements in imaging technology, particularly AI-powered diagnostic tools and portable imaging systems. Regulatory frameworks, primarily overseen by TGA (Australia) and Medsafe (New Zealand), play a crucial role in ensuring safety and efficacy. The market witnesses continuous introduction of new modalities and enhanced features in existing systems creating substitutability. The increasing adoption of telehealth and remote monitoring is impacting end-user trends, favoring solutions enabling remote diagnostics and consultations. While significant M&A activity has not been observed recently (xx Million in deal value in the past 5 years), smaller acquisitions and partnerships are common, driving consolidation and technological advancements.
- Market Concentration: Moderate, with several large players dominating specific segments.
- Innovation Drivers: AI integration, portable imaging, improved image quality.
- Regulatory Landscape: TGA (Australia) and Medsafe (New Zealand) govern safety and efficacy.
- M&A Activity: Relatively low, primarily focused on smaller acquisitions and partnerships (xx Million in total deal value between 2019-2024).
Australia & New Zealand Medical Imaging Services Industry Industry Trends & Insights
The Australian and New Zealand medical imaging services market is experiencing robust growth, driven by several factors. An aging population, rising prevalence of chronic diseases (cardiovascular disease, cancer), and increased healthcare expenditure fuel demand. Technological advancements, especially in AI-assisted diagnostics and minimally invasive procedures, significantly enhance imaging accuracy and efficiency. The increasing adoption of advanced imaging techniques like MRI and CT scans contributes to market expansion.
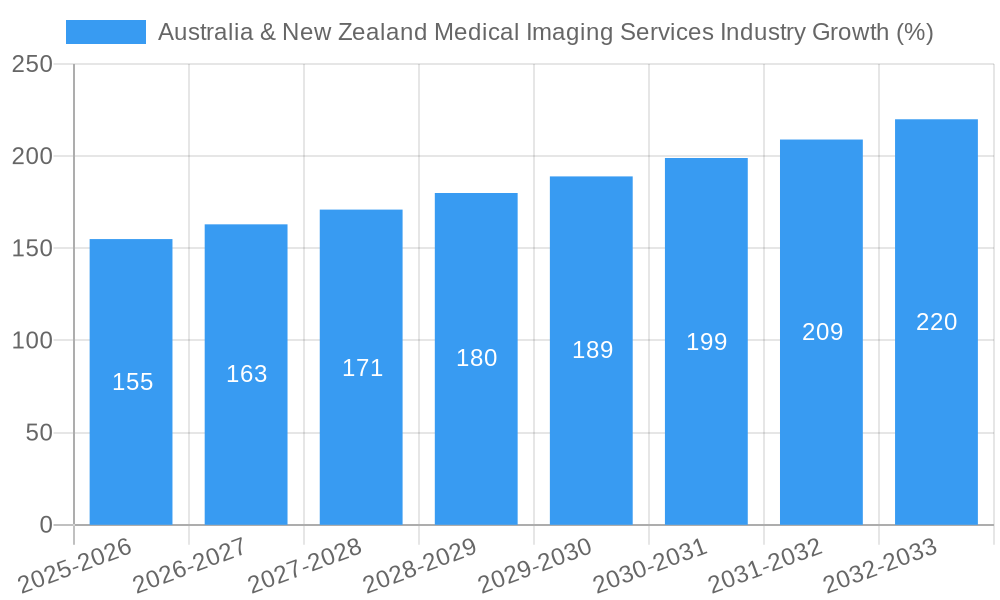
Consumer preferences are shifting towards more convenient, faster, and less invasive diagnostic procedures. The competitive landscape is dynamic, with existing players constantly innovating and new entrants emerging with specialized offerings. The market is projected to experience a Compound Annual Growth Rate (CAGR) of xx% during the forecast period (2025-2033), with market penetration of advanced imaging modalities steadily increasing, reaching an estimated xx% by 2033.
Dominant Markets & Segments in Australia & New Zealand Medical Imaging Services Industry
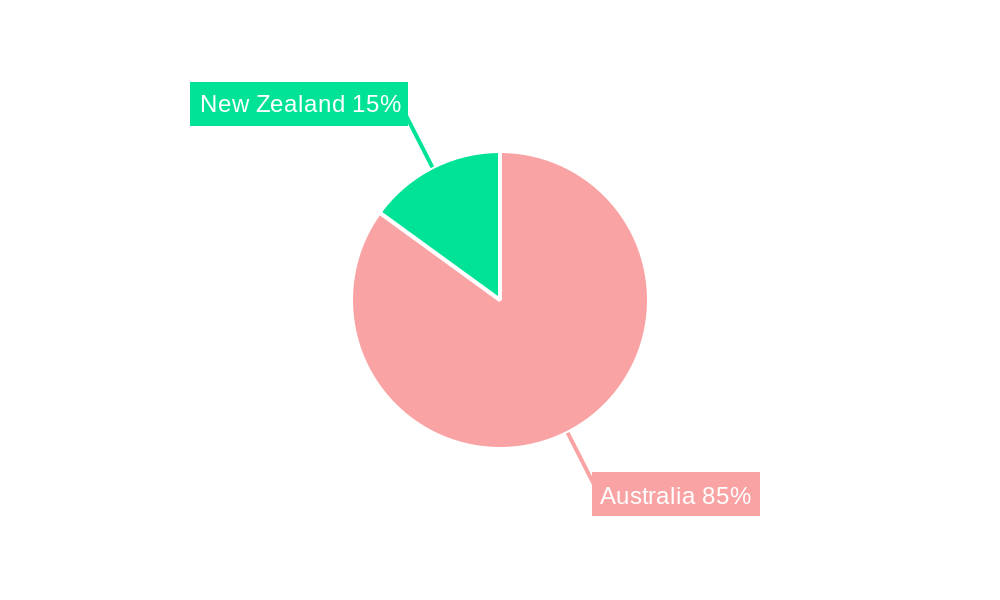
Australia accounts for a larger share of the overall market compared to New Zealand due to its larger population and higher healthcare expenditure.
By Application: Cardiology, Oncology, and Neurology represent the largest segments, driven by high prevalence rates and technological advancements in these areas.
- Cardiology: Growing due to increasing prevalence of heart diseases and advanced imaging techniques.
- Oncology: Fueled by increased cancer incidence and the need for precise diagnostics and treatment planning.
- Neurology: Driven by improved diagnostic capabilities for neurological disorders and growing awareness.
By End User: Hospitals constitute the largest end-user segment, followed by diagnostic centers.
- Hospitals: Dominant due to comprehensive services and established infrastructure.
- Diagnostic Centers: Growing due to specialized services and increasing demand for quicker diagnostic turnaround times.
By Modality: Computed Tomography (CT) and Ultrasound currently dominate the market due to widespread availability, relatively low cost, and broad applications. MRI and Nuclear Imaging segments are experiencing strong growth driven by technological improvements and expanding applications.
- CT & Ultrasound: High market share due to cost-effectiveness and widespread application.
- MRI & Nuclear Imaging: Strong growth potential due to technological advancements and increased utilization.
Key drivers for dominance include government healthcare policies favoring technological upgrades, increasing investment in healthcare infrastructure, and strong private healthcare sectors.
Australia & New Zealand Medical Imaging Services Industry Product Developments
Recent product innovations are focused on AI-powered image analysis, portable imaging systems, and enhanced image resolution. These developments aim to improve diagnostic accuracy, reduce procedure time, and enhance patient comfort. Companies are emphasizing developing solutions that address unmet clinical needs, integrating AI for faster analysis, improving image quality for greater diagnostic certainty, and focusing on user-friendly interfaces. The market fit for these innovations is strong, given the industry’s growing demand for faster, more accurate, and accessible diagnostic solutions.
Report Scope & Segmentation Analysis
This report segments the Australia & New Zealand medical imaging services market by application (Cardiology, Oncology, Neurology, Orthopedics, Gastroenterology, Gynecology, Other Applications), end-user (Hospital, Diagnostic Centers, Others), and modality (MRI, Computed Tomography, Ultrasound, X-ray, Nuclear Imaging, Fluoroscopy, Mamography). Each segment’s growth projections, market size (in Millions), and competitive dynamics are analyzed in detail. Market sizes for each segment are not available due to market sensitivity. It's expected that these values will fluctuate year over year. For detailed data please refer to the full report.
Key Drivers of Australia & New Zealand Medical Imaging Services Industry Growth
Several key factors are propelling the growth of the Australian and New Zealand medical imaging services market:
- Technological advancements: AI-powered diagnostics, portable imaging, and enhanced image resolution are driving adoption.
- Aging population: An increasing elderly population necessitates more frequent imaging procedures.
- Rising prevalence of chronic diseases: The increasing incidence of cardiovascular diseases and cancer drives demand for diagnostic imaging.
- Government initiatives: Government funding and healthcare policies supporting technology upgrades are fostering market growth.
Challenges in the Australia & New Zealand Medical Imaging Services Industry Sector
Despite its growth potential, the market faces certain challenges:
- High cost of equipment and maintenance: The acquisition and upkeep of advanced imaging equipment require substantial investment.
- Regulatory hurdles: Stringent regulatory approvals and compliance requirements can slow down product launches.
- Skilled personnel shortage: A shortage of trained radiologists and technicians can hinder service delivery.
- Reimbursement policies: Variations in insurance reimbursement policies affect affordability and market access.
Emerging Opportunities in Australia & New Zealand Medical Imaging Services Industry
Several promising opportunities exist within the market:
- Tele-radiology: Remote diagnostics and consultations offer greater access to specialist services, especially in remote areas.
- AI-powered diagnostic tools: Increasing accuracy and efficiency in image analysis enhances diagnostic capabilities.
- Portable imaging systems: Expanding access to imaging services in remote and underserved areas.
- Personalized medicine: Tailoring imaging strategies to individual patient needs improves care quality.
Leading Players in the Australia & New Zealand Medical Imaging Services Industry Market
- Hologic Inc
- GE Healthcare
- Esaote
- Canon Medical Systems Ltd
- Siemens Healthcare GmbH
- Carestream Health
- Koninklijke Philips NV
- Fujifilm Holdings Corporation
Key Developments in Australia & New Zealand Medical Imaging Services Industry Industry
- May 2022: EMVision (Australia) developed portable brain imaging technology.
- May 2022: Toku Eyes (New Zealand) unveiled AI-powered heart risk assessment technology using retinal scans.
Strategic Outlook for Australia & New Zealand Medical Imaging Services Industry Market
The Australian and New Zealand medical imaging services market is poised for continued growth driven by technological innovations, increasing healthcare expenditure, and the rising prevalence of chronic diseases. Opportunities exist in AI-powered diagnostics, tele-radiology, and portable imaging systems. Companies that embrace technological advancements, adapt to evolving regulatory landscapes, and focus on providing cost-effective and accessible solutions are expected to thrive in this dynamic market. The market's future potential remains substantial, promising significant returns for companies strategically positioned to capitalize on the emerging trends.
Australia & New Zealand Medical Imaging Services Industry Segmentation
-
1. Modality
- 1.1. MRI
- 1.2. Computed Tomography
- 1.3. Ultrasound
- 1.4. X-ray
- 1.5. Nuclear Imaging
- 1.6. Fluoroscopy
- 1.7. Mamography
-
2. Application
- 2.1. Cardiology
- 2.2. Oncology
- 2.3. Neurology
- 2.4. Orthopedics
- 2.5. Gastroenterology
- 2.6. Gynecology
- 2.7. Other Applications
-
3. End User
- 3.1. Hospital
- 3.2. Diagnostic Centers
- 3.3. Others
Australia & New Zealand Medical Imaging Services Industry Segmentation By Geography
- 1. Australia
Australia & New Zealand Medical Imaging Services Industry REPORT HIGHLIGHTS
| Aspects | Details |
|---|---|
| Study Period | 2019-2033 |
| Base Year | 2024 |
| Estimated Year | 2025 |
| Forecast Period | 2025-2033 |
| Historical Period | 2019-2024 |
| Growth Rate | CAGR of 6.11% from 2019-2033 |
| Segmentation |
|
Table of Contents
- 1. Introduction
- 1.1. Research Scope
- 1.2. Market Segmentation
- 1.3. Research Methodology
- 1.4. Definitions and Assumptions
- 2. Executive Summary
- 2.1. Introduction
- 3. Market Dynamics
- 3.1. Introduction
- 3.2. Market Drivers
- 3.2.1. Technological Advancements; Growth Burden of Chronic Diseases
- 3.3. Market Restrains
- 3.3.1. High Cost of Advanced Diagnostic Imaging Devices
- 3.4. Market Trends
- 3.4.1. X-ray Segment Captures the Largest Market Share and is Expected to Retain its Dominance over the Forecast Period
- 4. Market Factor Analysis
- 4.1. Porters Five Forces
- 4.2. Supply/Value Chain
- 4.3. PESTEL analysis
- 4.4. Market Entropy
- 4.5. Patent/Trademark Analysis
- 5. Australia & New Zealand Medical Imaging Services Industry Analysis, Insights and Forecast, 2019-2031
- 5.1. Market Analysis, Insights and Forecast - by Modality
- 5.1.1. MRI
- 5.1.2. Computed Tomography
- 5.1.3. Ultrasound
- 5.1.4. X-ray
- 5.1.5. Nuclear Imaging
- 5.1.6. Fluoroscopy
- 5.1.7. Mamography
- 5.2. Market Analysis, Insights and Forecast - by Application
- 5.2.1. Cardiology
- 5.2.2. Oncology
- 5.2.3. Neurology
- 5.2.4. Orthopedics
- 5.2.5. Gastroenterology
- 5.2.6. Gynecology
- 5.2.7. Other Applications
- 5.3. Market Analysis, Insights and Forecast - by End User
- 5.3.1. Hospital
- 5.3.2. Diagnostic Centers
- 5.3.3. Others
- 5.4. Market Analysis, Insights and Forecast - by Region
- 5.4.1. Australia
- 5.1. Market Analysis, Insights and Forecast - by Modality
- 6. Competitive Analysis
- 6.1. Market Share Analysis 2024
- 6.2. Company Profiles
- 6.2.1 Hologic Inc
- 6.2.1.1. Overview
- 6.2.1.2. Products
- 6.2.1.3. SWOT Analysis
- 6.2.1.4. Recent Developments
- 6.2.1.5. Financials (Based on Availability)
- 6.2.2 GE Healthcare
- 6.2.2.1. Overview
- 6.2.2.2. Products
- 6.2.2.3. SWOT Analysis
- 6.2.2.4. Recent Developments
- 6.2.2.5. Financials (Based on Availability)
- 6.2.3 Esaote
- 6.2.3.1. Overview
- 6.2.3.2. Products
- 6.2.3.3. SWOT Analysis
- 6.2.3.4. Recent Developments
- 6.2.3.5. Financials (Based on Availability)
- 6.2.4 Canon Medical Systems Ltd
- 6.2.4.1. Overview
- 6.2.4.2. Products
- 6.2.4.3. SWOT Analysis
- 6.2.4.4. Recent Developments
- 6.2.4.5. Financials (Based on Availability)
- 6.2.5 Siemens Healthcare GmbH*List Not Exhaustive
- 6.2.5.1. Overview
- 6.2.5.2. Products
- 6.2.5.3. SWOT Analysis
- 6.2.5.4. Recent Developments
- 6.2.5.5. Financials (Based on Availability)
- 6.2.6 Carestream Health
- 6.2.6.1. Overview
- 6.2.6.2. Products
- 6.2.6.3. SWOT Analysis
- 6.2.6.4. Recent Developments
- 6.2.6.5. Financials (Based on Availability)
- 6.2.7 Koninklijke Philips NV
- 6.2.7.1. Overview
- 6.2.7.2. Products
- 6.2.7.3. SWOT Analysis
- 6.2.7.4. Recent Developments
- 6.2.7.5. Financials (Based on Availability)
- 6.2.8 Fujifilm Holdings Corporation
- 6.2.8.1. Overview
- 6.2.8.2. Products
- 6.2.8.3. SWOT Analysis
- 6.2.8.4. Recent Developments
- 6.2.8.5. Financials (Based on Availability)
- 6.2.1 Hologic Inc
List of Figures
- Figure 1: Australia & New Zealand Medical Imaging Services Industry Revenue Breakdown (Million, %) by Product 2024 & 2032
- Figure 2: Australia & New Zealand Medical Imaging Services Industry Share (%) by Company 2024
List of Tables
- Table 1: Australia & New Zealand Medical Imaging Services Industry Revenue Million Forecast, by Region 2019 & 2032
- Table 2: Australia & New Zealand Medical Imaging Services Industry Revenue Million Forecast, by Modality 2019 & 2032
- Table 3: Australia & New Zealand Medical Imaging Services Industry Revenue Million Forecast, by Application 2019 & 2032
- Table 4: Australia & New Zealand Medical Imaging Services Industry Revenue Million Forecast, by End User 2019 & 2032
- Table 5: Australia & New Zealand Medical Imaging Services Industry Revenue Million Forecast, by Region 2019 & 2032
- Table 6: Australia & New Zealand Medical Imaging Services Industry Revenue Million Forecast, by Country 2019 & 2032
- Table 7: Australia & New Zealand Medical Imaging Services Industry Revenue Million Forecast, by Modality 2019 & 2032
- Table 8: Australia & New Zealand Medical Imaging Services Industry Revenue Million Forecast, by Application 2019 & 2032
- Table 9: Australia & New Zealand Medical Imaging Services Industry Revenue Million Forecast, by End User 2019 & 2032
- Table 10: Australia & New Zealand Medical Imaging Services Industry Revenue Million Forecast, by Country 2019 & 2032
Frequently Asked Questions
1. What is the projected Compound Annual Growth Rate (CAGR) of the Australia & New Zealand Medical Imaging Services Industry?
The projected CAGR is approximately 6.11%.
2. Which companies are prominent players in the Australia & New Zealand Medical Imaging Services Industry?
Key companies in the market include Hologic Inc, GE Healthcare, Esaote, Canon Medical Systems Ltd, Siemens Healthcare GmbH*List Not Exhaustive, Carestream Health, Koninklijke Philips NV, Fujifilm Holdings Corporation.
3. What are the main segments of the Australia & New Zealand Medical Imaging Services Industry?
The market segments include Modality, Application, End User.
4. Can you provide details about the market size?
The market size is estimated to be USD XX Million as of 2022.
5. What are some drivers contributing to market growth?
Technological Advancements; Growth Burden of Chronic Diseases.
6. What are the notable trends driving market growth?
X-ray Segment Captures the Largest Market Share and is Expected to Retain its Dominance over the Forecast Period.
7. Are there any restraints impacting market growth?
High Cost of Advanced Diagnostic Imaging Devices.
8. Can you provide examples of recent developments in the market?
In May 2022, The Australian medical technology company EMVision has developed portable brain imaging technology.
9. What pricing options are available for accessing the report?
Pricing options include single-user, multi-user, and enterprise licenses priced at USD 3800, USD 4500, and USD 5800 respectively.
10. Is the market size provided in terms of value or volume?
The market size is provided in terms of value, measured in Million.
11. Are there any specific market keywords associated with the report?
Yes, the market keyword associated with the report is "Australia & New Zealand Medical Imaging Services Industry," which aids in identifying and referencing the specific market segment covered.
12. How do I determine which pricing option suits my needs best?
The pricing options vary based on user requirements and access needs. Individual users may opt for single-user licenses, while businesses requiring broader access may choose multi-user or enterprise licenses for cost-effective access to the report.
13. Are there any additional resources or data provided in the Australia & New Zealand Medical Imaging Services Industry report?
While the report offers comprehensive insights, it's advisable to review the specific contents or supplementary materials provided to ascertain if additional resources or data are available.
14. How can I stay updated on further developments or reports in the Australia & New Zealand Medical Imaging Services Industry?
To stay informed about further developments, trends, and reports in the Australia & New Zealand Medical Imaging Services Industry, consider subscribing to industry newsletters, following relevant companies and organizations, or regularly checking reputable industry news sources and publications.
Methodology
Step 1 - Identification of Relevant Samples Size from Population Database


Step 2 - Approaches for Defining Global Market Size (Value, Volume* & Price*)

Note*: In applicable scenarios
Step 3 - Data Sources
Primary Research
- Web Analytics
- Survey Reports
- Research Institute
- Latest Research Reports
- Opinion Leaders
Secondary Research
- Annual Reports
- White Paper
- Latest Press Release
- Industry Association
- Paid Database
- Investor Presentations

Step 4 - Data Triangulation
Involves using different sources of information in order to increase the validity of a study
These sources are likely to be stakeholders in a program - participants, other researchers, program staff, other community members, and so on.
Then we put all data in single framework & apply various statistical tools to find out the dynamic on the market.
During the analysis stage, feedback from the stakeholder groups would be compared to determine areas of agreement as well as areas of divergence


