Key Insights
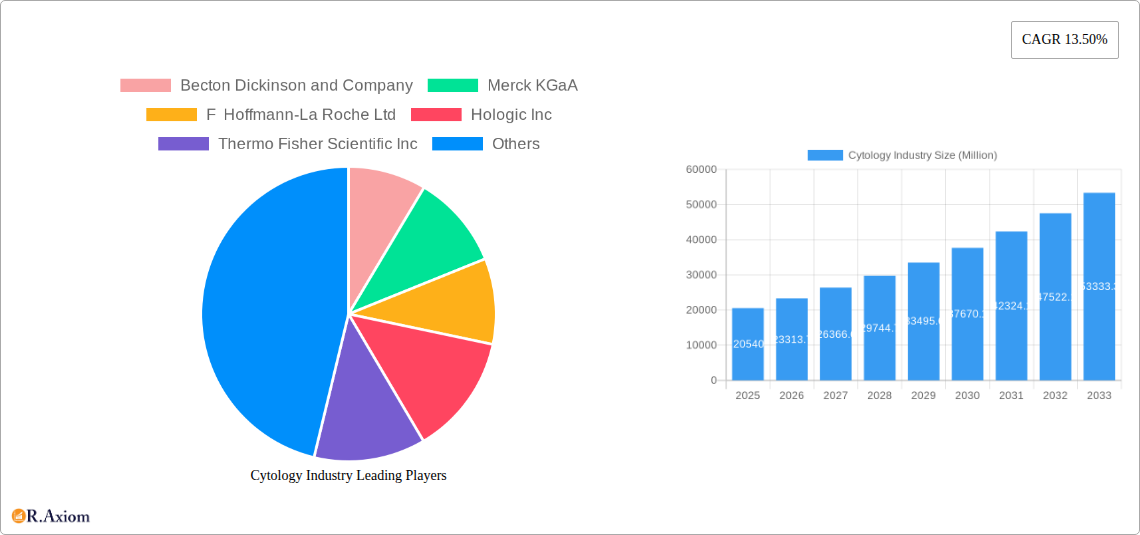
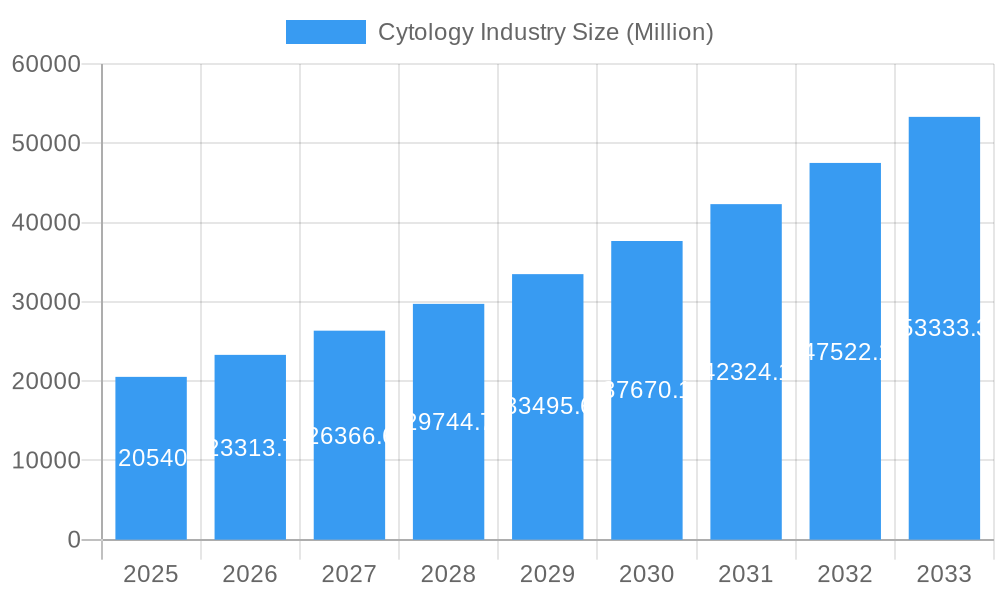
The global cytology market, valued at $20.54 billion in 2025, is experiencing robust growth, projected to expand at a compound annual growth rate (CAGR) of 13.50% from 2025 to 2033. This significant expansion is driven by several key factors. The increasing prevalence of cancers, particularly cervical and lung cancers, necessitates more frequent screening and diagnostic procedures, fueling demand for cytology services. Advancements in cytology techniques, including automated systems and digital pathology, are improving accuracy, efficiency, and throughput, leading to faster diagnosis and improved patient outcomes. Furthermore, the rising geriatric population, a demographic more susceptible to various cancers and other diseases requiring cytological examination, contributes significantly to market growth. Government initiatives promoting early cancer detection and improved healthcare infrastructure in developing economies are also creating substantial growth opportunities. The market is segmented by examination type (histology and cytology), test type (microscopy tests, cytogenetic tests like karyotyping and FISH, and other microscopy tests including molecular genetics tests and flow cytometry), and end-users (hospitals and clinics, academic and research institutes, and other end-users). North America currently holds a significant market share due to advanced healthcare infrastructure and high adoption rates of innovative technologies. However, Asia Pacific is projected to witness the fastest growth rate owing to expanding healthcare spending and increasing awareness about preventative healthcare.
Cytology Industry Market Size (In Billion)
The competitive landscape is characterized by the presence of established players like Becton Dickinson, Merck KGaA, Roche, Hologic, Thermo Fisher Scientific, and others. These companies are actively engaged in research and development to enhance existing technologies and introduce innovative products to maintain their market position. Strategic collaborations, mergers and acquisitions, and expansion into emerging markets are expected to shape the competitive dynamics in the coming years. Despite this positive outlook, challenges remain, including high costs associated with advanced technologies and skilled personnel shortages, particularly in certain regions. However, the continuous innovation in the field and the rising demand for accurate and timely diagnostics are likely to outweigh these restraints, ensuring the continued expansion of the cytology market throughout the forecast period.
Cytology Industry Company Market Share
Cytology Industry Market Report: 2019-2033
This comprehensive report provides a detailed analysis of the Cytology industry, offering invaluable insights for stakeholders, investors, and industry professionals. The study covers the period from 2019 to 2033, with a focus on the base year 2025 and a forecast period extending to 2033. The report delves into market segmentation, competitive landscape, growth drivers, challenges, and emerging opportunities, providing a holistic view of this dynamic sector. The global market size is estimated to reach xx Million by 2025.
Cytology Industry Market Concentration & Innovation
The cytology industry is characterized by a moderately concentrated market structure, with several multinational corporations holding significant market share. Key players like Becton Dickinson and Company, Merck KGaA, F Hoffmann-La Roche Ltd, Hologic Inc, and Thermo Fisher Scientific Inc dominate the landscape, competing fiercely on innovation, product portfolio breadth, and global reach. While precise market share figures fluctuate annually, these companies collectively account for an estimated 60% of the global market.
Market Concentration Metrics (2025 Estimates):
- Top 5 players: 60% market share
- Top 10 players: 80% market share
- Average M&A deal value (2019-2024): $xx Million
Innovation Drivers:
- Advancements in microscopy techniques (e.g., high-content screening, super-resolution microscopy).
- Development of automated and high-throughput cytology systems.
- Integration of molecular diagnostics and imaging technologies.
- Growing adoption of AI and machine learning for image analysis and diagnosis.
Regulatory Frameworks and Product Substitutes:
Stringent regulatory approvals (e.g., FDA) significantly impact market entry and product development. The existence of alternative diagnostic methods poses competitive pressure, necessitating continuous innovation.
End-User Trends and M&A Activities:
Hospitals and clinics remain the largest end-users, driven by rising incidence of cancers and infectious diseases requiring cytological examination. Strategic acquisitions and mergers are frequent, aiming to expand product portfolios, geographic reach, and technological capabilities.
Cytology Industry Industry Trends & Insights
The global cytology market is experiencing robust growth, driven by several key factors. The increasing prevalence of cancer and infectious diseases necessitates more frequent and sophisticated diagnostic testing. Technological advancements, such as automated systems and AI-powered image analysis, are improving diagnostic accuracy and efficiency, leading to higher market penetration. The rising geriatric population further fuels demand for cytological tests. The market demonstrates a strong preference for minimally invasive procedures and rapid diagnostic solutions. Consumer awareness regarding early disease detection and preventive healthcare is also impacting growth.
Market Growth Drivers:
- Increasing prevalence of cancer and infectious diseases
- Technological advancements leading to improved accuracy and efficiency
- Growing geriatric population
- Rising healthcare expenditure
- Increasing demand for minimally invasive procedures and rapid diagnostics
- Improved healthcare infrastructure in developing economies
Technological Disruptions:
The integration of molecular diagnostics, such as PCR and next-generation sequencing, with cytology is creating new opportunities. AI-powered image analysis is significantly improving diagnostic accuracy and reducing human error. Development of novel staining techniques and automated platforms is further transforming the industry.
Consumer Preferences:
Demand for quick, accurate, and less invasive procedures is rapidly growing, driving innovation in the field. Patients are increasingly seeking convenient diagnostic options with minimal discomfort and fast turnaround times.
Competitive Dynamics:
The market exhibits intense competition among established players and emerging companies. Key players are focusing on product innovation, strategic partnerships, and acquisitions to gain a competitive edge. The market’s growth is also influenced by the pricing strategies employed by various players.
Market CAGR (2025-2033): xx% Market Penetration (2025): xx%
Dominant Markets & Segments in Cytology Industry
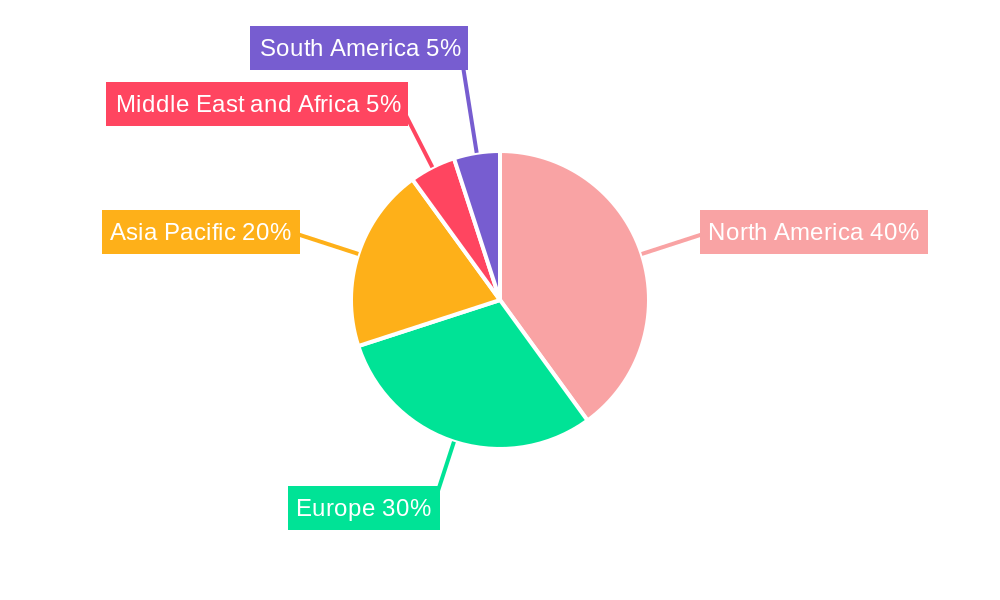
The North American region currently holds the largest market share in the cytology industry, driven by factors such as advanced healthcare infrastructure, high healthcare expenditure, and the presence of major industry players. However, the Asia-Pacific region is expected to witness significant growth in the coming years.
Dominant Segments:
- Type of Examination: Cytology currently dominates, driven by its broad applicability across various diseases.
- Test Type: Microscopy Tests hold the largest share due to their established role in cytological diagnostics.
- Cytogenic Tests: FISH is gaining traction due to its high sensitivity and specificity in detecting chromosomal abnormalities.
- Other Microscopy Tests: Molecular genetics tests are showing promising growth, driven by the development of advanced molecular techniques.
- End User: Hospitals and clinics represent the largest segment due to their higher testing volume.
Key Drivers for Dominance:
- North America: High healthcare expenditure, advanced infrastructure, and presence of leading players.
- Asia-Pacific: Rapid economic growth, increasing healthcare awareness, and rising prevalence of target diseases.
- Europe: Well-established healthcare systems, regulatory support for new technologies, and presence of prominent players.
Cytology Industry Product Developments
Recent product innovations in the cytology industry include the development of automated liquid-based cytology systems, advanced image analysis software incorporating AI, and integrated platforms combining cytology with molecular diagnostics. These innovations offer enhanced accuracy, efficiency, and improved workflow in cytology laboratories. This translates to faster turnaround times, reduced costs, and better patient outcomes, enhancing market fit and competitive advantages.
Report Scope & Segmentation Analysis
This report analyzes the cytology industry across several key segments:
Type of Examination: Histology and Cytology. The report will detail market size, growth projections, and competitive dynamics for each.
Test Type: Microscopy Tests, Cytogenic Tests (Karyotyping and FISH), and Other Microscopy Tests (including molecular genetics tests and flow cytometry). Growth projections and competitive landscapes are provided for each segment.
End User: Hospitals and Clinics, Academic and Research Institutes, and Other End Users. Market size, growth projections, and competitive dynamics for each will be presented.
Key Drivers of Cytology Industry Growth
Several factors are driving the growth of the cytology industry:
- Technological advancements like AI-powered image analysis improving diagnostic accuracy.
- Rising prevalence of cancer and infectious diseases leading to increased demand for diagnostics.
- Government initiatives promoting early disease detection programs and investments in healthcare infrastructure.
- Increasing healthcare expenditure and insurance coverage boosting affordability.
Challenges in the Cytology Industry Sector
The cytology industry faces challenges such as:
- Stringent regulatory approvals for new products and technologies increasing time-to-market.
- High costs associated with advanced technologies and skilled personnel limiting affordability.
- Intense competition among established players and emerging companies impacting profit margins.
- Supply chain disruptions impacting availability of key reagents and equipment.
Emerging Opportunities in Cytology Industry
The cytology industry presents significant opportunities, including:
- Development of point-of-care cytology devices for rapid diagnostics.
- Integration of liquid biopsy with cytological analysis for early cancer detection.
- Expansion into emerging markets with growing healthcare infrastructure and increasing disease burden.
- Personalized medicine approaches utilizing cytology data to tailor treatment strategies.
Leading Players in the Cytology Industry Market
Key Developments in Cytology Industry Industry
February 2023: BioReference Health LLC announced it would offer the Roche Diagnostics CINtec PLUS Cytology test, an FDA-approved dual-stain triage test for patients with positive high-risk HPV results. This expands testing options and improves HPV triage accuracy.
July 2022: Nanostics Inc. launched a clinical study for its Clarity DX Bladder test, a minimally invasive bladder cancer diagnostic. This highlights the push for less invasive and more accurate diagnostic tools.
Strategic Outlook for Cytology Industry Market
The cytology market is poised for continued growth, driven by technological advancements, rising disease prevalence, and increasing healthcare expenditure. Focus on point-of-care diagnostics, integration of molecular techniques, and the application of AI will significantly shape the future landscape. Companies strategically positioning themselves to meet the demand for faster, more accurate, and less invasive testing will gain a competitive advantage. The expansion into emerging markets with high disease burdens also offers substantial opportunities for growth.
Cytology Industry Segmentation
-
1. Type of Examination
- 1.1. Histology
-
1.2. Cytology
- 1.2.1. Breast Cancer
- 1.2.2. Cervical Cancer
- 1.2.3. Others
-
2. Test Type
-
2.1. Microscopy Tests
-
2.1.1. Cytogenic Tests
- 2.1.1.1. Karyotyping
- 2.1.1.2. Fluorescent In-situ Hybridization (FISH)
- 2.1.2. Polymerase Chain Reaction
- 2.1.3. Other Microscopy Tests
-
2.1.1. Cytogenic Tests
- 2.2. Molecular Genetics Tests
- 2.3. Flow Cytomtery
-
2.1. Microscopy Tests
-
3. End User
- 3.1. Hospitals and Clinics
- 3.2. Academic and Research Institutes
- 3.3. Other End Users
Cytology Industry Segmentation By Geography
-
1. North America
- 1.1. United States
- 1.2. Canada
- 1.3. Mexico
-
2. Europe
- 2.1. Germany
- 2.2. United Kingdom
- 2.3. France
- 2.4. Italy
- 2.5. Spain
- 2.6. Rest of Europe
-
3. Asia Pacific
- 3.1. China
- 3.2. Japan
- 3.3. India
- 3.4. Australia
- 3.5. South korea
- 3.6. Rest of Asia Pacific
-
4. Middle East and Africa
- 4.1. GCC
- 4.2. South Africa
- 4.3. Rest of Middle East and Africa
-
5. South America
- 5.1. Brazil
- 5.2. Argentina
- 5.3. Rest of South America
Cytology Industry Regional Market Share
Geographic Coverage of Cytology Industry
Cytology Industry REPORT HIGHLIGHTS
| Aspects | Details |
|---|---|
| Study Period | 2020-2034 |
| Base Year | 2025 |
| Estimated Year | 2026 |
| Forecast Period | 2026-2034 |
| Historical Period | 2020-2025 |
| Growth Rate | CAGR of 13.50% from 2020-2034 |
| Segmentation |
|
Table of Contents
- 1. Introduction
- 1.1. Research Scope
- 1.2. Market Segmentation
- 1.3. Research Objective
- 1.4. Definitions and Assumptions
- 2. Executive Summary
- 2.1. Market Snapshot
- 3. Market Dynamics
- 3.1. Market Drivers
- 3.2. Market Restrains
- 3.3. Market Trends
- 3.4. Market Opportunities
- 4. Market Factor Analysis
- 4.1. Porters Five Forces
- 4.1.1. Bargaining Power of Suppliers
- 4.1.2. Bargaining Power of Buyers
- 4.1.3. Threat of New Entrants
- 4.1.4. Threat of Substitutes
- 4.1.5. Competitive Rivalry
- 4.2. PESTEL analysis
- 4.3. BCG Analysis
- 4.3.1. Stars (High Growth, High Market Share)
- 4.3.2. Cash Cows (Low Growth, High Market Share)
- 4.3.3. Question Mark (High Growth, Low Market Share)
- 4.3.4. Dogs (Low Growth, Low Market Share)
- 4.4. Ansoff Matrix Analysis
- 4.5. Supply Chain Analysis
- 4.6. Regulatory Landscape
- 4.7. Current Market Potential and Opportunity Assessment (TAM–SAM–SOM Framework)
- 4.8. RAX Analyst Note
- 4.1. Porters Five Forces
- 5. Market Analysis, Insights and Forecast 2021-2033
- 5.1. Market Analysis, Insights and Forecast - by Type of Examination
- 5.1.1. Histology
- 5.1.2. Cytology
- 5.1.2.1. Breast Cancer
- 5.1.2.2. Cervical Cancer
- 5.1.2.3. Others
- 5.2. Market Analysis, Insights and Forecast - by Test Type
- 5.2.1. Microscopy Tests
- 5.2.1.1. Cytogenic Tests
- 5.2.1.1.1. Karyotyping
- 5.2.1.1.2. Fluorescent In-situ Hybridization (FISH)
- 5.2.1.2. Polymerase Chain Reaction
- 5.2.1.3. Other Microscopy Tests
- 5.2.1.1. Cytogenic Tests
- 5.2.2. Molecular Genetics Tests
- 5.2.3. Flow Cytomtery
- 5.2.1. Microscopy Tests
- 5.3. Market Analysis, Insights and Forecast - by End User
- 5.3.1. Hospitals and Clinics
- 5.3.2. Academic and Research Institutes
- 5.3.3. Other End Users
- 5.4. Market Analysis, Insights and Forecast - by Region
- 5.4.1. North America
- 5.4.2. Europe
- 5.4.3. Asia Pacific
- 5.4.4. Middle East and Africa
- 5.4.5. South America
- 5.1. Market Analysis, Insights and Forecast - by Type of Examination
- 6. Global Cytology Industry Analysis, Insights and Forecast, 2021-2033
- 6.1. Market Analysis, Insights and Forecast - by Type of Examination
- 6.1.1. Histology
- 6.1.2. Cytology
- 6.1.2.1. Breast Cancer
- 6.1.2.2. Cervical Cancer
- 6.1.2.3. Others
- 6.2. Market Analysis, Insights and Forecast - by Test Type
- 6.2.1. Microscopy Tests
- 6.2.1.1. Cytogenic Tests
- 6.2.1.1.1. Karyotyping
- 6.2.1.1.2. Fluorescent In-situ Hybridization (FISH)
- 6.2.1.2. Polymerase Chain Reaction
- 6.2.1.3. Other Microscopy Tests
- 6.2.1.1. Cytogenic Tests
- 6.2.2. Molecular Genetics Tests
- 6.2.3. Flow Cytomtery
- 6.2.1. Microscopy Tests
- 6.3. Market Analysis, Insights and Forecast - by End User
- 6.3.1. Hospitals and Clinics
- 6.3.2. Academic and Research Institutes
- 6.3.3. Other End Users
- 6.1. Market Analysis, Insights and Forecast - by Type of Examination
- 7. North America Cytology Industry Analysis, Insights and Forecast, 2020-2032
- 7.1. Market Analysis, Insights and Forecast - by Type of Examination
- 7.1.1. Histology
- 7.1.2. Cytology
- 7.1.2.1. Breast Cancer
- 7.1.2.2. Cervical Cancer
- 7.1.2.3. Others
- 7.2. Market Analysis, Insights and Forecast - by Test Type
- 7.2.1. Microscopy Tests
- 7.2.1.1. Cytogenic Tests
- 7.2.1.1.1. Karyotyping
- 7.2.1.1.2. Fluorescent In-situ Hybridization (FISH)
- 7.2.1.2. Polymerase Chain Reaction
- 7.2.1.3. Other Microscopy Tests
- 7.2.1.1. Cytogenic Tests
- 7.2.2. Molecular Genetics Tests
- 7.2.3. Flow Cytomtery
- 7.2.1. Microscopy Tests
- 7.3. Market Analysis, Insights and Forecast - by End User
- 7.3.1. Hospitals and Clinics
- 7.3.2. Academic and Research Institutes
- 7.3.3. Other End Users
- 7.1. Market Analysis, Insights and Forecast - by Type of Examination
- 8. Europe Cytology Industry Analysis, Insights and Forecast, 2020-2032
- 8.1. Market Analysis, Insights and Forecast - by Type of Examination
- 8.1.1. Histology
- 8.1.2. Cytology
- 8.1.2.1. Breast Cancer
- 8.1.2.2. Cervical Cancer
- 8.1.2.3. Others
- 8.2. Market Analysis, Insights and Forecast - by Test Type
- 8.2.1. Microscopy Tests
- 8.2.1.1. Cytogenic Tests
- 8.2.1.1.1. Karyotyping
- 8.2.1.1.2. Fluorescent In-situ Hybridization (FISH)
- 8.2.1.2. Polymerase Chain Reaction
- 8.2.1.3. Other Microscopy Tests
- 8.2.1.1. Cytogenic Tests
- 8.2.2. Molecular Genetics Tests
- 8.2.3. Flow Cytomtery
- 8.2.1. Microscopy Tests
- 8.3. Market Analysis, Insights and Forecast - by End User
- 8.3.1. Hospitals and Clinics
- 8.3.2. Academic and Research Institutes
- 8.3.3. Other End Users
- 8.1. Market Analysis, Insights and Forecast - by Type of Examination
- 9. Asia Pacific Cytology Industry Analysis, Insights and Forecast, 2020-2032
- 9.1. Market Analysis, Insights and Forecast - by Type of Examination
- 9.1.1. Histology
- 9.1.2. Cytology
- 9.1.2.1. Breast Cancer
- 9.1.2.2. Cervical Cancer
- 9.1.2.3. Others
- 9.2. Market Analysis, Insights and Forecast - by Test Type
- 9.2.1. Microscopy Tests
- 9.2.1.1. Cytogenic Tests
- 9.2.1.1.1. Karyotyping
- 9.2.1.1.2. Fluorescent In-situ Hybridization (FISH)
- 9.2.1.2. Polymerase Chain Reaction
- 9.2.1.3. Other Microscopy Tests
- 9.2.1.1. Cytogenic Tests
- 9.2.2. Molecular Genetics Tests
- 9.2.3. Flow Cytomtery
- 9.2.1. Microscopy Tests
- 9.3. Market Analysis, Insights and Forecast - by End User
- 9.3.1. Hospitals and Clinics
- 9.3.2. Academic and Research Institutes
- 9.3.3. Other End Users
- 9.1. Market Analysis, Insights and Forecast - by Type of Examination
- 10. Middle East and Africa Cytology Industry Analysis, Insights and Forecast, 2020-2032
- 10.1. Market Analysis, Insights and Forecast - by Type of Examination
- 10.1.1. Histology
- 10.1.2. Cytology
- 10.1.2.1. Breast Cancer
- 10.1.2.2. Cervical Cancer
- 10.1.2.3. Others
- 10.2. Market Analysis, Insights and Forecast - by Test Type
- 10.2.1. Microscopy Tests
- 10.2.1.1. Cytogenic Tests
- 10.2.1.1.1. Karyotyping
- 10.2.1.1.2. Fluorescent In-situ Hybridization (FISH)
- 10.2.1.2. Polymerase Chain Reaction
- 10.2.1.3. Other Microscopy Tests
- 10.2.1.1. Cytogenic Tests
- 10.2.2. Molecular Genetics Tests
- 10.2.3. Flow Cytomtery
- 10.2.1. Microscopy Tests
- 10.3. Market Analysis, Insights and Forecast - by End User
- 10.3.1. Hospitals and Clinics
- 10.3.2. Academic and Research Institutes
- 10.3.3. Other End Users
- 10.1. Market Analysis, Insights and Forecast - by Type of Examination
- 11. South America Cytology Industry Analysis, Insights and Forecast, 2020-2032
- 11.1. Market Analysis, Insights and Forecast - by Type of Examination
- 11.1.1. Histology
- 11.1.2. Cytology
- 11.1.2.1. Breast Cancer
- 11.1.2.2. Cervical Cancer
- 11.1.2.3. Others
- 11.2. Market Analysis, Insights and Forecast - by Test Type
- 11.2.1. Microscopy Tests
- 11.2.1.1. Cytogenic Tests
- 11.2.1.1.1. Karyotyping
- 11.2.1.1.2. Fluorescent In-situ Hybridization (FISH)
- 11.2.1.2. Polymerase Chain Reaction
- 11.2.1.3. Other Microscopy Tests
- 11.2.1.1. Cytogenic Tests
- 11.2.2. Molecular Genetics Tests
- 11.2.3. Flow Cytomtery
- 11.2.1. Microscopy Tests
- 11.3. Market Analysis, Insights and Forecast - by End User
- 11.3.1. Hospitals and Clinics
- 11.3.2. Academic and Research Institutes
- 11.3.3. Other End Users
- 11.1. Market Analysis, Insights and Forecast - by Type of Examination
- 12. Competitive Analysis
- 12.1. Company Profiles
- 12.1.1 Becton Dickinson and Company
- 12.1.1.1. Company Overview
- 12.1.1.2. Products
- 12.1.1.3. Company Financials
- 12.1.1.4. SWOT Analysis
- 12.1.2 Merck KGaA
- 12.1.2.1. Company Overview
- 12.1.2.2. Products
- 12.1.2.3. Company Financials
- 12.1.2.4. SWOT Analysis
- 12.1.3 F Hoffmann-La Roche Ltd
- 12.1.3.1. Company Overview
- 12.1.3.2. Products
- 12.1.3.3. Company Financials
- 12.1.3.4. SWOT Analysis
- 12.1.4 Hologic Inc
- 12.1.4.1. Company Overview
- 12.1.4.2. Products
- 12.1.4.3. Company Financials
- 12.1.4.4. SWOT Analysis
- 12.1.5 Thermo Fisher Scientific Inc
- 12.1.5.1. Company Overview
- 12.1.5.2. Products
- 12.1.5.3. Company Financials
- 12.1.5.4. SWOT Analysis
- 12.1.6 Trivitron Healthcare
- 12.1.6.1. Company Overview
- 12.1.6.2. Products
- 12.1.6.3. Company Financials
- 12.1.6.4. SWOT Analysis
- 12.1.7 Danaher Corporation
- 12.1.7.1. Company Overview
- 12.1.7.2. Products
- 12.1.7.3. Company Financials
- 12.1.7.4. SWOT Analysis
- 12.1.8 Abbott
- 12.1.8.1. Company Overview
- 12.1.8.2. Products
- 12.1.8.3. Company Financials
- 12.1.8.4. SWOT Analysis
- 12.1.9 PerkinElmer Inc
- 12.1.9.1. Company Overview
- 12.1.9.2. Products
- 12.1.9.3. Company Financials
- 12.1.9.4. SWOT Analysis
- 12.1.10 Sysmex Corporation
- 12.1.10.1. Company Overview
- 12.1.10.2. Products
- 12.1.10.3. Company Financials
- 12.1.10.4. SWOT Analysis
- 12.1.1 Becton Dickinson and Company
- 12.2. Market Entropy
- 12.2.1 Company's Key Areas Served
- 12.2.2 Recent Developments
- 12.3. Company Market Share Analysis 2025
- 12.3.1 Top 5 Companies Market Share Analysis
- 12.3.2 Top 3 Companies Market Share Analysis
- 12.4. List of Potential Customers
- 13. Research Methodology
List of Figures
- Figure 1: Global Cytology Industry Revenue Breakdown (Million, %) by Region 2025 & 2033
- Figure 2: Global Cytology Industry Volume Breakdown (K Unit, %) by Region 2025 & 2033
- Figure 3: North America Cytology Industry Revenue (Million), by Type of Examination 2025 & 2033
- Figure 4: North America Cytology Industry Volume (K Unit), by Type of Examination 2025 & 2033
- Figure 5: North America Cytology Industry Revenue Share (%), by Type of Examination 2025 & 2033
- Figure 6: North America Cytology Industry Volume Share (%), by Type of Examination 2025 & 2033
- Figure 7: North America Cytology Industry Revenue (Million), by Test Type 2025 & 2033
- Figure 8: North America Cytology Industry Volume (K Unit), by Test Type 2025 & 2033
- Figure 9: North America Cytology Industry Revenue Share (%), by Test Type 2025 & 2033
- Figure 10: North America Cytology Industry Volume Share (%), by Test Type 2025 & 2033
- Figure 11: North America Cytology Industry Revenue (Million), by End User 2025 & 2033
- Figure 12: North America Cytology Industry Volume (K Unit), by End User 2025 & 2033
- Figure 13: North America Cytology Industry Revenue Share (%), by End User 2025 & 2033
- Figure 14: North America Cytology Industry Volume Share (%), by End User 2025 & 2033
- Figure 15: North America Cytology Industry Revenue (Million), by Country 2025 & 2033
- Figure 16: North America Cytology Industry Volume (K Unit), by Country 2025 & 2033
- Figure 17: North America Cytology Industry Revenue Share (%), by Country 2025 & 2033
- Figure 18: North America Cytology Industry Volume Share (%), by Country 2025 & 2033
- Figure 19: Europe Cytology Industry Revenue (Million), by Type of Examination 2025 & 2033
- Figure 20: Europe Cytology Industry Volume (K Unit), by Type of Examination 2025 & 2033
- Figure 21: Europe Cytology Industry Revenue Share (%), by Type of Examination 2025 & 2033
- Figure 22: Europe Cytology Industry Volume Share (%), by Type of Examination 2025 & 2033
- Figure 23: Europe Cytology Industry Revenue (Million), by Test Type 2025 & 2033
- Figure 24: Europe Cytology Industry Volume (K Unit), by Test Type 2025 & 2033
- Figure 25: Europe Cytology Industry Revenue Share (%), by Test Type 2025 & 2033
- Figure 26: Europe Cytology Industry Volume Share (%), by Test Type 2025 & 2033
- Figure 27: Europe Cytology Industry Revenue (Million), by End User 2025 & 2033
- Figure 28: Europe Cytology Industry Volume (K Unit), by End User 2025 & 2033
- Figure 29: Europe Cytology Industry Revenue Share (%), by End User 2025 & 2033
- Figure 30: Europe Cytology Industry Volume Share (%), by End User 2025 & 2033
- Figure 31: Europe Cytology Industry Revenue (Million), by Country 2025 & 2033
- Figure 32: Europe Cytology Industry Volume (K Unit), by Country 2025 & 2033
- Figure 33: Europe Cytology Industry Revenue Share (%), by Country 2025 & 2033
- Figure 34: Europe Cytology Industry Volume Share (%), by Country 2025 & 2033
- Figure 35: Asia Pacific Cytology Industry Revenue (Million), by Type of Examination 2025 & 2033
- Figure 36: Asia Pacific Cytology Industry Volume (K Unit), by Type of Examination 2025 & 2033
- Figure 37: Asia Pacific Cytology Industry Revenue Share (%), by Type of Examination 2025 & 2033
- Figure 38: Asia Pacific Cytology Industry Volume Share (%), by Type of Examination 2025 & 2033
- Figure 39: Asia Pacific Cytology Industry Revenue (Million), by Test Type 2025 & 2033
- Figure 40: Asia Pacific Cytology Industry Volume (K Unit), by Test Type 2025 & 2033
- Figure 41: Asia Pacific Cytology Industry Revenue Share (%), by Test Type 2025 & 2033
- Figure 42: Asia Pacific Cytology Industry Volume Share (%), by Test Type 2025 & 2033
- Figure 43: Asia Pacific Cytology Industry Revenue (Million), by End User 2025 & 2033
- Figure 44: Asia Pacific Cytology Industry Volume (K Unit), by End User 2025 & 2033
- Figure 45: Asia Pacific Cytology Industry Revenue Share (%), by End User 2025 & 2033
- Figure 46: Asia Pacific Cytology Industry Volume Share (%), by End User 2025 & 2033
- Figure 47: Asia Pacific Cytology Industry Revenue (Million), by Country 2025 & 2033
- Figure 48: Asia Pacific Cytology Industry Volume (K Unit), by Country 2025 & 2033
- Figure 49: Asia Pacific Cytology Industry Revenue Share (%), by Country 2025 & 2033
- Figure 50: Asia Pacific Cytology Industry Volume Share (%), by Country 2025 & 2033
- Figure 51: Middle East and Africa Cytology Industry Revenue (Million), by Type of Examination 2025 & 2033
- Figure 52: Middle East and Africa Cytology Industry Volume (K Unit), by Type of Examination 2025 & 2033
- Figure 53: Middle East and Africa Cytology Industry Revenue Share (%), by Type of Examination 2025 & 2033
- Figure 54: Middle East and Africa Cytology Industry Volume Share (%), by Type of Examination 2025 & 2033
- Figure 55: Middle East and Africa Cytology Industry Revenue (Million), by Test Type 2025 & 2033
- Figure 56: Middle East and Africa Cytology Industry Volume (K Unit), by Test Type 2025 & 2033
- Figure 57: Middle East and Africa Cytology Industry Revenue Share (%), by Test Type 2025 & 2033
- Figure 58: Middle East and Africa Cytology Industry Volume Share (%), by Test Type 2025 & 2033
- Figure 59: Middle East and Africa Cytology Industry Revenue (Million), by End User 2025 & 2033
- Figure 60: Middle East and Africa Cytology Industry Volume (K Unit), by End User 2025 & 2033
- Figure 61: Middle East and Africa Cytology Industry Revenue Share (%), by End User 2025 & 2033
- Figure 62: Middle East and Africa Cytology Industry Volume Share (%), by End User 2025 & 2033
- Figure 63: Middle East and Africa Cytology Industry Revenue (Million), by Country 2025 & 2033
- Figure 64: Middle East and Africa Cytology Industry Volume (K Unit), by Country 2025 & 2033
- Figure 65: Middle East and Africa Cytology Industry Revenue Share (%), by Country 2025 & 2033
- Figure 66: Middle East and Africa Cytology Industry Volume Share (%), by Country 2025 & 2033
- Figure 67: South America Cytology Industry Revenue (Million), by Type of Examination 2025 & 2033
- Figure 68: South America Cytology Industry Volume (K Unit), by Type of Examination 2025 & 2033
- Figure 69: South America Cytology Industry Revenue Share (%), by Type of Examination 2025 & 2033
- Figure 70: South America Cytology Industry Volume Share (%), by Type of Examination 2025 & 2033
- Figure 71: South America Cytology Industry Revenue (Million), by Test Type 2025 & 2033
- Figure 72: South America Cytology Industry Volume (K Unit), by Test Type 2025 & 2033
- Figure 73: South America Cytology Industry Revenue Share (%), by Test Type 2025 & 2033
- Figure 74: South America Cytology Industry Volume Share (%), by Test Type 2025 & 2033
- Figure 75: South America Cytology Industry Revenue (Million), by End User 2025 & 2033
- Figure 76: South America Cytology Industry Volume (K Unit), by End User 2025 & 2033
- Figure 77: South America Cytology Industry Revenue Share (%), by End User 2025 & 2033
- Figure 78: South America Cytology Industry Volume Share (%), by End User 2025 & 2033
- Figure 79: South America Cytology Industry Revenue (Million), by Country 2025 & 2033
- Figure 80: South America Cytology Industry Volume (K Unit), by Country 2025 & 2033
- Figure 81: South America Cytology Industry Revenue Share (%), by Country 2025 & 2033
- Figure 82: South America Cytology Industry Volume Share (%), by Country 2025 & 2033
List of Tables
- Table 1: Global Cytology Industry Revenue Million Forecast, by Type of Examination 2020 & 2033
- Table 2: Global Cytology Industry Volume K Unit Forecast, by Type of Examination 2020 & 2033
- Table 3: Global Cytology Industry Revenue Million Forecast, by Test Type 2020 & 2033
- Table 4: Global Cytology Industry Volume K Unit Forecast, by Test Type 2020 & 2033
- Table 5: Global Cytology Industry Revenue Million Forecast, by End User 2020 & 2033
- Table 6: Global Cytology Industry Volume K Unit Forecast, by End User 2020 & 2033
- Table 7: Global Cytology Industry Revenue Million Forecast, by Region 2020 & 2033
- Table 8: Global Cytology Industry Volume K Unit Forecast, by Region 2020 & 2033
- Table 9: Global Cytology Industry Revenue Million Forecast, by Type of Examination 2020 & 2033
- Table 10: Global Cytology Industry Volume K Unit Forecast, by Type of Examination 2020 & 2033
- Table 11: Global Cytology Industry Revenue Million Forecast, by Test Type 2020 & 2033
- Table 12: Global Cytology Industry Volume K Unit Forecast, by Test Type 2020 & 2033
- Table 13: Global Cytology Industry Revenue Million Forecast, by End User 2020 & 2033
- Table 14: Global Cytology Industry Volume K Unit Forecast, by End User 2020 & 2033
- Table 15: Global Cytology Industry Revenue Million Forecast, by Country 2020 & 2033
- Table 16: Global Cytology Industry Volume K Unit Forecast, by Country 2020 & 2033
- Table 17: United States Cytology Industry Revenue (Million) Forecast, by Application 2020 & 2033
- Table 18: United States Cytology Industry Volume (K Unit) Forecast, by Application 2020 & 2033
- Table 19: Canada Cytology Industry Revenue (Million) Forecast, by Application 2020 & 2033
- Table 20: Canada Cytology Industry Volume (K Unit) Forecast, by Application 2020 & 2033
- Table 21: Mexico Cytology Industry Revenue (Million) Forecast, by Application 2020 & 2033
- Table 22: Mexico Cytology Industry Volume (K Unit) Forecast, by Application 2020 & 2033
- Table 23: Global Cytology Industry Revenue Million Forecast, by Type of Examination 2020 & 2033
- Table 24: Global Cytology Industry Volume K Unit Forecast, by Type of Examination 2020 & 2033
- Table 25: Global Cytology Industry Revenue Million Forecast, by Test Type 2020 & 2033
- Table 26: Global Cytology Industry Volume K Unit Forecast, by Test Type 2020 & 2033
- Table 27: Global Cytology Industry Revenue Million Forecast, by End User 2020 & 2033
- Table 28: Global Cytology Industry Volume K Unit Forecast, by End User 2020 & 2033
- Table 29: Global Cytology Industry Revenue Million Forecast, by Country 2020 & 2033
- Table 30: Global Cytology Industry Volume K Unit Forecast, by Country 2020 & 2033
- Table 31: Germany Cytology Industry Revenue (Million) Forecast, by Application 2020 & 2033
- Table 32: Germany Cytology Industry Volume (K Unit) Forecast, by Application 2020 & 2033
- Table 33: United Kingdom Cytology Industry Revenue (Million) Forecast, by Application 2020 & 2033
- Table 34: United Kingdom Cytology Industry Volume (K Unit) Forecast, by Application 2020 & 2033
- Table 35: France Cytology Industry Revenue (Million) Forecast, by Application 2020 & 2033
- Table 36: France Cytology Industry Volume (K Unit) Forecast, by Application 2020 & 2033
- Table 37: Italy Cytology Industry Revenue (Million) Forecast, by Application 2020 & 2033
- Table 38: Italy Cytology Industry Volume (K Unit) Forecast, by Application 2020 & 2033
- Table 39: Spain Cytology Industry Revenue (Million) Forecast, by Application 2020 & 2033
- Table 40: Spain Cytology Industry Volume (K Unit) Forecast, by Application 2020 & 2033
- Table 41: Rest of Europe Cytology Industry Revenue (Million) Forecast, by Application 2020 & 2033
- Table 42: Rest of Europe Cytology Industry Volume (K Unit) Forecast, by Application 2020 & 2033
- Table 43: Global Cytology Industry Revenue Million Forecast, by Type of Examination 2020 & 2033
- Table 44: Global Cytology Industry Volume K Unit Forecast, by Type of Examination 2020 & 2033
- Table 45: Global Cytology Industry Revenue Million Forecast, by Test Type 2020 & 2033
- Table 46: Global Cytology Industry Volume K Unit Forecast, by Test Type 2020 & 2033
- Table 47: Global Cytology Industry Revenue Million Forecast, by End User 2020 & 2033
- Table 48: Global Cytology Industry Volume K Unit Forecast, by End User 2020 & 2033
- Table 49: Global Cytology Industry Revenue Million Forecast, by Country 2020 & 2033
- Table 50: Global Cytology Industry Volume K Unit Forecast, by Country 2020 & 2033
- Table 51: China Cytology Industry Revenue (Million) Forecast, by Application 2020 & 2033
- Table 52: China Cytology Industry Volume (K Unit) Forecast, by Application 2020 & 2033
- Table 53: Japan Cytology Industry Revenue (Million) Forecast, by Application 2020 & 2033
- Table 54: Japan Cytology Industry Volume (K Unit) Forecast, by Application 2020 & 2033
- Table 55: India Cytology Industry Revenue (Million) Forecast, by Application 2020 & 2033
- Table 56: India Cytology Industry Volume (K Unit) Forecast, by Application 2020 & 2033
- Table 57: Australia Cytology Industry Revenue (Million) Forecast, by Application 2020 & 2033
- Table 58: Australia Cytology Industry Volume (K Unit) Forecast, by Application 2020 & 2033
- Table 59: South korea Cytology Industry Revenue (Million) Forecast, by Application 2020 & 2033
- Table 60: South korea Cytology Industry Volume (K Unit) Forecast, by Application 2020 & 2033
- Table 61: Rest of Asia Pacific Cytology Industry Revenue (Million) Forecast, by Application 2020 & 2033
- Table 62: Rest of Asia Pacific Cytology Industry Volume (K Unit) Forecast, by Application 2020 & 2033
- Table 63: Global Cytology Industry Revenue Million Forecast, by Type of Examination 2020 & 2033
- Table 64: Global Cytology Industry Volume K Unit Forecast, by Type of Examination 2020 & 2033
- Table 65: Global Cytology Industry Revenue Million Forecast, by Test Type 2020 & 2033
- Table 66: Global Cytology Industry Volume K Unit Forecast, by Test Type 2020 & 2033
- Table 67: Global Cytology Industry Revenue Million Forecast, by End User 2020 & 2033
- Table 68: Global Cytology Industry Volume K Unit Forecast, by End User 2020 & 2033
- Table 69: Global Cytology Industry Revenue Million Forecast, by Country 2020 & 2033
- Table 70: Global Cytology Industry Volume K Unit Forecast, by Country 2020 & 2033
- Table 71: GCC Cytology Industry Revenue (Million) Forecast, by Application 2020 & 2033
- Table 72: GCC Cytology Industry Volume (K Unit) Forecast, by Application 2020 & 2033
- Table 73: South Africa Cytology Industry Revenue (Million) Forecast, by Application 2020 & 2033
- Table 74: South Africa Cytology Industry Volume (K Unit) Forecast, by Application 2020 & 2033
- Table 75: Rest of Middle East and Africa Cytology Industry Revenue (Million) Forecast, by Application 2020 & 2033
- Table 76: Rest of Middle East and Africa Cytology Industry Volume (K Unit) Forecast, by Application 2020 & 2033
- Table 77: Global Cytology Industry Revenue Million Forecast, by Type of Examination 2020 & 2033
- Table 78: Global Cytology Industry Volume K Unit Forecast, by Type of Examination 2020 & 2033
- Table 79: Global Cytology Industry Revenue Million Forecast, by Test Type 2020 & 2033
- Table 80: Global Cytology Industry Volume K Unit Forecast, by Test Type 2020 & 2033
- Table 81: Global Cytology Industry Revenue Million Forecast, by End User 2020 & 2033
- Table 82: Global Cytology Industry Volume K Unit Forecast, by End User 2020 & 2033
- Table 83: Global Cytology Industry Revenue Million Forecast, by Country 2020 & 2033
- Table 84: Global Cytology Industry Volume K Unit Forecast, by Country 2020 & 2033
- Table 85: Brazil Cytology Industry Revenue (Million) Forecast, by Application 2020 & 2033
- Table 86: Brazil Cytology Industry Volume (K Unit) Forecast, by Application 2020 & 2033
- Table 87: Argentina Cytology Industry Revenue (Million) Forecast, by Application 2020 & 2033
- Table 88: Argentina Cytology Industry Volume (K Unit) Forecast, by Application 2020 & 2033
- Table 89: Rest of South America Cytology Industry Revenue (Million) Forecast, by Application 2020 & 2033
- Table 90: Rest of South America Cytology Industry Volume (K Unit) Forecast, by Application 2020 & 2033
Frequently Asked Questions
1. What is the projected Compound Annual Growth Rate (CAGR) of the Cytology Industry?
The projected CAGR is approximately 13.50%.
2. Which companies are prominent players in the Cytology Industry?
Key companies in the market include Becton Dickinson and Company, Merck KGaA, F Hoffmann-La Roche Ltd, Hologic Inc, Thermo Fisher Scientific Inc, Trivitron Healthcare, Danaher Corporation, Abbott, PerkinElmer Inc, Sysmex Corporation.
3. What are the main segments of the Cytology Industry?
The market segments include Type of Examination, Test Type, End User.
4. Can you provide details about the market size?
The market size is estimated to be USD 20.54 Million as of 2022.
5. What are some drivers contributing to market growth?
Rising Prevalence of Cancer; Increasing Standardization of Pathological Laboratories; Technological Advancements in Diagnostic and Molecular Techniques.
6. What are the notable trends driving market growth?
Cervical Cancer Segment is Expected to Have a Significant Market Share During the Forecast Period.
7. Are there any restraints impacting market growth?
Safety Issues and Diagnostic Accuracy Issues with Histopathological and Cytopathological Tests; Lack of Awareness among the Public for Diagnostic Tests.
8. Can you provide examples of recent developments in the market?
February 2023: BioReference Health LLC announced today it would be one of the first commercial laboratories to offer the CINtec PLUS Cytology test from Roche Diagnostics. CINtec PLUS Cytology is the only FDA-approved dual-stain triage test for patients who have a positive high-risk human papillomavirus (HPV) result.
9. What pricing options are available for accessing the report?
Pricing options include single-user, multi-user, and enterprise licenses priced at USD 4750, USD 5250, and USD 8750 respectively.
10. Is the market size provided in terms of value or volume?
The market size is provided in terms of value, measured in Million and volume, measured in K Unit.
11. Are there any specific market keywords associated with the report?
Yes, the market keyword associated with the report is "Cytology Industry," which aids in identifying and referencing the specific market segment covered.
12. How do I determine which pricing option suits my needs best?
The pricing options vary based on user requirements and access needs. Individual users may opt for single-user licenses, while businesses requiring broader access may choose multi-user or enterprise licenses for cost-effective access to the report.
13. Are there any additional resources or data provided in the Cytology Industry report?
While the report offers comprehensive insights, it's advisable to review the specific contents or supplementary materials provided to ascertain if additional resources or data are available.
14. How can I stay updated on further developments or reports in the Cytology Industry?
To stay informed about further developments, trends, and reports in the Cytology Industry, consider subscribing to industry newsletters, following relevant companies and organizations, or regularly checking reputable industry news sources and publications.
Methodology
Step 1 - Identification of Relevant Samples Size from Population Database


Step 2 - Approaches for Defining Global Market Size (Value, Volume* & Price*)

Note*: In applicable scenarios
Step 3 - Data Sources
Primary Research
- Web Analytics
- Survey Reports
- Research Institute
- Latest Research Reports
- Opinion Leaders
Secondary Research
- Annual Reports
- White Paper
- Latest Press Release
- Industry Association
- Paid Database
- Investor Presentations

Step 4 - Data Triangulation
Involves using different sources of information in order to increase the validity of a study
These sources are likely to be stakeholders in a program - participants, other researchers, program staff, other community members, and so on.
Then we put all data in single framework & apply various statistical tools to find out the dynamic on the market.
During the analysis stage, feedback from the stakeholder groups would be compared to determine areas of agreement as well as areas of divergence

