Key Insights
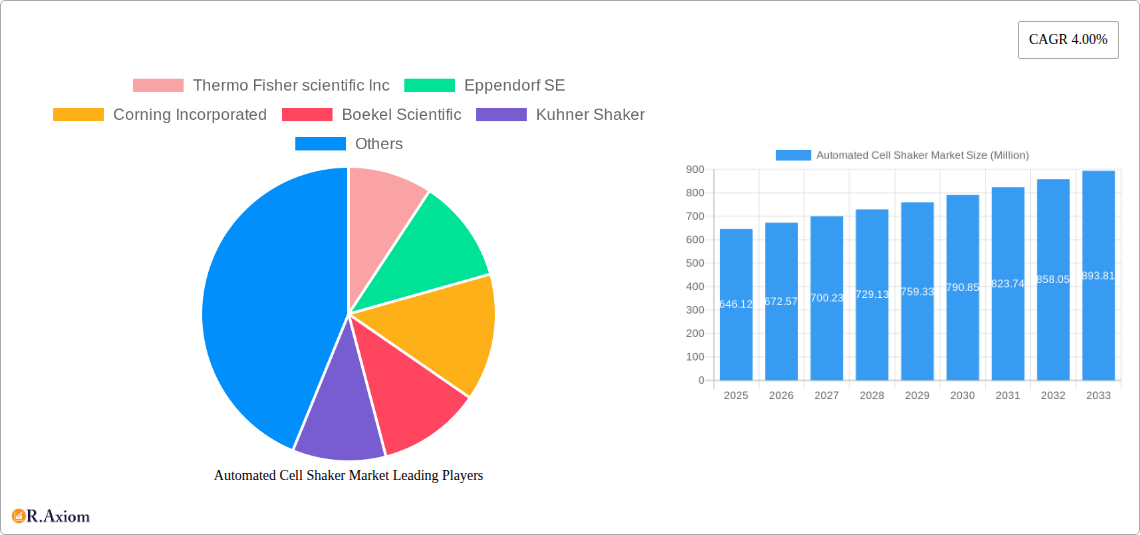
The automated cell shaker market, valued at $646.12 million in 2025, is projected to experience steady growth, driven by increasing automation in life sciences research and pharmaceutical development. The Compound Annual Growth Rate (CAGR) of 4.00% from 2025 to 2033 indicates a consistent market expansion, fueled by the rising demand for high-throughput screening, cell-based assays, and improved efficiency in laboratory settings. Key drivers include the growing adoption of advanced cell culture techniques, the need for precise and reproducible experimental results, and the increasing prevalence of chronic diseases driving pharmaceutical research. Trends such as miniaturization of cell culture systems, integration of advanced monitoring technologies (like online optical density measurement), and the development of user-friendly software interfaces are further propelling market growth. While the market faces some restraints, such as the high initial investment cost of automated systems and the need for skilled personnel, the long-term benefits in terms of enhanced productivity and reduced human error outweigh these challenges. The market is segmented by type (orbital, reciprocating, etc.), capacity, application (research, drug discovery, etc.), and end-user (pharmaceutical companies, research institutions, etc.). Leading companies like Thermo Fisher Scientific, Eppendorf, and Corning Incorporated are actively shaping the market through innovations and strategic partnerships. The market's regional distribution is expected to see significant growth in emerging economies, driven by expanding research infrastructure and increasing healthcare investments.
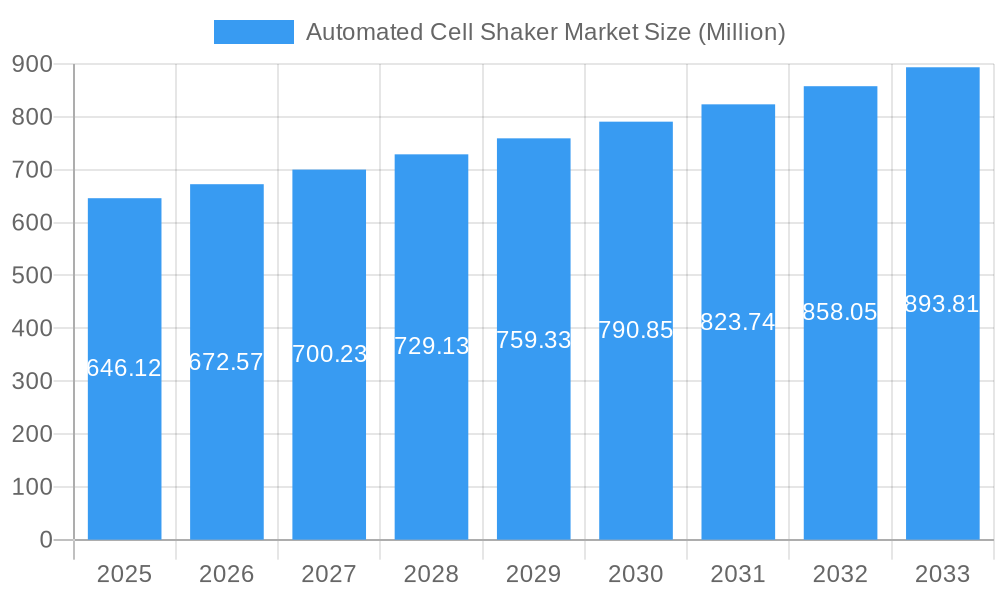
Automated Cell Shaker Market Market Size (In Million)
The forecast period (2025-2033) suggests a significant expansion of the automated cell shaker market. The increasing adoption of advanced cell culture technologies within biotechnology and pharmaceutical industries will be crucial in driving growth. Companies are focusing on developing sophisticated automated shakers with improved features such as enhanced temperature control, precise shaking speed adjustments, and integrated data management systems. This focus on innovation, alongside the rising demand for high-throughput screening and automation in life science research, will ensure continued market expansion. Competitive landscape analysis reveals ongoing mergers, acquisitions, and partnerships among key market players, resulting in a dynamic and evolving market structure. This competitive activity fosters further innovation, driving growth and providing diverse options for researchers and laboratories.
Automated Cell Shaker Market Company Market Share
Automated Cell Shaker Market: A Comprehensive Market Report (2019-2033)
This comprehensive report provides an in-depth analysis of the Automated Cell Shaker market, offering valuable insights for stakeholders, investors, and industry professionals. The study covers the period from 2019 to 2033, with 2025 serving as the base and estimated year. The report meticulously examines market dynamics, segmentation, key players, and future growth prospects, providing actionable intelligence to navigate the evolving landscape of this crucial life sciences sector.
Automated Cell Shaker Market Concentration & Innovation
This section delves into the competitive landscape of the automated cell shaker market, analyzing market concentration, innovation drivers, regulatory influences, and market dynamics. We examine the market share held by key players such as Thermo Fisher Scientific Inc, Eppendorf SE, Corning Incorporated, Boekel Scientific, Kuhner Shaker, Heidolph, VELP Scientifica, Grant Instruments, OHAUS Corporation, Labnet International, VWR International, and Sartorius AG (list not exhaustive). The report quantifies market concentration using metrics like the Herfindahl-Hirschman Index (HHI) and assesses the impact of mergers and acquisitions (M&A) on market structure. We analyze M&A deal values over the historical period (2019-2024), identifying trends and predicting their influence on future market concentration. The report also examines innovation drivers, including technological advancements (e.g., microfluidic integration, improved control systems), regulatory frameworks impacting product development and approval, the prevalence of substitute technologies, and evolving end-user needs across diverse research and industrial sectors. The influence of these factors on market share distribution and overall market growth is rigorously analyzed. We project a xx% increase in market concentration by 2033 due to anticipated M&A activity and the consolidation of leading players.
Automated Cell Shaker Market Industry Trends & Insights
This section offers a comprehensive overview of the Automated Cell Shaker market's growth trajectory. We analyze historical data (2019-2024) and project market size and growth rates (CAGR) through 2033. The analysis encompasses key growth drivers such as the increasing demand for cell-based assays in drug discovery and development, rising adoption of automated systems in high-throughput screening, and the growing focus on personalized medicine. Furthermore, we explore technological disruptions, including advancements in microfluidics, miniaturization, and the integration of AI and machine learning in cell culture processes. Consumer preferences, including demand for greater precision, ease of use, and data integration capabilities, are also examined. The competitive dynamics are analyzed, considering factors such as pricing strategies, product differentiation, and market penetration rates of leading players. We estimate a CAGR of xx% for the Automated Cell Shaker market during the forecast period (2025-2033), driven primarily by the factors mentioned above and a projected xx% market penetration in the pharmaceutical industry by 2033.
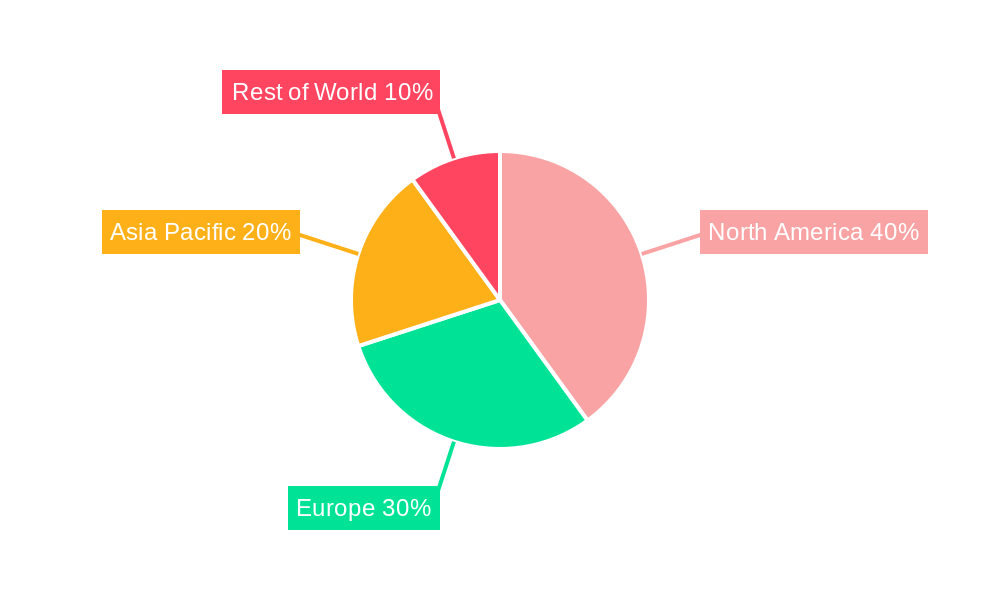
Dominant Markets & Segments in Automated Cell Shaker Market
This section identifies the leading geographical regions and market segments within the Automated Cell Shaker market. Based on our analysis, North America currently holds the dominant market share, driven by robust research and development activities and a high concentration of pharmaceutical and biotechnology companies.
Key Drivers in North America:
- Strong government funding for life sciences research.
- High adoption rates of advanced technologies in laboratories.
- Presence of major industry players and research institutions.
Detailed analysis of the dominant region(s) includes factors such as economic conditions, regulatory landscape, and infrastructure development. We also delve into segment-specific analysis, considering factors such as shaker type (orbital, reciprocating, etc.), capacity, and application area (e.g., cell culture, microbiology). We anticipate that the [specific segment, e.g., orbital shakers for cell culture] segment will exhibit the highest CAGR during the forecast period due to [reason, e.g., increasing demand for high-throughput screening in pharmaceutical R&D]. The report projects that xx Million in the North American market will be attributed to the dominant segment in 2033.
Automated Cell Shaker Market Product Developments
Recent innovations in automated cell shakers include the integration of advanced control systems, improved temperature and humidity regulation, and enhanced data management capabilities. These advancements cater to the growing demand for precise and reproducible cell culture conditions in various applications such as drug screening, stem cell research, and bioprocessing. The incorporation of features such as real-time monitoring, automated alerts, and remote control further enhances the efficiency and convenience of these systems. This focus on improved performance, user-friendliness, and data integration provides significant competitive advantages to manufacturers.
Report Scope & Segmentation Analysis
This report segments the automated cell shaker market based on several key factors, including type (orbital, reciprocating, linear, etc.), capacity (small, medium, large), application (cell culture, microbiology, etc.), and end-user (pharmaceutical, biotech, academic institutions, etc.). Each segment is analyzed in detail, providing insights into market size, growth projections, and competitive dynamics. The market is further segmented geographically by North America, Europe, Asia Pacific, and Rest of the World, with regional analysis including market drivers and challenges within each region. Growth projections vary across these segments, reflecting the diverse technological needs and market dynamics of the different sectors. For instance, the high-capacity segment is expected to witness faster growth than the smaller capacity segment driven by increased demand from large-scale bioprocessing facilities.
Key Drivers of Automated Cell Shaker Market Growth
The growth of the Automated Cell Shaker market is fueled by several key factors. Firstly, the increasing demand for automated solutions in life sciences research and pharmaceutical development is a major driver, as high-throughput screening and cell-based assays become increasingly prevalent. Secondly, technological advancements in shaker design and functionality, such as improved control systems and enhanced data integration, improve experimental efficiency and accuracy, boosting market demand. Furthermore, the growing adoption of cell-based assays in personalized medicine and the expansion of biopharmaceutical manufacturing are further contributing to market growth. Stringent regulatory requirements for ensuring product quality and consistency also drive the adoption of automated shakers that offer enhanced control and data traceability.
Challenges in the Automated Cell Shaker Market Sector
Despite the significant growth potential, the automated cell shaker market faces certain challenges. High initial investment costs associated with advanced automated systems can hinder adoption, particularly for smaller research laboratories. Competition among major players is fierce, necessitating continuous innovation and improvement to maintain market share. Furthermore, the complexity of some advanced systems might necessitate specialized training for operators, adding to the overall cost and operational complexity. Supply chain disruptions in the procurement of components, especially during periods of global uncertainty, may also impact production and delivery times, thus posing challenges for manufacturers. We estimate that these factors collectively may reduce the market's CAGR by approximately xx% by 2033.
Emerging Opportunities in Automated Cell Shaker Market
The automated cell shaker market presents various promising opportunities. The integration of advanced technologies such as AI and machine learning for optimized cell culture parameters and improved data analysis offers significant potential. The expansion into emerging economies with burgeoning life sciences sectors presents a considerable growth avenue for manufacturers. Furthermore, the growing demand for personalized medicine and the development of new cell therapies are anticipated to fuel the demand for advanced and specialized cell shakers. The customization of shakers to meet specific research needs also presents lucrative possibilities for manufacturers.
Leading Players in the Automated Cell Shaker Market Market
- Thermo Fisher Scientific Inc (https://www.thermofisher.com/)
- Eppendorf SE (https://www.eppendorf.com/)
- Corning Incorporated (https://www.corning.com/)
- Boekel Scientific
- Kuhner Shaker
- Heidolph
- VELP Scientifica
- Grant Instruments
- OHAUS Corporation
- Labnet International
- VWR International
- Sartorius AG (https://www.sartorius.com/en/home) *List Not Exhaustive
Key Developments in Automated Cell Shaker Market Industry
- January 2023: Thermo Fisher Scientific launched a new line of automated cell shakers with integrated AI capabilities for enhanced cell culture optimization.
- March 2022: Eppendorf SE acquired a smaller cell shaker manufacturer, expanding its product portfolio and market reach.
- June 2021: Corning Incorporated introduced a novel automated cell shaker featuring improved temperature control and enhanced data logging functionality.
- September 2020: A strategic alliance was formed between two key players to develop advanced cell culture platforms incorporating novel automated shakers. (Further details to be included in the full report)
Strategic Outlook for Automated Cell Shaker Market Market
The automated cell shaker market is poised for substantial growth in the coming years, driven by continued technological advancements, increased demand from various end-use sectors, and expansion into new geographical markets. The integration of artificial intelligence and machine learning, along with the development of more user-friendly and versatile systems, will continue to shape the market. Manufacturers focusing on innovation, strategic partnerships, and expansion into emerging markets are expected to gain a competitive edge. The market's future potential is significant, with growth expected to be driven by increasing research funding, advancements in cell-based therapies, and the continued need for high-throughput screening in various research and industrial settings.
Automated Cell Shaker Market Segmentation
-
1. Product
- 1.1. Automated Cell Shakers
- 1.2. Orbital Shakers
- 1.3. Ambient Shakers
- 1.4. Benchtop Incubator Shakers
- 1.5. Cell Shaker with Rotatory Arms
- 1.6. Accessories
-
2. Cell Culture Type
- 2.1. Infinite Cell Line Cultures
- 2.2. Finite Cell Line Cultures
-
3. Application
- 3.1. Drug Development
- 3.2. Regenerative Medicine
- 3.3. Cell Therapy
- 3.4. Stem Cell Research
-
4. End User
- 4.1. Pharmaceutical Companies
- 4.2. Biopharmaceutical Companies,
- 4.3. CDMOs/CMOs
- 4.4. Hospitals
- 4.5. Other End Users
Automated Cell Shaker Market Segmentation By Geography
-
1. North America
- 1.1. United States
- 1.2. Canada
- 1.3. Mexico
-
2. Europe
- 2.1. Germany
- 2.2. United Kingdom
- 2.3. France
- 2.4. Italy
- 2.5. Spain
- 2.6. Rest of Europe
-
3. Asia Pacific
- 3.1. China
- 3.2. Japan
- 3.3. India
- 3.4. Australia
- 3.5. South Korea
- 3.6. Rest of Asia Pacific
-
4. Middle East and Africa
- 4.1. GCC
- 4.2. South Africa
- 4.3. Rest of Middle East and Africa
-
5. South America
- 5.1. Brazil
- 5.2. Argentina
- 5.3. Rest of South America
Automated Cell Shaker Market Regional Market Share
Geographic Coverage of Automated Cell Shaker Market
Automated Cell Shaker Market REPORT HIGHLIGHTS
| Aspects | Details |
|---|---|
| Study Period | 2020-2034 |
| Base Year | 2025 |
| Estimated Year | 2026 |
| Forecast Period | 2026-2034 |
| Historical Period | 2020-2025 |
| Growth Rate | CAGR of 4.00% from 2020-2034 |
| Segmentation |
|
Table of Contents
- 1. Introduction
- 1.1. Research Scope
- 1.2. Market Segmentation
- 1.3. Research Objective
- 1.4. Definitions and Assumptions
- 2. Executive Summary
- 2.1. Market Snapshot
- 3. Market Dynamics
- 3.1. Market Drivers
- 3.2. Market Restrains
- 3.3. Market Trends
- 3.4. Market Opportunities
- 4. Market Factor Analysis
- 4.1. Porters Five Forces
- 4.1.1. Bargaining Power of Suppliers
- 4.1.2. Bargaining Power of Buyers
- 4.1.3. Threat of New Entrants
- 4.1.4. Threat of Substitutes
- 4.1.5. Competitive Rivalry
- 4.2. PESTEL analysis
- 4.3. BCG Analysis
- 4.3.1. Stars (High Growth, High Market Share)
- 4.3.2. Cash Cows (Low Growth, High Market Share)
- 4.3.3. Question Mark (High Growth, Low Market Share)
- 4.3.4. Dogs (Low Growth, Low Market Share)
- 4.4. Ansoff Matrix Analysis
- 4.5. Supply Chain Analysis
- 4.6. Regulatory Landscape
- 4.7. Current Market Potential and Opportunity Assessment (TAM–SAM–SOM Framework)
- 4.8. RAX Analyst Note
- 4.1. Porters Five Forces
- 5. Market Analysis, Insights and Forecast 2021-2033
- 5.1. Market Analysis, Insights and Forecast - by Product
- 5.1.1. Automated Cell Shakers
- 5.1.2. Orbital Shakers
- 5.1.3. Ambient Shakers
- 5.1.4. Benchtop Incubator Shakers
- 5.1.5. Cell Shaker with Rotatory Arms
- 5.1.6. Accessories
- 5.2. Market Analysis, Insights and Forecast - by Cell Culture Type
- 5.2.1. Infinite Cell Line Cultures
- 5.2.2. Finite Cell Line Cultures
- 5.3. Market Analysis, Insights and Forecast - by Application
- 5.3.1. Drug Development
- 5.3.2. Regenerative Medicine
- 5.3.3. Cell Therapy
- 5.3.4. Stem Cell Research
- 5.4. Market Analysis, Insights and Forecast - by End User
- 5.4.1. Pharmaceutical Companies
- 5.4.2. Biopharmaceutical Companies,
- 5.4.3. CDMOs/CMOs
- 5.4.4. Hospitals
- 5.4.5. Other End Users
- 5.5. Market Analysis, Insights and Forecast - by Region
- 5.5.1. North America
- 5.5.2. Europe
- 5.5.3. Asia Pacific
- 5.5.4. Middle East and Africa
- 5.5.5. South America
- 5.1. Market Analysis, Insights and Forecast - by Product
- 6. Global Automated Cell Shaker Market Analysis, Insights and Forecast, 2021-2033
- 6.1. Market Analysis, Insights and Forecast - by Product
- 6.1.1. Automated Cell Shakers
- 6.1.2. Orbital Shakers
- 6.1.3. Ambient Shakers
- 6.1.4. Benchtop Incubator Shakers
- 6.1.5. Cell Shaker with Rotatory Arms
- 6.1.6. Accessories
- 6.2. Market Analysis, Insights and Forecast - by Cell Culture Type
- 6.2.1. Infinite Cell Line Cultures
- 6.2.2. Finite Cell Line Cultures
- 6.3. Market Analysis, Insights and Forecast - by Application
- 6.3.1. Drug Development
- 6.3.2. Regenerative Medicine
- 6.3.3. Cell Therapy
- 6.3.4. Stem Cell Research
- 6.4. Market Analysis, Insights and Forecast - by End User
- 6.4.1. Pharmaceutical Companies
- 6.4.2. Biopharmaceutical Companies,
- 6.4.3. CDMOs/CMOs
- 6.4.4. Hospitals
- 6.4.5. Other End Users
- 6.1. Market Analysis, Insights and Forecast - by Product
- 7. North America Automated Cell Shaker Market Analysis, Insights and Forecast, 2020-2032
- 7.1. Market Analysis, Insights and Forecast - by Product
- 7.1.1. Automated Cell Shakers
- 7.1.2. Orbital Shakers
- 7.1.3. Ambient Shakers
- 7.1.4. Benchtop Incubator Shakers
- 7.1.5. Cell Shaker with Rotatory Arms
- 7.1.6. Accessories
- 7.2. Market Analysis, Insights and Forecast - by Cell Culture Type
- 7.2.1. Infinite Cell Line Cultures
- 7.2.2. Finite Cell Line Cultures
- 7.3. Market Analysis, Insights and Forecast - by Application
- 7.3.1. Drug Development
- 7.3.2. Regenerative Medicine
- 7.3.3. Cell Therapy
- 7.3.4. Stem Cell Research
- 7.4. Market Analysis, Insights and Forecast - by End User
- 7.4.1. Pharmaceutical Companies
- 7.4.2. Biopharmaceutical Companies,
- 7.4.3. CDMOs/CMOs
- 7.4.4. Hospitals
- 7.4.5. Other End Users
- 7.1. Market Analysis, Insights and Forecast - by Product
- 8. Europe Automated Cell Shaker Market Analysis, Insights and Forecast, 2020-2032
- 8.1. Market Analysis, Insights and Forecast - by Product
- 8.1.1. Automated Cell Shakers
- 8.1.2. Orbital Shakers
- 8.1.3. Ambient Shakers
- 8.1.4. Benchtop Incubator Shakers
- 8.1.5. Cell Shaker with Rotatory Arms
- 8.1.6. Accessories
- 8.2. Market Analysis, Insights and Forecast - by Cell Culture Type
- 8.2.1. Infinite Cell Line Cultures
- 8.2.2. Finite Cell Line Cultures
- 8.3. Market Analysis, Insights and Forecast - by Application
- 8.3.1. Drug Development
- 8.3.2. Regenerative Medicine
- 8.3.3. Cell Therapy
- 8.3.4. Stem Cell Research
- 8.4. Market Analysis, Insights and Forecast - by End User
- 8.4.1. Pharmaceutical Companies
- 8.4.2. Biopharmaceutical Companies,
- 8.4.3. CDMOs/CMOs
- 8.4.4. Hospitals
- 8.4.5. Other End Users
- 8.1. Market Analysis, Insights and Forecast - by Product
- 9. Asia Pacific Automated Cell Shaker Market Analysis, Insights and Forecast, 2020-2032
- 9.1. Market Analysis, Insights and Forecast - by Product
- 9.1.1. Automated Cell Shakers
- 9.1.2. Orbital Shakers
- 9.1.3. Ambient Shakers
- 9.1.4. Benchtop Incubator Shakers
- 9.1.5. Cell Shaker with Rotatory Arms
- 9.1.6. Accessories
- 9.2. Market Analysis, Insights and Forecast - by Cell Culture Type
- 9.2.1. Infinite Cell Line Cultures
- 9.2.2. Finite Cell Line Cultures
- 9.3. Market Analysis, Insights and Forecast - by Application
- 9.3.1. Drug Development
- 9.3.2. Regenerative Medicine
- 9.3.3. Cell Therapy
- 9.3.4. Stem Cell Research
- 9.4. Market Analysis, Insights and Forecast - by End User
- 9.4.1. Pharmaceutical Companies
- 9.4.2. Biopharmaceutical Companies,
- 9.4.3. CDMOs/CMOs
- 9.4.4. Hospitals
- 9.4.5. Other End Users
- 9.1. Market Analysis, Insights and Forecast - by Product
- 10. Middle East and Africa Automated Cell Shaker Market Analysis, Insights and Forecast, 2020-2032
- 10.1. Market Analysis, Insights and Forecast - by Product
- 10.1.1. Automated Cell Shakers
- 10.1.2. Orbital Shakers
- 10.1.3. Ambient Shakers
- 10.1.4. Benchtop Incubator Shakers
- 10.1.5. Cell Shaker with Rotatory Arms
- 10.1.6. Accessories
- 10.2. Market Analysis, Insights and Forecast - by Cell Culture Type
- 10.2.1. Infinite Cell Line Cultures
- 10.2.2. Finite Cell Line Cultures
- 10.3. Market Analysis, Insights and Forecast - by Application
- 10.3.1. Drug Development
- 10.3.2. Regenerative Medicine
- 10.3.3. Cell Therapy
- 10.3.4. Stem Cell Research
- 10.4. Market Analysis, Insights and Forecast - by End User
- 10.4.1. Pharmaceutical Companies
- 10.4.2. Biopharmaceutical Companies,
- 10.4.3. CDMOs/CMOs
- 10.4.4. Hospitals
- 10.4.5. Other End Users
- 10.1. Market Analysis, Insights and Forecast - by Product
- 11. South America Automated Cell Shaker Market Analysis, Insights and Forecast, 2020-2032
- 11.1. Market Analysis, Insights and Forecast - by Product
- 11.1.1. Automated Cell Shakers
- 11.1.2. Orbital Shakers
- 11.1.3. Ambient Shakers
- 11.1.4. Benchtop Incubator Shakers
- 11.1.5. Cell Shaker with Rotatory Arms
- 11.1.6. Accessories
- 11.2. Market Analysis, Insights and Forecast - by Cell Culture Type
- 11.2.1. Infinite Cell Line Cultures
- 11.2.2. Finite Cell Line Cultures
- 11.3. Market Analysis, Insights and Forecast - by Application
- 11.3.1. Drug Development
- 11.3.2. Regenerative Medicine
- 11.3.3. Cell Therapy
- 11.3.4. Stem Cell Research
- 11.4. Market Analysis, Insights and Forecast - by End User
- 11.4.1. Pharmaceutical Companies
- 11.4.2. Biopharmaceutical Companies,
- 11.4.3. CDMOs/CMOs
- 11.4.4. Hospitals
- 11.4.5. Other End Users
- 11.1. Market Analysis, Insights and Forecast - by Product
- 12. Competitive Analysis
- 12.1. Company Profiles
- 12.1.1 Thermo Fisher scientific Inc
- 12.1.1.1. Company Overview
- 12.1.1.2. Products
- 12.1.1.3. Company Financials
- 12.1.1.4. SWOT Analysis
- 12.1.2 Eppendorf SE
- 12.1.2.1. Company Overview
- 12.1.2.2. Products
- 12.1.2.3. Company Financials
- 12.1.2.4. SWOT Analysis
- 12.1.3 Corning Incorporated
- 12.1.3.1. Company Overview
- 12.1.3.2. Products
- 12.1.3.3. Company Financials
- 12.1.3.4. SWOT Analysis
- 12.1.4 Boekel Scientific
- 12.1.4.1. Company Overview
- 12.1.4.2. Products
- 12.1.4.3. Company Financials
- 12.1.4.4. SWOT Analysis
- 12.1.5 Kuhner Shaker
- 12.1.5.1. Company Overview
- 12.1.5.2. Products
- 12.1.5.3. Company Financials
- 12.1.5.4. SWOT Analysis
- 12.1.6 Heidolph
- 12.1.6.1. Company Overview
- 12.1.6.2. Products
- 12.1.6.3. Company Financials
- 12.1.6.4. SWOT Analysis
- 12.1.7 VELP Scientifica
- 12.1.7.1. Company Overview
- 12.1.7.2. Products
- 12.1.7.3. Company Financials
- 12.1.7.4. SWOT Analysis
- 12.1.8 Grant Instruments
- 12.1.8.1. Company Overview
- 12.1.8.2. Products
- 12.1.8.3. Company Financials
- 12.1.8.4. SWOT Analysis
- 12.1.9 OHAUS Corporation
- 12.1.9.1. Company Overview
- 12.1.9.2. Products
- 12.1.9.3. Company Financials
- 12.1.9.4. SWOT Analysis
- 12.1.10 Labnet International
- 12.1.10.1. Company Overview
- 12.1.10.2. Products
- 12.1.10.3. Company Financials
- 12.1.10.4. SWOT Analysis
- 12.1.11 VWR International
- 12.1.11.1. Company Overview
- 12.1.11.2. Products
- 12.1.11.3. Company Financials
- 12.1.11.4. SWOT Analysis
- 12.1.12 Sartorius AG*List Not Exhaustive
- 12.1.12.1. Company Overview
- 12.1.12.2. Products
- 12.1.12.3. Company Financials
- 12.1.12.4. SWOT Analysis
- 12.1.1 Thermo Fisher scientific Inc
- 12.2. Market Entropy
- 12.2.1 Company's Key Areas Served
- 12.2.2 Recent Developments
- 12.3. Company Market Share Analysis 2025
- 12.3.1 Top 5 Companies Market Share Analysis
- 12.3.2 Top 3 Companies Market Share Analysis
- 12.4. List of Potential Customers
- 13. Research Methodology
List of Figures
- Figure 1: Global Automated Cell Shaker Market Revenue Breakdown (Million, %) by Region 2025 & 2033
- Figure 2: Global Automated Cell Shaker Market Volume Breakdown (Million, %) by Region 2025 & 2033
- Figure 3: North America Automated Cell Shaker Market Revenue (Million), by Product 2025 & 2033
- Figure 4: North America Automated Cell Shaker Market Volume (Million), by Product 2025 & 2033
- Figure 5: North America Automated Cell Shaker Market Revenue Share (%), by Product 2025 & 2033
- Figure 6: North America Automated Cell Shaker Market Volume Share (%), by Product 2025 & 2033
- Figure 7: North America Automated Cell Shaker Market Revenue (Million), by Cell Culture Type 2025 & 2033
- Figure 8: North America Automated Cell Shaker Market Volume (Million), by Cell Culture Type 2025 & 2033
- Figure 9: North America Automated Cell Shaker Market Revenue Share (%), by Cell Culture Type 2025 & 2033
- Figure 10: North America Automated Cell Shaker Market Volume Share (%), by Cell Culture Type 2025 & 2033
- Figure 11: North America Automated Cell Shaker Market Revenue (Million), by Application 2025 & 2033
- Figure 12: North America Automated Cell Shaker Market Volume (Million), by Application 2025 & 2033
- Figure 13: North America Automated Cell Shaker Market Revenue Share (%), by Application 2025 & 2033
- Figure 14: North America Automated Cell Shaker Market Volume Share (%), by Application 2025 & 2033
- Figure 15: North America Automated Cell Shaker Market Revenue (Million), by End User 2025 & 2033
- Figure 16: North America Automated Cell Shaker Market Volume (Million), by End User 2025 & 2033
- Figure 17: North America Automated Cell Shaker Market Revenue Share (%), by End User 2025 & 2033
- Figure 18: North America Automated Cell Shaker Market Volume Share (%), by End User 2025 & 2033
- Figure 19: North America Automated Cell Shaker Market Revenue (Million), by Country 2025 & 2033
- Figure 20: North America Automated Cell Shaker Market Volume (Million), by Country 2025 & 2033
- Figure 21: North America Automated Cell Shaker Market Revenue Share (%), by Country 2025 & 2033
- Figure 22: North America Automated Cell Shaker Market Volume Share (%), by Country 2025 & 2033
- Figure 23: Europe Automated Cell Shaker Market Revenue (Million), by Product 2025 & 2033
- Figure 24: Europe Automated Cell Shaker Market Volume (Million), by Product 2025 & 2033
- Figure 25: Europe Automated Cell Shaker Market Revenue Share (%), by Product 2025 & 2033
- Figure 26: Europe Automated Cell Shaker Market Volume Share (%), by Product 2025 & 2033
- Figure 27: Europe Automated Cell Shaker Market Revenue (Million), by Cell Culture Type 2025 & 2033
- Figure 28: Europe Automated Cell Shaker Market Volume (Million), by Cell Culture Type 2025 & 2033
- Figure 29: Europe Automated Cell Shaker Market Revenue Share (%), by Cell Culture Type 2025 & 2033
- Figure 30: Europe Automated Cell Shaker Market Volume Share (%), by Cell Culture Type 2025 & 2033
- Figure 31: Europe Automated Cell Shaker Market Revenue (Million), by Application 2025 & 2033
- Figure 32: Europe Automated Cell Shaker Market Volume (Million), by Application 2025 & 2033
- Figure 33: Europe Automated Cell Shaker Market Revenue Share (%), by Application 2025 & 2033
- Figure 34: Europe Automated Cell Shaker Market Volume Share (%), by Application 2025 & 2033
- Figure 35: Europe Automated Cell Shaker Market Revenue (Million), by End User 2025 & 2033
- Figure 36: Europe Automated Cell Shaker Market Volume (Million), by End User 2025 & 2033
- Figure 37: Europe Automated Cell Shaker Market Revenue Share (%), by End User 2025 & 2033
- Figure 38: Europe Automated Cell Shaker Market Volume Share (%), by End User 2025 & 2033
- Figure 39: Europe Automated Cell Shaker Market Revenue (Million), by Country 2025 & 2033
- Figure 40: Europe Automated Cell Shaker Market Volume (Million), by Country 2025 & 2033
- Figure 41: Europe Automated Cell Shaker Market Revenue Share (%), by Country 2025 & 2033
- Figure 42: Europe Automated Cell Shaker Market Volume Share (%), by Country 2025 & 2033
- Figure 43: Asia Pacific Automated Cell Shaker Market Revenue (Million), by Product 2025 & 2033
- Figure 44: Asia Pacific Automated Cell Shaker Market Volume (Million), by Product 2025 & 2033
- Figure 45: Asia Pacific Automated Cell Shaker Market Revenue Share (%), by Product 2025 & 2033
- Figure 46: Asia Pacific Automated Cell Shaker Market Volume Share (%), by Product 2025 & 2033
- Figure 47: Asia Pacific Automated Cell Shaker Market Revenue (Million), by Cell Culture Type 2025 & 2033
- Figure 48: Asia Pacific Automated Cell Shaker Market Volume (Million), by Cell Culture Type 2025 & 2033
- Figure 49: Asia Pacific Automated Cell Shaker Market Revenue Share (%), by Cell Culture Type 2025 & 2033
- Figure 50: Asia Pacific Automated Cell Shaker Market Volume Share (%), by Cell Culture Type 2025 & 2033
- Figure 51: Asia Pacific Automated Cell Shaker Market Revenue (Million), by Application 2025 & 2033
- Figure 52: Asia Pacific Automated Cell Shaker Market Volume (Million), by Application 2025 & 2033
- Figure 53: Asia Pacific Automated Cell Shaker Market Revenue Share (%), by Application 2025 & 2033
- Figure 54: Asia Pacific Automated Cell Shaker Market Volume Share (%), by Application 2025 & 2033
- Figure 55: Asia Pacific Automated Cell Shaker Market Revenue (Million), by End User 2025 & 2033
- Figure 56: Asia Pacific Automated Cell Shaker Market Volume (Million), by End User 2025 & 2033
- Figure 57: Asia Pacific Automated Cell Shaker Market Revenue Share (%), by End User 2025 & 2033
- Figure 58: Asia Pacific Automated Cell Shaker Market Volume Share (%), by End User 2025 & 2033
- Figure 59: Asia Pacific Automated Cell Shaker Market Revenue (Million), by Country 2025 & 2033
- Figure 60: Asia Pacific Automated Cell Shaker Market Volume (Million), by Country 2025 & 2033
- Figure 61: Asia Pacific Automated Cell Shaker Market Revenue Share (%), by Country 2025 & 2033
- Figure 62: Asia Pacific Automated Cell Shaker Market Volume Share (%), by Country 2025 & 2033
- Figure 63: Middle East and Africa Automated Cell Shaker Market Revenue (Million), by Product 2025 & 2033
- Figure 64: Middle East and Africa Automated Cell Shaker Market Volume (Million), by Product 2025 & 2033
- Figure 65: Middle East and Africa Automated Cell Shaker Market Revenue Share (%), by Product 2025 & 2033
- Figure 66: Middle East and Africa Automated Cell Shaker Market Volume Share (%), by Product 2025 & 2033
- Figure 67: Middle East and Africa Automated Cell Shaker Market Revenue (Million), by Cell Culture Type 2025 & 2033
- Figure 68: Middle East and Africa Automated Cell Shaker Market Volume (Million), by Cell Culture Type 2025 & 2033
- Figure 69: Middle East and Africa Automated Cell Shaker Market Revenue Share (%), by Cell Culture Type 2025 & 2033
- Figure 70: Middle East and Africa Automated Cell Shaker Market Volume Share (%), by Cell Culture Type 2025 & 2033
- Figure 71: Middle East and Africa Automated Cell Shaker Market Revenue (Million), by Application 2025 & 2033
- Figure 72: Middle East and Africa Automated Cell Shaker Market Volume (Million), by Application 2025 & 2033
- Figure 73: Middle East and Africa Automated Cell Shaker Market Revenue Share (%), by Application 2025 & 2033
- Figure 74: Middle East and Africa Automated Cell Shaker Market Volume Share (%), by Application 2025 & 2033
- Figure 75: Middle East and Africa Automated Cell Shaker Market Revenue (Million), by End User 2025 & 2033
- Figure 76: Middle East and Africa Automated Cell Shaker Market Volume (Million), by End User 2025 & 2033
- Figure 77: Middle East and Africa Automated Cell Shaker Market Revenue Share (%), by End User 2025 & 2033
- Figure 78: Middle East and Africa Automated Cell Shaker Market Volume Share (%), by End User 2025 & 2033
- Figure 79: Middle East and Africa Automated Cell Shaker Market Revenue (Million), by Country 2025 & 2033
- Figure 80: Middle East and Africa Automated Cell Shaker Market Volume (Million), by Country 2025 & 2033
- Figure 81: Middle East and Africa Automated Cell Shaker Market Revenue Share (%), by Country 2025 & 2033
- Figure 82: Middle East and Africa Automated Cell Shaker Market Volume Share (%), by Country 2025 & 2033
- Figure 83: South America Automated Cell Shaker Market Revenue (Million), by Product 2025 & 2033
- Figure 84: South America Automated Cell Shaker Market Volume (Million), by Product 2025 & 2033
- Figure 85: South America Automated Cell Shaker Market Revenue Share (%), by Product 2025 & 2033
- Figure 86: South America Automated Cell Shaker Market Volume Share (%), by Product 2025 & 2033
- Figure 87: South America Automated Cell Shaker Market Revenue (Million), by Cell Culture Type 2025 & 2033
- Figure 88: South America Automated Cell Shaker Market Volume (Million), by Cell Culture Type 2025 & 2033
- Figure 89: South America Automated Cell Shaker Market Revenue Share (%), by Cell Culture Type 2025 & 2033
- Figure 90: South America Automated Cell Shaker Market Volume Share (%), by Cell Culture Type 2025 & 2033
- Figure 91: South America Automated Cell Shaker Market Revenue (Million), by Application 2025 & 2033
- Figure 92: South America Automated Cell Shaker Market Volume (Million), by Application 2025 & 2033
- Figure 93: South America Automated Cell Shaker Market Revenue Share (%), by Application 2025 & 2033
- Figure 94: South America Automated Cell Shaker Market Volume Share (%), by Application 2025 & 2033
- Figure 95: South America Automated Cell Shaker Market Revenue (Million), by End User 2025 & 2033
- Figure 96: South America Automated Cell Shaker Market Volume (Million), by End User 2025 & 2033
- Figure 97: South America Automated Cell Shaker Market Revenue Share (%), by End User 2025 & 2033
- Figure 98: South America Automated Cell Shaker Market Volume Share (%), by End User 2025 & 2033
- Figure 99: South America Automated Cell Shaker Market Revenue (Million), by Country 2025 & 2033
- Figure 100: South America Automated Cell Shaker Market Volume (Million), by Country 2025 & 2033
- Figure 101: South America Automated Cell Shaker Market Revenue Share (%), by Country 2025 & 2033
- Figure 102: South America Automated Cell Shaker Market Volume Share (%), by Country 2025 & 2033
List of Tables
- Table 1: Global Automated Cell Shaker Market Revenue Million Forecast, by Product 2020 & 2033
- Table 2: Global Automated Cell Shaker Market Volume Million Forecast, by Product 2020 & 2033
- Table 3: Global Automated Cell Shaker Market Revenue Million Forecast, by Cell Culture Type 2020 & 2033
- Table 4: Global Automated Cell Shaker Market Volume Million Forecast, by Cell Culture Type 2020 & 2033
- Table 5: Global Automated Cell Shaker Market Revenue Million Forecast, by Application 2020 & 2033
- Table 6: Global Automated Cell Shaker Market Volume Million Forecast, by Application 2020 & 2033
- Table 7: Global Automated Cell Shaker Market Revenue Million Forecast, by End User 2020 & 2033
- Table 8: Global Automated Cell Shaker Market Volume Million Forecast, by End User 2020 & 2033
- Table 9: Global Automated Cell Shaker Market Revenue Million Forecast, by Region 2020 & 2033
- Table 10: Global Automated Cell Shaker Market Volume Million Forecast, by Region 2020 & 2033
- Table 11: Global Automated Cell Shaker Market Revenue Million Forecast, by Product 2020 & 2033
- Table 12: Global Automated Cell Shaker Market Volume Million Forecast, by Product 2020 & 2033
- Table 13: Global Automated Cell Shaker Market Revenue Million Forecast, by Cell Culture Type 2020 & 2033
- Table 14: Global Automated Cell Shaker Market Volume Million Forecast, by Cell Culture Type 2020 & 2033
- Table 15: Global Automated Cell Shaker Market Revenue Million Forecast, by Application 2020 & 2033
- Table 16: Global Automated Cell Shaker Market Volume Million Forecast, by Application 2020 & 2033
- Table 17: Global Automated Cell Shaker Market Revenue Million Forecast, by End User 2020 & 2033
- Table 18: Global Automated Cell Shaker Market Volume Million Forecast, by End User 2020 & 2033
- Table 19: Global Automated Cell Shaker Market Revenue Million Forecast, by Country 2020 & 2033
- Table 20: Global Automated Cell Shaker Market Volume Million Forecast, by Country 2020 & 2033
- Table 21: United States Automated Cell Shaker Market Revenue (Million) Forecast, by Application 2020 & 2033
- Table 22: United States Automated Cell Shaker Market Volume (Million) Forecast, by Application 2020 & 2033
- Table 23: Canada Automated Cell Shaker Market Revenue (Million) Forecast, by Application 2020 & 2033
- Table 24: Canada Automated Cell Shaker Market Volume (Million) Forecast, by Application 2020 & 2033
- Table 25: Mexico Automated Cell Shaker Market Revenue (Million) Forecast, by Application 2020 & 2033
- Table 26: Mexico Automated Cell Shaker Market Volume (Million) Forecast, by Application 2020 & 2033
- Table 27: Global Automated Cell Shaker Market Revenue Million Forecast, by Product 2020 & 2033
- Table 28: Global Automated Cell Shaker Market Volume Million Forecast, by Product 2020 & 2033
- Table 29: Global Automated Cell Shaker Market Revenue Million Forecast, by Cell Culture Type 2020 & 2033
- Table 30: Global Automated Cell Shaker Market Volume Million Forecast, by Cell Culture Type 2020 & 2033
- Table 31: Global Automated Cell Shaker Market Revenue Million Forecast, by Application 2020 & 2033
- Table 32: Global Automated Cell Shaker Market Volume Million Forecast, by Application 2020 & 2033
- Table 33: Global Automated Cell Shaker Market Revenue Million Forecast, by End User 2020 & 2033
- Table 34: Global Automated Cell Shaker Market Volume Million Forecast, by End User 2020 & 2033
- Table 35: Global Automated Cell Shaker Market Revenue Million Forecast, by Country 2020 & 2033
- Table 36: Global Automated Cell Shaker Market Volume Million Forecast, by Country 2020 & 2033
- Table 37: Germany Automated Cell Shaker Market Revenue (Million) Forecast, by Application 2020 & 2033
- Table 38: Germany Automated Cell Shaker Market Volume (Million) Forecast, by Application 2020 & 2033
- Table 39: United Kingdom Automated Cell Shaker Market Revenue (Million) Forecast, by Application 2020 & 2033
- Table 40: United Kingdom Automated Cell Shaker Market Volume (Million) Forecast, by Application 2020 & 2033
- Table 41: France Automated Cell Shaker Market Revenue (Million) Forecast, by Application 2020 & 2033
- Table 42: France Automated Cell Shaker Market Volume (Million) Forecast, by Application 2020 & 2033
- Table 43: Italy Automated Cell Shaker Market Revenue (Million) Forecast, by Application 2020 & 2033
- Table 44: Italy Automated Cell Shaker Market Volume (Million) Forecast, by Application 2020 & 2033
- Table 45: Spain Automated Cell Shaker Market Revenue (Million) Forecast, by Application 2020 & 2033
- Table 46: Spain Automated Cell Shaker Market Volume (Million) Forecast, by Application 2020 & 2033
- Table 47: Rest of Europe Automated Cell Shaker Market Revenue (Million) Forecast, by Application 2020 & 2033
- Table 48: Rest of Europe Automated Cell Shaker Market Volume (Million) Forecast, by Application 2020 & 2033
- Table 49: Global Automated Cell Shaker Market Revenue Million Forecast, by Product 2020 & 2033
- Table 50: Global Automated Cell Shaker Market Volume Million Forecast, by Product 2020 & 2033
- Table 51: Global Automated Cell Shaker Market Revenue Million Forecast, by Cell Culture Type 2020 & 2033
- Table 52: Global Automated Cell Shaker Market Volume Million Forecast, by Cell Culture Type 2020 & 2033
- Table 53: Global Automated Cell Shaker Market Revenue Million Forecast, by Application 2020 & 2033
- Table 54: Global Automated Cell Shaker Market Volume Million Forecast, by Application 2020 & 2033
- Table 55: Global Automated Cell Shaker Market Revenue Million Forecast, by End User 2020 & 2033
- Table 56: Global Automated Cell Shaker Market Volume Million Forecast, by End User 2020 & 2033
- Table 57: Global Automated Cell Shaker Market Revenue Million Forecast, by Country 2020 & 2033
- Table 58: Global Automated Cell Shaker Market Volume Million Forecast, by Country 2020 & 2033
- Table 59: China Automated Cell Shaker Market Revenue (Million) Forecast, by Application 2020 & 2033
- Table 60: China Automated Cell Shaker Market Volume (Million) Forecast, by Application 2020 & 2033
- Table 61: Japan Automated Cell Shaker Market Revenue (Million) Forecast, by Application 2020 & 2033
- Table 62: Japan Automated Cell Shaker Market Volume (Million) Forecast, by Application 2020 & 2033
- Table 63: India Automated Cell Shaker Market Revenue (Million) Forecast, by Application 2020 & 2033
- Table 64: India Automated Cell Shaker Market Volume (Million) Forecast, by Application 2020 & 2033
- Table 65: Australia Automated Cell Shaker Market Revenue (Million) Forecast, by Application 2020 & 2033
- Table 66: Australia Automated Cell Shaker Market Volume (Million) Forecast, by Application 2020 & 2033
- Table 67: South Korea Automated Cell Shaker Market Revenue (Million) Forecast, by Application 2020 & 2033
- Table 68: South Korea Automated Cell Shaker Market Volume (Million) Forecast, by Application 2020 & 2033
- Table 69: Rest of Asia Pacific Automated Cell Shaker Market Revenue (Million) Forecast, by Application 2020 & 2033
- Table 70: Rest of Asia Pacific Automated Cell Shaker Market Volume (Million) Forecast, by Application 2020 & 2033
- Table 71: Global Automated Cell Shaker Market Revenue Million Forecast, by Product 2020 & 2033
- Table 72: Global Automated Cell Shaker Market Volume Million Forecast, by Product 2020 & 2033
- Table 73: Global Automated Cell Shaker Market Revenue Million Forecast, by Cell Culture Type 2020 & 2033
- Table 74: Global Automated Cell Shaker Market Volume Million Forecast, by Cell Culture Type 2020 & 2033
- Table 75: Global Automated Cell Shaker Market Revenue Million Forecast, by Application 2020 & 2033
- Table 76: Global Automated Cell Shaker Market Volume Million Forecast, by Application 2020 & 2033
- Table 77: Global Automated Cell Shaker Market Revenue Million Forecast, by End User 2020 & 2033
- Table 78: Global Automated Cell Shaker Market Volume Million Forecast, by End User 2020 & 2033
- Table 79: Global Automated Cell Shaker Market Revenue Million Forecast, by Country 2020 & 2033
- Table 80: Global Automated Cell Shaker Market Volume Million Forecast, by Country 2020 & 2033
- Table 81: GCC Automated Cell Shaker Market Revenue (Million) Forecast, by Application 2020 & 2033
- Table 82: GCC Automated Cell Shaker Market Volume (Million) Forecast, by Application 2020 & 2033
- Table 83: South Africa Automated Cell Shaker Market Revenue (Million) Forecast, by Application 2020 & 2033
- Table 84: South Africa Automated Cell Shaker Market Volume (Million) Forecast, by Application 2020 & 2033
- Table 85: Rest of Middle East and Africa Automated Cell Shaker Market Revenue (Million) Forecast, by Application 2020 & 2033
- Table 86: Rest of Middle East and Africa Automated Cell Shaker Market Volume (Million) Forecast, by Application 2020 & 2033
- Table 87: Global Automated Cell Shaker Market Revenue Million Forecast, by Product 2020 & 2033
- Table 88: Global Automated Cell Shaker Market Volume Million Forecast, by Product 2020 & 2033
- Table 89: Global Automated Cell Shaker Market Revenue Million Forecast, by Cell Culture Type 2020 & 2033
- Table 90: Global Automated Cell Shaker Market Volume Million Forecast, by Cell Culture Type 2020 & 2033
- Table 91: Global Automated Cell Shaker Market Revenue Million Forecast, by Application 2020 & 2033
- Table 92: Global Automated Cell Shaker Market Volume Million Forecast, by Application 2020 & 2033
- Table 93: Global Automated Cell Shaker Market Revenue Million Forecast, by End User 2020 & 2033
- Table 94: Global Automated Cell Shaker Market Volume Million Forecast, by End User 2020 & 2033
- Table 95: Global Automated Cell Shaker Market Revenue Million Forecast, by Country 2020 & 2033
- Table 96: Global Automated Cell Shaker Market Volume Million Forecast, by Country 2020 & 2033
- Table 97: Brazil Automated Cell Shaker Market Revenue (Million) Forecast, by Application 2020 & 2033
- Table 98: Brazil Automated Cell Shaker Market Volume (Million) Forecast, by Application 2020 & 2033
- Table 99: Argentina Automated Cell Shaker Market Revenue (Million) Forecast, by Application 2020 & 2033
- Table 100: Argentina Automated Cell Shaker Market Volume (Million) Forecast, by Application 2020 & 2033
- Table 101: Rest of South America Automated Cell Shaker Market Revenue (Million) Forecast, by Application 2020 & 2033
- Table 102: Rest of South America Automated Cell Shaker Market Volume (Million) Forecast, by Application 2020 & 2033
Frequently Asked Questions
1. What is the projected Compound Annual Growth Rate (CAGR) of the Automated Cell Shaker Market?
The projected CAGR is approximately 4.00%.
2. Which companies are prominent players in the Automated Cell Shaker Market?
Key companies in the market include Thermo Fisher scientific Inc, Eppendorf SE, Corning Incorporated, Boekel Scientific, Kuhner Shaker, Heidolph, VELP Scientifica, Grant Instruments, OHAUS Corporation, Labnet International, VWR International, Sartorius AG*List Not Exhaustive.
3. What are the main segments of the Automated Cell Shaker Market?
The market segments include Product, Cell Culture Type, Application, End User.
4. Can you provide details about the market size?
The market size is estimated to be USD 646.12 Million as of 2022.
5. What are some drivers contributing to market growth?
The Growing Demand for Cell Culture; Rising Research in Fields like Life Sciences and Biotechnology.
6. What are the notable trends driving market growth?
The Orbital Shakers Segment is Expected to Witness Significant Growth During the Forecast Period.
7. Are there any restraints impacting market growth?
The Growing Demand for Cell Culture; Rising Research in Fields like Life Sciences and Biotechnology.
8. Can you provide examples of recent developments in the market?
N/A
9. What pricing options are available for accessing the report?
Pricing options include single-user, multi-user, and enterprise licenses priced at USD 4750, USD 5250, and USD 8750 respectively.
10. Is the market size provided in terms of value or volume?
The market size is provided in terms of value, measured in Million and volume, measured in Million.
11. Are there any specific market keywords associated with the report?
Yes, the market keyword associated with the report is "Automated Cell Shaker Market," which aids in identifying and referencing the specific market segment covered.
12. How do I determine which pricing option suits my needs best?
The pricing options vary based on user requirements and access needs. Individual users may opt for single-user licenses, while businesses requiring broader access may choose multi-user or enterprise licenses for cost-effective access to the report.
13. Are there any additional resources or data provided in the Automated Cell Shaker Market report?
While the report offers comprehensive insights, it's advisable to review the specific contents or supplementary materials provided to ascertain if additional resources or data are available.
14. How can I stay updated on further developments or reports in the Automated Cell Shaker Market?
To stay informed about further developments, trends, and reports in the Automated Cell Shaker Market, consider subscribing to industry newsletters, following relevant companies and organizations, or regularly checking reputable industry news sources and publications.
Methodology
Step 1 - Identification of Relevant Samples Size from Population Database


Step 2 - Approaches for Defining Global Market Size (Value, Volume* & Price*)

Note*: In applicable scenarios
Step 3 - Data Sources
Primary Research
- Web Analytics
- Survey Reports
- Research Institute
- Latest Research Reports
- Opinion Leaders
Secondary Research
- Annual Reports
- White Paper
- Latest Press Release
- Industry Association
- Paid Database
- Investor Presentations

Step 4 - Data Triangulation
Involves using different sources of information in order to increase the validity of a study
These sources are likely to be stakeholders in a program - participants, other researchers, program staff, other community members, and so on.
Then we put all data in single framework & apply various statistical tools to find out the dynamic on the market.
During the analysis stage, feedback from the stakeholder groups would be compared to determine areas of agreement as well as areas of divergence

