

Key Insights into the Chromatography Data Systems Market
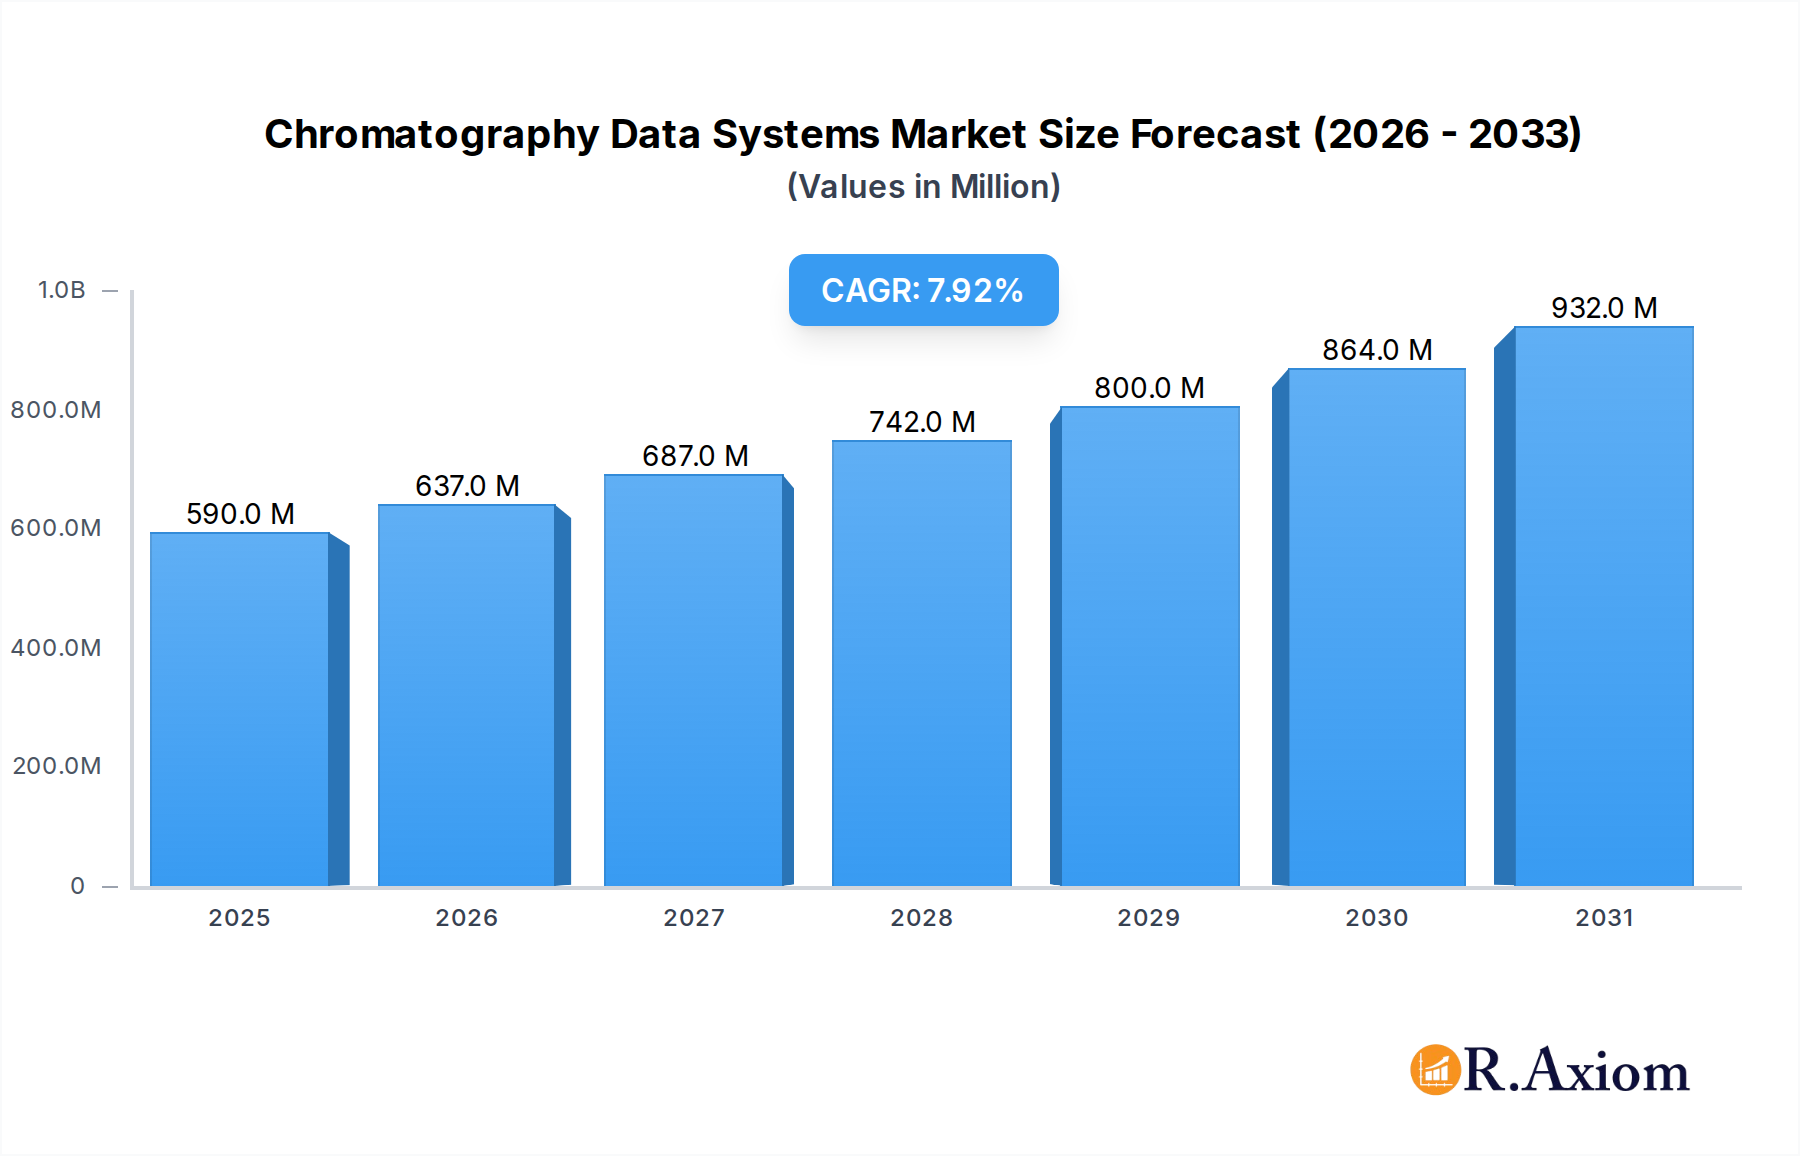
The Chromatography Data Systems Market is currently valued at $506.63 Million in 2024, exhibiting robust expansion driven by escalating research and development expenditures within the life sciences sector and a growing demand for stringent food testing protocols. Projected to achieve a Compound Annual Growth Rate (CAGR) of 7.92% from 2024 to 2034, the market is poised to reach approximately $1085.6 Million by 2034. This growth trajectory underscores the critical role of Chromatography Data Systems (CDS) in modern analytical laboratories, facilitating enhanced data integrity, streamlined workflows, and regulatory compliance across diverse industries. Key demand drivers include the increasing complexity of analytical methods, the need for automated data acquisition and processing, and the imperative for comprehensive audit trails in regulated environments.

Chromatography Data Systems Market Market Size (In Million)
The global landscape of the Chromatography Data Systems Market is shaped by continuous technological advancements, particularly in areas such as cloud integration and enterprise-level system deployments. The shift towards cloud-based solutions, highlighted by recent product innovations, is expected to revolutionize data accessibility and collaborative research, offering scalability and reduced infrastructural overheads. Furthermore, the imperative for robust data management in the High-Performance Liquid Chromatography Market and Gas Chromatography Market segments, which are foundational to chemical and biological analysis, continues to fuel demand for advanced CDS platforms. Geographically, mature markets in North America and Europe remain significant revenue contributors due to established pharmaceutical and biotechnology industries, while the Asia Pacific region is anticipated to exhibit accelerated growth, fueled by expanding R&D investments and a burgeoning contract research and manufacturing sector. The strategic emphasis on digital transformation and automation in laboratories worldwide forms a powerful macro tailwind, ensuring sustained momentum for the Chromatography Data Systems Market through the forecast period.
Chromatography Data Systems Market Company Market Share
High-Performance Liquid Chromatography Technique Segment in Chromatography Data Systems Market
The High-Performance Liquid Chromatography (HPLC) technique segment is a cornerstone of the Chromatography Data Systems Market, often representing a significant revenue share due to its widespread applicability and critical role in diverse industries. HPLC is indispensable for the separation, identification, and quantification of compounds, particularly in the pharmaceutical, biotechnology, environmental, and food and beverage sectors. The high resolution, sensitivity, and versatility of HPLC make it a preferred method for complex sample analysis, driving consistent demand for specialized Chromatography Data Systems tailored to its unique requirements.
Within the Chromatography Data Systems Market, CDS solutions for HPLC facilitate automated control of pumps, auto-samplers, and detectors, along with sophisticated data processing capabilities. These systems are crucial for managing the voluminous and often complex data generated by HPLC analyses, ensuring data integrity, reproducibility, and compliance with regulatory standards such as FDA 21 CFR Part 11. Key players in the Chromatography Data Systems Market continuously innovate to provide enhanced software features for HPLC, including advanced peak integration algorithms, customizable reporting, and streamlined method development tools. The integration of CDS with other laboratory information systems, such as Laboratory Information Management Systems Market, further enhances data flow and operational efficiency.
The dominance of the HPLC segment is further bolstered by the relentless pace of drug discovery and development, where HPLC is a fundamental tool for compound purity assessment, stability studies, and quality control. The robust demand from the Pharmaceutical Testing Market and Biotechnology Research Market directly translates into growth for HPLC-specific CDS solutions. While other techniques like gas chromatography also hold significant market shares, the sheer breadth of applications for HPLC, combined with ongoing advancements in column chemistries and detector technologies, ensures its continued prominence. As laboratories increasingly seek to standardize operations and improve data management, the High-Performance Liquid Chromatography Market for CDS solutions is expected to maintain its leading position, with an ongoing drive towards more intelligent, integrated, and compliant systems.
Key Market Drivers and Operational Dynamics in Chromatography Data Systems Market
The Chromatography Data Systems Market is principally driven by two major factors: the rising expenses on research and development (R&D) within the life sciences sector and the growing demand for food testing. Both drivers necessitate sophisticated data management and analytical precision, which CDS platforms are uniquely positioned to provide. The global R&D expenditure in life sciences has seen consistent year-over-year increases, with major pharmaceutical and biotechnology companies investing billions into drug discovery, development, and clinical trials. This substantial investment directly translates into a heightened demand for advanced analytical instrumentation and their accompanying CDS, as these systems are indispensable for compound identification, quantification, purity assessment, and stability studies. The increasing complexity of drug molecules and the need for high-throughput screening in modern R&D environments further amplify the reliance on robust and automated CDS solutions. For example, the expansion in biologics and gene therapy research requires highly accurate and traceable data from techniques like high-performance liquid chromatography, underscoring the vital role of the High-Performance Liquid Chromatography Market within this context.
Simultaneously, the growing demand for food testing due to heightened consumer awareness, stricter regulatory standards, and concerns over food safety and quality profoundly impacts the Chromatography Data Systems Market. Regulatory bodies globally are implementing more rigorous testing protocols for contaminants, allergens, and nutritional content in food products. This pushes food testing laboratories to adopt advanced analytical techniques such as gas chromatography and liquid chromatography, thereby increasing the deployment of comprehensive CDS. The demand for the Gas Chromatography Market solutions, in particular, benefits from this trend for volatile organic compound analysis. Furthermore, the trend towards digital transformation in laboratories, including the adoption of the Cloud-Based Software Market solutions, offers improved data accessibility and collaboration, which is critical for multinational food safety initiatives. While the provided data lists both drivers and restraints identically, indicating a potential data anomaly, common operational challenges often involve the high initial capital investment required for advanced analytical instruments and their associated software, as well as the need for highly skilled personnel to operate and maintain these sophisticated systems. Despite these challenges, the overriding imperative for data integrity and regulatory compliance in both life sciences R&D and food testing continues to fuel the expansion of the Analytical Instrumentation Market and its integral CDS component.
Customer Segmentation & Buying Behavior in Chromatography Data Systems Market
The customer base for the Chromatography Data Systems Market is diverse, primarily encompassing Pharmaceutical Companies, Biotechnology Companies, Contract Research Organizations (CROs), Contract Development and Manufacturing Organizations (CDMOs), and Academic and Research Institutes. Each segment exhibits distinct purchasing criteria, price sensitivities, and procurement channels. Pharmaceutical and Biotechnology Companies, being highly regulated entities, prioritize regulatory compliance (e.g., FDA 21 CFR Part 11), data integrity, audit trail capabilities, and seamless integration with existing Laboratory Information Management Systems Market (LIMS) and Enterprise Resource Planning (ERP) systems. Their purchasing decisions are often driven by long-term total cost of ownership, vendor reputation, and the availability of comprehensive validation services and technical support. Price sensitivity is relatively lower in large pharmaceutical enterprises compared to smaller biotech startups, which may seek more cost-effective or modular solutions.
CROs and CDMOs operate under similar regulatory pressures but often require highly flexible and scalable CDS solutions to manage diverse client projects and varying analytical workloads. Their buying behavior is influenced by the ability of CDS platforms to handle multi-vendor instrument integration, streamline data transfer to clients, and support rapid method development. Academic and Research Institutes, conversely, tend to be more price-sensitive and often prioritize open architecture, ease of use, and compatibility with a broad range of Scientific Instrumentation Market systems for various research applications. Procurement channels typically involve direct sales from leading vendors, specialized distributors, and increasingly, subscription-based models for Cloud-Based Software Market options. Recent cycles have shown a notable shift towards cloud-based and hybrid CDS deployments, reflecting a preference for remote access, enhanced data security, and reduced IT infrastructure burdens, especially among enterprises seeking to leverage the broader Life Sciences Analytics Market trends for improved operational insights and data utilization.
Regulatory & Policy Landscape Shaping Chromatography Data Systems Market
The Chromatography Data Systems Market operates within a stringent regulatory and policy landscape, particularly across key geographies like North America, Europe, and parts of Asia Pacific. The primary frameworks are established by regulatory bodies such as the U.S. Food and Drug Administration (FDA), the European Medicines Agency (EMA), and equivalent national authorities. A cornerstone of this landscape is the FDA's 21 CFR Part 11, which governs electronic records and electronic signatures, ensuring their trustworthiness, reliability, and equivalence to paper records. This regulation profoundly impacts the design, validation, and operational protocols of all CDS solutions used in pharmaceutical, biotechnology, and clinical testing environments. Compliance with 21 CFR Part 11 is a non-negotiable requirement for pharmaceutical companies and CROs, driving demand for CDS platforms that offer robust audit trails, user access controls, data encryption, and tamper-proof storage capabilities. The PerkinElmer GC 2400 Platform, for instance, explicitly highlights its 21 CFR Part 11 compliant SimplicityChrom chromatography data system, demonstrating the market's response to these mandates.
Beyond FDA regulations, guidelines from the International Council for Harmonisation of Technical Requirements for Pharmaceuticals for Human Use (ICH) and Good Manufacturing Practice (GMP), Good Laboratory Practice (GLP), and Good Clinical Practice (GCP) standards further dictate the operational requirements for data integrity and quality control in analytical laboratories. These policies mandate comprehensive validation of CDS software, rigorous change control procedures, and thorough documentation of all analytical processes. Recent policy changes, particularly those emphasizing data integrity and cybersecurity, have spurred innovation in the Chromatography Data Systems Market, pushing vendors to develop more secure, resilient, and traceable solutions. The emergence of SaaS applications like Waters Corporation's waters_connect System Monitoring underscores the trend towards compliant cloud infrastructure, addressing concerns related to data storage, access, and security while adhering to evolving regulatory expectations. The stringent nature of these policies ensures a continuous demand for highly compliant and feature-rich CDS, thereby shaping product development and market dynamics.
Competitive Ecosystem of Chromatography Data Systems Market
The Chromatography Data Systems Market is characterized by a mix of established analytical instrumentation giants and specialized software providers, all vying for market share through continuous innovation and strategic partnerships. The competitive landscape is intensely focused on enhancing data integrity, improving user experience, and ensuring regulatory compliance.
- Advanced Chemistry Development Inc: A company recognized for its analytical and cheminformatics software, focusing on solutions that integrate spectroscopy and chromatography data for chemical structure elucidation and property prediction.
- Agilent Technologies Inc: A global leader in life sciences, diagnostics, and applied chemical markets, offering comprehensive CDS solutions that integrate seamlessly with their extensive portfolio of chromatography and mass spectrometry instruments.
- Bio-Rad Laboratories Inc: Known for its life science research and clinical diagnostic products, Bio-Rad provides software platforms that support their chromatography systems, particularly in protein purification and analysis.
- Bruker Corporation: A prominent player in high-performance scientific instruments, Bruker offers specialized CDS integrated with their chromatography and mass spectrometry platforms, catering to advanced research and industrial applications.
- JASCO International Co Ltd: A Japanese manufacturer of scientific instruments, JASCO provides integrated CDS solutions for their chromatography and spectroscopy product lines, emphasizing precision and reliability.
- Justice Innovations Inc: A niche provider of chromatography data software, often catering to specific analytical needs and offering customized solutions for various laboratory environments.
- PerkinElmer Inc: A diversified technology company with a strong presence in diagnostics and life sciences, PerkinElmer offers robust CDS solutions like SimplicityChrom, designed for ease of use and regulatory compliance, as seen with their GC 2400 Platform launch.
- Shimadzu Corporation: A leading manufacturer of analytical instruments, Shimadzu provides comprehensive CDS platforms that are highly integrated with their gas and liquid chromatography systems, focusing on efficiency and data accuracy.
- Thermo Fisher Scientific Inc: A global scientific instrumentation powerhouse, Thermo Fisher offers a broad range of CDS products designed to support their extensive portfolio of chromatography and mass spectrometry instruments, catering to diverse scientific and industrial applications.
- Waters Corporation: A key innovator in the Chromatography Data Systems Market, Waters Corporation is well-regarded for its Empower CDS, a widely used platform. The company continues to enhance its offerings, as evidenced by the launch of waters_connect System Monitoring, a SaaS application for instrument monitoring, and partnerships like the one enabling Sciex Corporation's BioPhase 8800 driver integration with Empower.
Recent Developments & Milestones in Chromatography Data Systems Market
The Chromatography Data Systems Market has witnessed several strategic advancements and product launches in recent years, highlighting a focus on integration, cloud capabilities, and enhanced compliance. These developments underscore the industry's commitment to improving laboratory efficiency, data integrity, and analytical precision.
- May 2023: Sciex Corporation, a United States-based manufacturer of mass spectrometry instrumentation, launched the BioPhase 8800 driver. This significant development enables the easy integration of the BioPhase 8800 system with the Empower chromatography data system from Waters Corporation, demonstrating a trend towards seamless multi-vendor instrument compatibility within the Chromatography Data Systems Market and enhancing workflow efficiency for users of both platforms.
- January 2023: Waters Corporation announced the launch of waters_connect System Monitoring, a new Software-as-a-Service (SaaS) application. This innovative solution allows for the real-time status monitoring of any chromatography instruments, regardless of the manufacturer, that are running on Waters Empower Software. This move signifies a strong push towards cloud-based analytical infrastructure and remote laboratory management, addressing the growing demand for flexible and accessible data monitoring solutions within the Cloud-Based Software Market.
- June 2022: PerkinElmer Inc. launched the GC 2400 Platform, an advanced, automated gas chromatography, headspace sampler, and gas chromatography/mass spectrometry solution. A key feature of this platform is its 21 CFR Part 11 compliant SimplicityChrom chromatography data system, which is designed to simplify lab operations, drive precise results, and perform more flexible monitoring while reducing user training and guiding teams through the entire gas chromatography workflow. This development directly supports the needs of the Gas Chromatography Market by providing a compliant and user-friendly integrated solution.
Regional Market Breakdown for Chromatography Data Systems Market
The global Chromatography Data Systems Market exhibits significant regional variations in terms of adoption, growth drivers, and market maturity. While specific regional CAGRs and revenue shares are subject to proprietary market models, general trends indicate distinct dynamics across North America, Europe, Asia Pacific, and other emerging regions.
North America holds a substantial share of the Chromatography Data Systems Market, driven by a highly developed pharmaceutical and biotechnology industry, extensive R&D investments, and stringent regulatory frameworks. The United States, in particular, leads in adopting advanced analytical technologies and sophisticated CDS solutions, fueled by a large number of research institutes and key market players. The demand here is primarily for compliant, high-throughput systems that integrate with complex Laboratory Information Management Systems Market and support the rigorous requirements of the Pharmaceutical Testing Market.
Europe represents another mature market for Chromatography Data Systems, with countries like Germany, the United Kingdom, and France being major contributors. The region benefits from a strong life sciences sector, robust regulatory oversight from the EMA, and a focus on quality control in various industries. European countries are keen adopters of automation and digital transformation in laboratories, contributing to steady growth in the demand for advanced CDS solutions.
Asia Pacific is poised to be the fastest-growing region in the Chromatography Data Systems Market. Countries such as China, Japan, and India are experiencing rapid expansion in their pharmaceutical manufacturing, biotechnology research, and food testing sectors. Increasing investments in healthcare infrastructure, government initiatives supporting R&D, and the establishment of new contract research and manufacturing organizations are key demand drivers. The region's growing need for modern analytical tools and data management systems, including those supporting the Analytical Instrumentation Market, propels significant market expansion.
Other regions, including the Middle East and Africa and South America, are emerging markets for Chromatography Data Systems. While currently smaller in market share, these regions are witnessing gradual growth due to improving healthcare infrastructure, increasing industrialization, and rising awareness of product quality and safety standards. Growth here is often more nascent, driven by foundational investments in laboratory capabilities and the adoption of Scientific Instrumentation Market solutions. The overall demand for sophisticated data analysis and regulatory compliance is a global phenomenon, ensuring continued, albeit varied, growth across all major geographical segments within the Chromatography Data Systems Market.
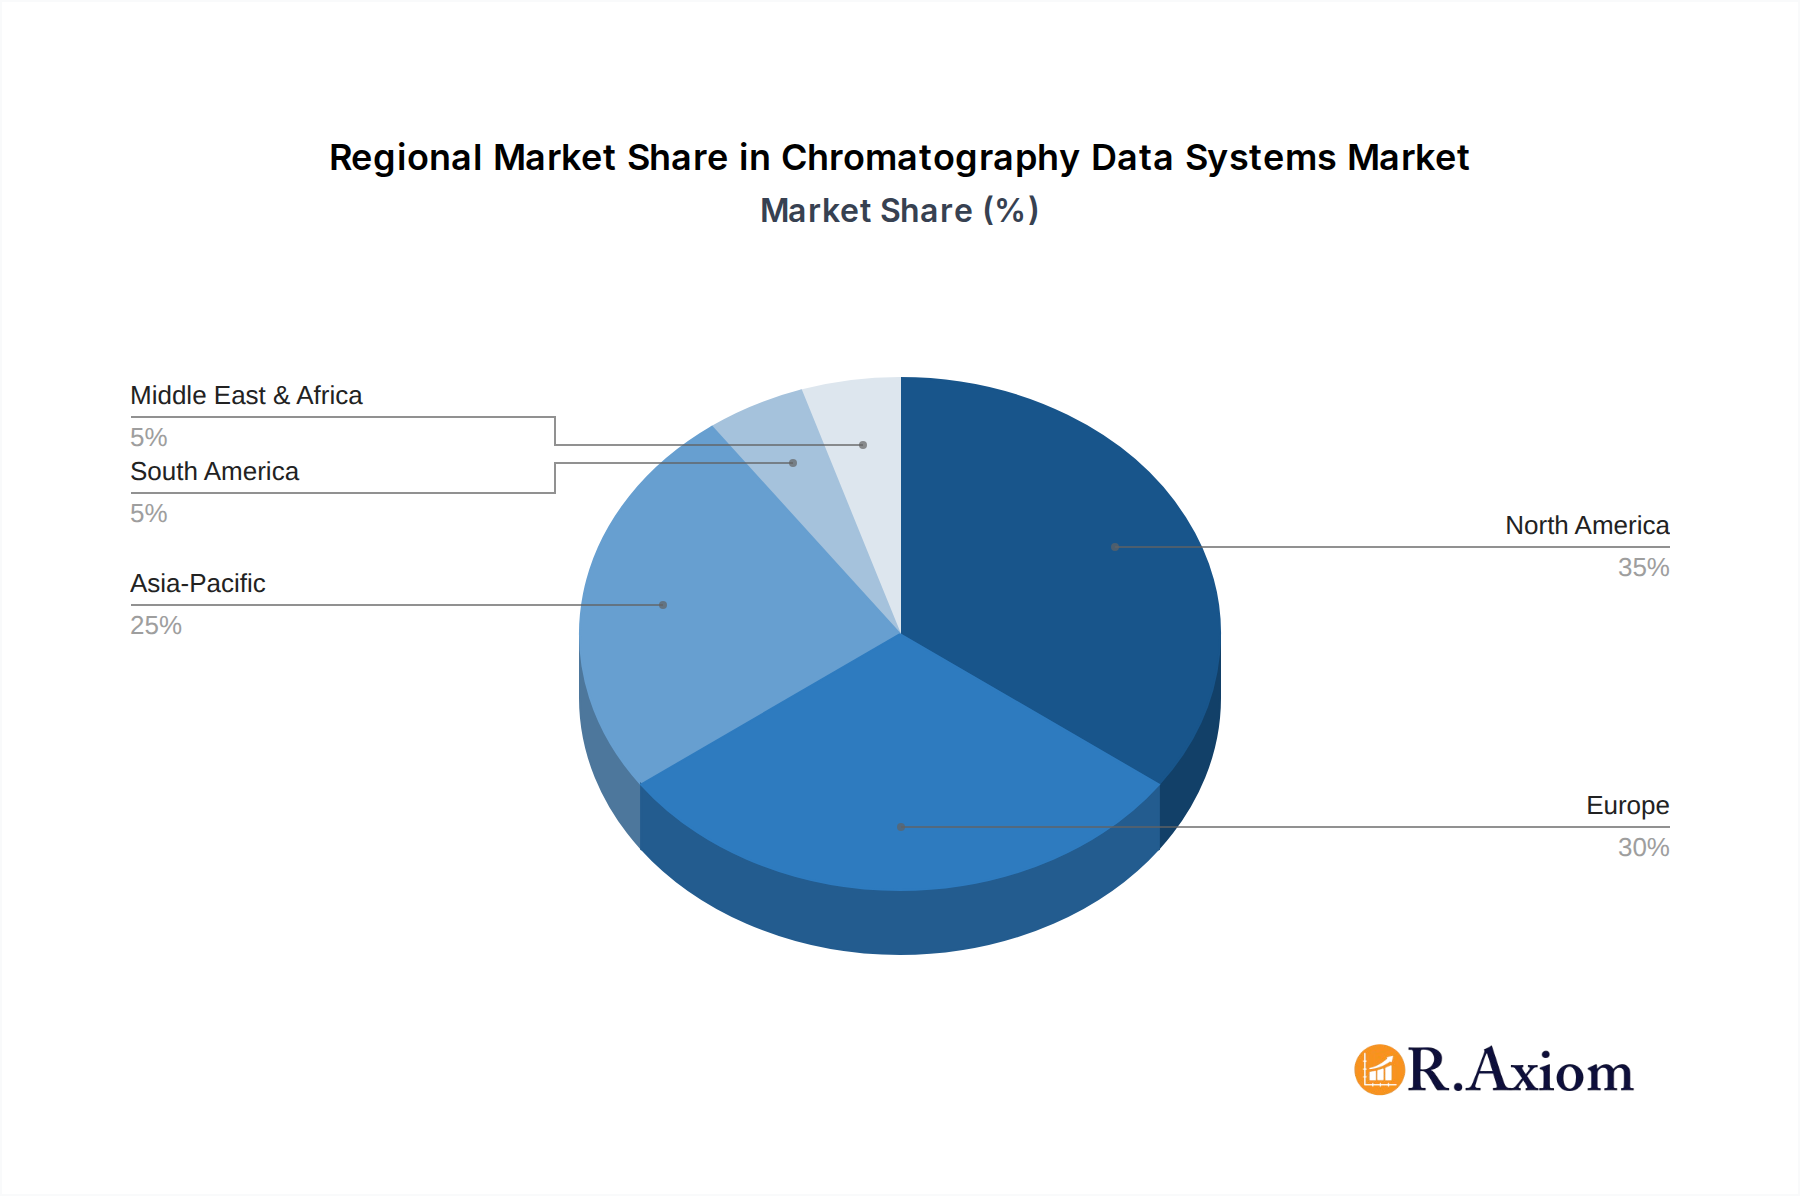
Chromatography Data Systems Market Regional Market Share
Chromatography Data Systems Market Segmentation
-
1. Type
- 1.1. Integrated CDS
- 1.2. Standalone CDS
-
2. Deployment Mode
- 2.1. On-Premise CDS
- 2.2. Cloud-Based CDS
- 2.3. Hybrid CDS
-
3. Enterprise Size
- 3.1. Large Enterprises
- 3.2. Small & Medium Enterprises (SMEs)
-
4. Technique
- 4.1. Gas Chromatography (GC)
- 4.2. High-Performance Liquid Chromatography (HPLC)
- 4.3. Ion Chromatography (IC)
- 4.4. Thin Layer Chromatography (TLC)
- 4.5. Supercritical Fluid Chromatography (SFC)
- 4.6. Others
-
5. End User
- 5.1. Pharmaceutical Companies
- 5.2. Biotechnology Companies
- 5.3. CROs
- 5.4. CDMOs
- 5.5. Academic and Research Institutes
- 5.6. Others
Chromatography Data Systems Market Segmentation By Geography
-
1. North America
- 1.1. United States
- 1.2. Canada
- 1.3. Mexico
-
2. Europe
- 2.1. Germany
- 2.2. United Kingdom
- 2.3. France
- 2.4. Italy
- 2.5. Spain
- 2.6. Rest of Europe
-
3. Asia Pacific
- 3.1. China
- 3.2. Japan
- 3.3. India
- 3.4. Australia
- 3.5. South Korea
- 3.6. Rest of Asia Pacific
-
4. Middle East and Africa
- 4.1. GCC
- 4.2. South Africa
- 4.3. Rest of Middle East and Africa
-
5. South America
- 5.1. Brazil
- 5.2. Argentina
- 5.3. Rest of South America
Chromatography Data Systems Market Regional Market Share
Geographic Coverage of Chromatography Data Systems Market
Chromatography Data Systems Market REPORT HIGHLIGHTS
| Aspects | Details |
|---|---|
| Study Period | 2020-2034 |
| Base Year | 2025 |
| Estimated Year | 2026 |
| Forecast Period | 2026-2034 |
| Historical Period | 2020-2025 |
| Growth Rate | CAGR of 7.92% from 2020-2034 |
| Segmentation |
|
Table of Contents
- 1. Introduction
- 1.1. Research Scope
- 1.2. Market Segmentation
- 1.3. Research Objective
- 1.4. Definitions and Assumptions
- 2. Executive Summary
- 2.1. Market Snapshot
- 3. Market Dynamics
- 3.1. Market Drivers
- 3.2. Market Restrains
- 3.3. Market Trends
- 3.4. Market Opportunities
- 4. Market Factor Analysis
- 4.1. Porters Five Forces
- 4.1.1. Bargaining Power of Suppliers
- 4.1.2. Bargaining Power of Buyers
- 4.1.3. Threat of New Entrants
- 4.1.4. Threat of Substitutes
- 4.1.5. Competitive Rivalry
- 4.2. PESTEL analysis
- 4.3. BCG Analysis
- 4.3.1. Stars (High Growth, High Market Share)
- 4.3.2. Cash Cows (Low Growth, High Market Share)
- 4.3.3. Question Mark (High Growth, Low Market Share)
- 4.3.4. Dogs (Low Growth, Low Market Share)
- 4.4. Ansoff Matrix Analysis
- 4.5. Supply Chain Analysis
- 4.6. Regulatory Landscape
- 4.7. Current Market Potential and Opportunity Assessment (TAM–SAM–SOM Framework)
- 4.8. RAX Analyst Note
- 4.1. Porters Five Forces
- 5. Market Analysis, Insights and Forecast 2021-2033
- 5.1. Market Analysis, Insights and Forecast - by Type
- 5.1.1. Integrated CDS
- 5.1.2. Standalone CDS
- 5.2. Market Analysis, Insights and Forecast - by Deployment Mode
- 5.2.1. On-Premise CDS
- 5.2.2. Cloud-Based CDS
- 5.2.3. Hybrid CDS
- 5.3. Market Analysis, Insights and Forecast - by Enterprise Size
- 5.3.1. Large Enterprises
- 5.3.2. Small & Medium Enterprises (SMEs)
- 5.4. Market Analysis, Insights and Forecast - by Technique
- 5.4.1. Gas Chromatography (GC)
- 5.4.2. High-Performance Liquid Chromatography (HPLC)
- 5.4.3. Ion Chromatography (IC)
- 5.4.4. Thin Layer Chromatography (TLC)
- 5.4.5. Supercritical Fluid Chromatography (SFC)
- 5.4.6. Others
- 5.5. Market Analysis, Insights and Forecast - by End User
- 5.5.1. Pharmaceutical Companies
- 5.5.2. Biotechnology Companies
- 5.5.3. CROs
- 5.5.4. CDMOs
- 5.5.5. Academic and Research Institutes
- 5.5.6. Others
- 5.6. Market Analysis, Insights and Forecast - by Region
- 5.6.1. North America
- 5.6.2. Europe
- 5.6.3. Asia Pacific
- 5.6.4. Middle East and Africa
- 5.6.5. South America
- 5.1. Market Analysis, Insights and Forecast - by Type
- 6. Global Chromatography Data Systems Market Analysis, Insights and Forecast, 2021-2033
- 6.1. Market Analysis, Insights and Forecast - by Type
- 6.1.1. Integrated CDS
- 6.1.2. Standalone CDS
- 6.2. Market Analysis, Insights and Forecast - by Deployment Mode
- 6.2.1. On-Premise CDS
- 6.2.2. Cloud-Based CDS
- 6.2.3. Hybrid CDS
- 6.3. Market Analysis, Insights and Forecast - by Enterprise Size
- 6.3.1. Large Enterprises
- 6.3.2. Small & Medium Enterprises (SMEs)
- 6.4. Market Analysis, Insights and Forecast - by Technique
- 6.4.1. Gas Chromatography (GC)
- 6.4.2. High-Performance Liquid Chromatography (HPLC)
- 6.4.3. Ion Chromatography (IC)
- 6.4.4. Thin Layer Chromatography (TLC)
- 6.4.5. Supercritical Fluid Chromatography (SFC)
- 6.4.6. Others
- 6.5. Market Analysis, Insights and Forecast - by End User
- 6.5.1. Pharmaceutical Companies
- 6.5.2. Biotechnology Companies
- 6.5.3. CROs
- 6.5.4. CDMOs
- 6.5.5. Academic and Research Institutes
- 6.5.6. Others
- 6.1. Market Analysis, Insights and Forecast - by Type
- 7. North America Chromatography Data Systems Market Analysis, Insights and Forecast, 2020-2032
- 7.1. Market Analysis, Insights and Forecast - by Type
- 7.1.1. Integrated CDS
- 7.1.2. Standalone CDS
- 7.2. Market Analysis, Insights and Forecast - by Deployment Mode
- 7.2.1. On-Premise CDS
- 7.2.2. Cloud-Based CDS
- 7.2.3. Hybrid CDS
- 7.3. Market Analysis, Insights and Forecast - by Enterprise Size
- 7.3.1. Large Enterprises
- 7.3.2. Small & Medium Enterprises (SMEs)
- 7.4. Market Analysis, Insights and Forecast - by Technique
- 7.4.1. Gas Chromatography (GC)
- 7.4.2. High-Performance Liquid Chromatography (HPLC)
- 7.4.3. Ion Chromatography (IC)
- 7.4.4. Thin Layer Chromatography (TLC)
- 7.4.5. Supercritical Fluid Chromatography (SFC)
- 7.4.6. Others
- 7.5. Market Analysis, Insights and Forecast - by End User
- 7.5.1. Pharmaceutical Companies
- 7.5.2. Biotechnology Companies
- 7.5.3. CROs
- 7.5.4. CDMOs
- 7.5.5. Academic and Research Institutes
- 7.5.6. Others
- 7.1. Market Analysis, Insights and Forecast - by Type
- 8. Europe Chromatography Data Systems Market Analysis, Insights and Forecast, 2020-2032
- 8.1. Market Analysis, Insights and Forecast - by Type
- 8.1.1. Integrated CDS
- 8.1.2. Standalone CDS
- 8.2. Market Analysis, Insights and Forecast - by Deployment Mode
- 8.2.1. On-Premise CDS
- 8.2.2. Cloud-Based CDS
- 8.2.3. Hybrid CDS
- 8.3. Market Analysis, Insights and Forecast - by Enterprise Size
- 8.3.1. Large Enterprises
- 8.3.2. Small & Medium Enterprises (SMEs)
- 8.4. Market Analysis, Insights and Forecast - by Technique
- 8.4.1. Gas Chromatography (GC)
- 8.4.2. High-Performance Liquid Chromatography (HPLC)
- 8.4.3. Ion Chromatography (IC)
- 8.4.4. Thin Layer Chromatography (TLC)
- 8.4.5. Supercritical Fluid Chromatography (SFC)
- 8.4.6. Others
- 8.5. Market Analysis, Insights and Forecast - by End User
- 8.5.1. Pharmaceutical Companies
- 8.5.2. Biotechnology Companies
- 8.5.3. CROs
- 8.5.4. CDMOs
- 8.5.5. Academic and Research Institutes
- 8.5.6. Others
- 8.1. Market Analysis, Insights and Forecast - by Type
- 9. Asia Pacific Chromatography Data Systems Market Analysis, Insights and Forecast, 2020-2032
- 9.1. Market Analysis, Insights and Forecast - by Type
- 9.1.1. Integrated CDS
- 9.1.2. Standalone CDS
- 9.2. Market Analysis, Insights and Forecast - by Deployment Mode
- 9.2.1. On-Premise CDS
- 9.2.2. Cloud-Based CDS
- 9.2.3. Hybrid CDS
- 9.3. Market Analysis, Insights and Forecast - by Enterprise Size
- 9.3.1. Large Enterprises
- 9.3.2. Small & Medium Enterprises (SMEs)
- 9.4. Market Analysis, Insights and Forecast - by Technique
- 9.4.1. Gas Chromatography (GC)
- 9.4.2. High-Performance Liquid Chromatography (HPLC)
- 9.4.3. Ion Chromatography (IC)
- 9.4.4. Thin Layer Chromatography (TLC)
- 9.4.5. Supercritical Fluid Chromatography (SFC)
- 9.4.6. Others
- 9.5. Market Analysis, Insights and Forecast - by End User
- 9.5.1. Pharmaceutical Companies
- 9.5.2. Biotechnology Companies
- 9.5.3. CROs
- 9.5.4. CDMOs
- 9.5.5. Academic and Research Institutes
- 9.5.6. Others
- 9.1. Market Analysis, Insights and Forecast - by Type
- 10. Middle East and Africa Chromatography Data Systems Market Analysis, Insights and Forecast, 2020-2032
- 10.1. Market Analysis, Insights and Forecast - by Type
- 10.1.1. Integrated CDS
- 10.1.2. Standalone CDS
- 10.2. Market Analysis, Insights and Forecast - by Deployment Mode
- 10.2.1. On-Premise CDS
- 10.2.2. Cloud-Based CDS
- 10.2.3. Hybrid CDS
- 10.3. Market Analysis, Insights and Forecast - by Enterprise Size
- 10.3.1. Large Enterprises
- 10.3.2. Small & Medium Enterprises (SMEs)
- 10.4. Market Analysis, Insights and Forecast - by Technique
- 10.4.1. Gas Chromatography (GC)
- 10.4.2. High-Performance Liquid Chromatography (HPLC)
- 10.4.3. Ion Chromatography (IC)
- 10.4.4. Thin Layer Chromatography (TLC)
- 10.4.5. Supercritical Fluid Chromatography (SFC)
- 10.4.6. Others
- 10.5. Market Analysis, Insights and Forecast - by End User
- 10.5.1. Pharmaceutical Companies
- 10.5.2. Biotechnology Companies
- 10.5.3. CROs
- 10.5.4. CDMOs
- 10.5.5. Academic and Research Institutes
- 10.5.6. Others
- 10.1. Market Analysis, Insights and Forecast - by Type
- 11. South America Chromatography Data Systems Market Analysis, Insights and Forecast, 2020-2032
- 11.1. Market Analysis, Insights and Forecast - by Type
- 11.1.1. Integrated CDS
- 11.1.2. Standalone CDS
- 11.2. Market Analysis, Insights and Forecast - by Deployment Mode
- 11.2.1. On-Premise CDS
- 11.2.2. Cloud-Based CDS
- 11.2.3. Hybrid CDS
- 11.3. Market Analysis, Insights and Forecast - by Enterprise Size
- 11.3.1. Large Enterprises
- 11.3.2. Small & Medium Enterprises (SMEs)
- 11.4. Market Analysis, Insights and Forecast - by Technique
- 11.4.1. Gas Chromatography (GC)
- 11.4.2. High-Performance Liquid Chromatography (HPLC)
- 11.4.3. Ion Chromatography (IC)
- 11.4.4. Thin Layer Chromatography (TLC)
- 11.4.5. Supercritical Fluid Chromatography (SFC)
- 11.4.6. Others
- 11.5. Market Analysis, Insights and Forecast - by End User
- 11.5.1. Pharmaceutical Companies
- 11.5.2. Biotechnology Companies
- 11.5.3. CROs
- 11.5.4. CDMOs
- 11.5.5. Academic and Research Institutes
- 11.5.6. Others
- 11.1. Market Analysis, Insights and Forecast - by Type
- 12. Competitive Analysis
- 12.1. Company Profiles
- 12.1.1 Advanced Chemistry Development Inc
- 12.1.1.1. Company Overview
- 12.1.1.2. Products
- 12.1.1.3. Company Financials
- 12.1.1.4. SWOT Analysis
- 12.1.2 Agilent Technologies Inc
- 12.1.2.1. Company Overview
- 12.1.2.2. Products
- 12.1.2.3. Company Financials
- 12.1.2.4. SWOT Analysis
- 12.1.3 Bio-Rad Laboratories Inc
- 12.1.3.1. Company Overview
- 12.1.3.2. Products
- 12.1.3.3. Company Financials
- 12.1.3.4. SWOT Analysis
- 12.1.4 Bruker Corporation
- 12.1.4.1. Company Overview
- 12.1.4.2. Products
- 12.1.4.3. Company Financials
- 12.1.4.4. SWOT Analysis
- 12.1.5 JASCO International Co Ltd
- 12.1.5.1. Company Overview
- 12.1.5.2. Products
- 12.1.5.3. Company Financials
- 12.1.5.4. SWOT Analysis
- 12.1.6 Justice Innovations Inc
- 12.1.6.1. Company Overview
- 12.1.6.2. Products
- 12.1.6.3. Company Financials
- 12.1.6.4. SWOT Analysis
- 12.1.7 PerkinElmer Inc
- 12.1.7.1. Company Overview
- 12.1.7.2. Products
- 12.1.7.3. Company Financials
- 12.1.7.4. SWOT Analysis
- 12.1.8 Shimadzu Corporation
- 12.1.8.1. Company Overview
- 12.1.8.2. Products
- 12.1.8.3. Company Financials
- 12.1.8.4. SWOT Analysis
- 12.1.9 Thermo Fisher Scientific Inc
- 12.1.9.1. Company Overview
- 12.1.9.2. Products
- 12.1.9.3. Company Financials
- 12.1.9.4. SWOT Analysis
- 12.1.10 Waters Corporatio
- 12.1.10.1. Company Overview
- 12.1.10.2. Products
- 12.1.10.3. Company Financials
- 12.1.10.4. SWOT Analysis
- 12.1.1 Advanced Chemistry Development Inc
- 12.2. Market Entropy
- 12.2.1 Company's Key Areas Served
- 12.2.2 Recent Developments
- 12.3. Company Market Share Analysis 2025
- 12.3.1 Top 5 Companies Market Share Analysis
- 12.3.2 Top 3 Companies Market Share Analysis
- 12.4. List of Potential Customers
- 13. Research Methodology
List of Figures
- Figure 1: Global Chromatography Data Systems Market Revenue Breakdown (Million, %) by Region 2025 & 2033
- Figure 2: Global Chromatography Data Systems Market Volume Breakdown (Million, %) by Region 2025 & 2033
- Figure 3: North America Chromatography Data Systems Market Revenue (Million), by Type 2025 & 2033
- Figure 4: North America Chromatography Data Systems Market Volume (Million), by Type 2025 & 2033
- Figure 5: North America Chromatography Data Systems Market Revenue Share (%), by Type 2025 & 2033
- Figure 6: North America Chromatography Data Systems Market Volume Share (%), by Type 2025 & 2033
- Figure 7: North America Chromatography Data Systems Market Revenue (Million), by Deployment Mode 2025 & 2033
- Figure 8: North America Chromatography Data Systems Market Volume (Million), by Deployment Mode 2025 & 2033
- Figure 9: North America Chromatography Data Systems Market Revenue Share (%), by Deployment Mode 2025 & 2033
- Figure 10: North America Chromatography Data Systems Market Volume Share (%), by Deployment Mode 2025 & 2033
- Figure 11: North America Chromatography Data Systems Market Revenue (Million), by Enterprise Size 2025 & 2033
- Figure 12: North America Chromatography Data Systems Market Volume (Million), by Enterprise Size 2025 & 2033
- Figure 13: North America Chromatography Data Systems Market Revenue Share (%), by Enterprise Size 2025 & 2033
- Figure 14: North America Chromatography Data Systems Market Volume Share (%), by Enterprise Size 2025 & 2033
- Figure 15: North America Chromatography Data Systems Market Revenue (Million), by Technique 2025 & 2033
- Figure 16: North America Chromatography Data Systems Market Volume (Million), by Technique 2025 & 2033
- Figure 17: North America Chromatography Data Systems Market Revenue Share (%), by Technique 2025 & 2033
- Figure 18: North America Chromatography Data Systems Market Volume Share (%), by Technique 2025 & 2033
- Figure 19: North America Chromatography Data Systems Market Revenue (Million), by End User 2025 & 2033
- Figure 20: North America Chromatography Data Systems Market Volume (Million), by End User 2025 & 2033
- Figure 21: North America Chromatography Data Systems Market Revenue Share (%), by End User 2025 & 2033
- Figure 22: North America Chromatography Data Systems Market Volume Share (%), by End User 2025 & 2033
- Figure 23: North America Chromatography Data Systems Market Revenue (Million), by Country 2025 & 2033
- Figure 24: North America Chromatography Data Systems Market Volume (Million), by Country 2025 & 2033
- Figure 25: North America Chromatography Data Systems Market Revenue Share (%), by Country 2025 & 2033
- Figure 26: North America Chromatography Data Systems Market Volume Share (%), by Country 2025 & 2033
- Figure 27: Europe Chromatography Data Systems Market Revenue (Million), by Type 2025 & 2033
- Figure 28: Europe Chromatography Data Systems Market Volume (Million), by Type 2025 & 2033
- Figure 29: Europe Chromatography Data Systems Market Revenue Share (%), by Type 2025 & 2033
- Figure 30: Europe Chromatography Data Systems Market Volume Share (%), by Type 2025 & 2033
- Figure 31: Europe Chromatography Data Systems Market Revenue (Million), by Deployment Mode 2025 & 2033
- Figure 32: Europe Chromatography Data Systems Market Volume (Million), by Deployment Mode 2025 & 2033
- Figure 33: Europe Chromatography Data Systems Market Revenue Share (%), by Deployment Mode 2025 & 2033
- Figure 34: Europe Chromatography Data Systems Market Volume Share (%), by Deployment Mode 2025 & 2033
- Figure 35: Europe Chromatography Data Systems Market Revenue (Million), by Enterprise Size 2025 & 2033
- Figure 36: Europe Chromatography Data Systems Market Volume (Million), by Enterprise Size 2025 & 2033
- Figure 37: Europe Chromatography Data Systems Market Revenue Share (%), by Enterprise Size 2025 & 2033
- Figure 38: Europe Chromatography Data Systems Market Volume Share (%), by Enterprise Size 2025 & 2033
- Figure 39: Europe Chromatography Data Systems Market Revenue (Million), by Technique 2025 & 2033
- Figure 40: Europe Chromatography Data Systems Market Volume (Million), by Technique 2025 & 2033
- Figure 41: Europe Chromatography Data Systems Market Revenue Share (%), by Technique 2025 & 2033
- Figure 42: Europe Chromatography Data Systems Market Volume Share (%), by Technique 2025 & 2033
- Figure 43: Europe Chromatography Data Systems Market Revenue (Million), by End User 2025 & 2033
- Figure 44: Europe Chromatography Data Systems Market Volume (Million), by End User 2025 & 2033
- Figure 45: Europe Chromatography Data Systems Market Revenue Share (%), by End User 2025 & 2033
- Figure 46: Europe Chromatography Data Systems Market Volume Share (%), by End User 2025 & 2033
- Figure 47: Europe Chromatography Data Systems Market Revenue (Million), by Country 2025 & 2033
- Figure 48: Europe Chromatography Data Systems Market Volume (Million), by Country 2025 & 2033
- Figure 49: Europe Chromatography Data Systems Market Revenue Share (%), by Country 2025 & 2033
- Figure 50: Europe Chromatography Data Systems Market Volume Share (%), by Country 2025 & 2033
- Figure 51: Asia Pacific Chromatography Data Systems Market Revenue (Million), by Type 2025 & 2033
- Figure 52: Asia Pacific Chromatography Data Systems Market Volume (Million), by Type 2025 & 2033
- Figure 53: Asia Pacific Chromatography Data Systems Market Revenue Share (%), by Type 2025 & 2033
- Figure 54: Asia Pacific Chromatography Data Systems Market Volume Share (%), by Type 2025 & 2033
- Figure 55: Asia Pacific Chromatography Data Systems Market Revenue (Million), by Deployment Mode 2025 & 2033
- Figure 56: Asia Pacific Chromatography Data Systems Market Volume (Million), by Deployment Mode 2025 & 2033
- Figure 57: Asia Pacific Chromatography Data Systems Market Revenue Share (%), by Deployment Mode 2025 & 2033
- Figure 58: Asia Pacific Chromatography Data Systems Market Volume Share (%), by Deployment Mode 2025 & 2033
- Figure 59: Asia Pacific Chromatography Data Systems Market Revenue (Million), by Enterprise Size 2025 & 2033
- Figure 60: Asia Pacific Chromatography Data Systems Market Volume (Million), by Enterprise Size 2025 & 2033
- Figure 61: Asia Pacific Chromatography Data Systems Market Revenue Share (%), by Enterprise Size 2025 & 2033
- Figure 62: Asia Pacific Chromatography Data Systems Market Volume Share (%), by Enterprise Size 2025 & 2033
- Figure 63: Asia Pacific Chromatography Data Systems Market Revenue (Million), by Technique 2025 & 2033
- Figure 64: Asia Pacific Chromatography Data Systems Market Volume (Million), by Technique 2025 & 2033
- Figure 65: Asia Pacific Chromatography Data Systems Market Revenue Share (%), by Technique 2025 & 2033
- Figure 66: Asia Pacific Chromatography Data Systems Market Volume Share (%), by Technique 2025 & 2033
- Figure 67: Asia Pacific Chromatography Data Systems Market Revenue (Million), by End User 2025 & 2033
- Figure 68: Asia Pacific Chromatography Data Systems Market Volume (Million), by End User 2025 & 2033
- Figure 69: Asia Pacific Chromatography Data Systems Market Revenue Share (%), by End User 2025 & 2033
- Figure 70: Asia Pacific Chromatography Data Systems Market Volume Share (%), by End User 2025 & 2033
- Figure 71: Asia Pacific Chromatography Data Systems Market Revenue (Million), by Country 2025 & 2033
- Figure 72: Asia Pacific Chromatography Data Systems Market Volume (Million), by Country 2025 & 2033
- Figure 73: Asia Pacific Chromatography Data Systems Market Revenue Share (%), by Country 2025 & 2033
- Figure 74: Asia Pacific Chromatography Data Systems Market Volume Share (%), by Country 2025 & 2033
- Figure 75: Middle East and Africa Chromatography Data Systems Market Revenue (Million), by Type 2025 & 2033
- Figure 76: Middle East and Africa Chromatography Data Systems Market Volume (Million), by Type 2025 & 2033
- Figure 77: Middle East and Africa Chromatography Data Systems Market Revenue Share (%), by Type 2025 & 2033
- Figure 78: Middle East and Africa Chromatography Data Systems Market Volume Share (%), by Type 2025 & 2033
- Figure 79: Middle East and Africa Chromatography Data Systems Market Revenue (Million), by Deployment Mode 2025 & 2033
- Figure 80: Middle East and Africa Chromatography Data Systems Market Volume (Million), by Deployment Mode 2025 & 2033
- Figure 81: Middle East and Africa Chromatography Data Systems Market Revenue Share (%), by Deployment Mode 2025 & 2033
- Figure 82: Middle East and Africa Chromatography Data Systems Market Volume Share (%), by Deployment Mode 2025 & 2033
- Figure 83: Middle East and Africa Chromatography Data Systems Market Revenue (Million), by Enterprise Size 2025 & 2033
- Figure 84: Middle East and Africa Chromatography Data Systems Market Volume (Million), by Enterprise Size 2025 & 2033
- Figure 85: Middle East and Africa Chromatography Data Systems Market Revenue Share (%), by Enterprise Size 2025 & 2033
- Figure 86: Middle East and Africa Chromatography Data Systems Market Volume Share (%), by Enterprise Size 2025 & 2033
- Figure 87: Middle East and Africa Chromatography Data Systems Market Revenue (Million), by Technique 2025 & 2033
- Figure 88: Middle East and Africa Chromatography Data Systems Market Volume (Million), by Technique 2025 & 2033
- Figure 89: Middle East and Africa Chromatography Data Systems Market Revenue Share (%), by Technique 2025 & 2033
- Figure 90: Middle East and Africa Chromatography Data Systems Market Volume Share (%), by Technique 2025 & 2033
- Figure 91: Middle East and Africa Chromatography Data Systems Market Revenue (Million), by End User 2025 & 2033
- Figure 92: Middle East and Africa Chromatography Data Systems Market Volume (Million), by End User 2025 & 2033
- Figure 93: Middle East and Africa Chromatography Data Systems Market Revenue Share (%), by End User 2025 & 2033
- Figure 94: Middle East and Africa Chromatography Data Systems Market Volume Share (%), by End User 2025 & 2033
- Figure 95: Middle East and Africa Chromatography Data Systems Market Revenue (Million), by Country 2025 & 2033
- Figure 96: Middle East and Africa Chromatography Data Systems Market Volume (Million), by Country 2025 & 2033
- Figure 97: Middle East and Africa Chromatography Data Systems Market Revenue Share (%), by Country 2025 & 2033
- Figure 98: Middle East and Africa Chromatography Data Systems Market Volume Share (%), by Country 2025 & 2033
- Figure 99: South America Chromatography Data Systems Market Revenue (Million), by Type 2025 & 2033
- Figure 100: South America Chromatography Data Systems Market Volume (Million), by Type 2025 & 2033
- Figure 101: South America Chromatography Data Systems Market Revenue Share (%), by Type 2025 & 2033
- Figure 102: South America Chromatography Data Systems Market Volume Share (%), by Type 2025 & 2033
- Figure 103: South America Chromatography Data Systems Market Revenue (Million), by Deployment Mode 2025 & 2033
- Figure 104: South America Chromatography Data Systems Market Volume (Million), by Deployment Mode 2025 & 2033
- Figure 105: South America Chromatography Data Systems Market Revenue Share (%), by Deployment Mode 2025 & 2033
- Figure 106: South America Chromatography Data Systems Market Volume Share (%), by Deployment Mode 2025 & 2033
- Figure 107: South America Chromatography Data Systems Market Revenue (Million), by Enterprise Size 2025 & 2033
- Figure 108: South America Chromatography Data Systems Market Volume (Million), by Enterprise Size 2025 & 2033
- Figure 109: South America Chromatography Data Systems Market Revenue Share (%), by Enterprise Size 2025 & 2033
- Figure 110: South America Chromatography Data Systems Market Volume Share (%), by Enterprise Size 2025 & 2033
- Figure 111: South America Chromatography Data Systems Market Revenue (Million), by Technique 2025 & 2033
- Figure 112: South America Chromatography Data Systems Market Volume (Million), by Technique 2025 & 2033
- Figure 113: South America Chromatography Data Systems Market Revenue Share (%), by Technique 2025 & 2033
- Figure 114: South America Chromatography Data Systems Market Volume Share (%), by Technique 2025 & 2033
- Figure 115: South America Chromatography Data Systems Market Revenue (Million), by End User 2025 & 2033
- Figure 116: South America Chromatography Data Systems Market Volume (Million), by End User 2025 & 2033
- Figure 117: South America Chromatography Data Systems Market Revenue Share (%), by End User 2025 & 2033
- Figure 118: South America Chromatography Data Systems Market Volume Share (%), by End User 2025 & 2033
- Figure 119: South America Chromatography Data Systems Market Revenue (Million), by Country 2025 & 2033
- Figure 120: South America Chromatography Data Systems Market Volume (Million), by Country 2025 & 2033
- Figure 121: South America Chromatography Data Systems Market Revenue Share (%), by Country 2025 & 2033
- Figure 122: South America Chromatography Data Systems Market Volume Share (%), by Country 2025 & 2033
List of Tables
- Table 1: Global Chromatography Data Systems Market Revenue Million Forecast, by Type 2020 & 2033
- Table 2: Global Chromatography Data Systems Market Volume Million Forecast, by Type 2020 & 2033
- Table 3: Global Chromatography Data Systems Market Revenue Million Forecast, by Deployment Mode 2020 & 2033
- Table 4: Global Chromatography Data Systems Market Volume Million Forecast, by Deployment Mode 2020 & 2033
- Table 5: Global Chromatography Data Systems Market Revenue Million Forecast, by Enterprise Size 2020 & 2033
- Table 6: Global Chromatography Data Systems Market Volume Million Forecast, by Enterprise Size 2020 & 2033
- Table 7: Global Chromatography Data Systems Market Revenue Million Forecast, by Technique 2020 & 2033
- Table 8: Global Chromatography Data Systems Market Volume Million Forecast, by Technique 2020 & 2033
- Table 9: Global Chromatography Data Systems Market Revenue Million Forecast, by End User 2020 & 2033
- Table 10: Global Chromatography Data Systems Market Volume Million Forecast, by End User 2020 & 2033
- Table 11: Global Chromatography Data Systems Market Revenue Million Forecast, by Region 2020 & 2033
- Table 12: Global Chromatography Data Systems Market Volume Million Forecast, by Region 2020 & 2033
- Table 13: Global Chromatography Data Systems Market Revenue Million Forecast, by Type 2020 & 2033
- Table 14: Global Chromatography Data Systems Market Volume Million Forecast, by Type 2020 & 2033
- Table 15: Global Chromatography Data Systems Market Revenue Million Forecast, by Deployment Mode 2020 & 2033
- Table 16: Global Chromatography Data Systems Market Volume Million Forecast, by Deployment Mode 2020 & 2033
- Table 17: Global Chromatography Data Systems Market Revenue Million Forecast, by Enterprise Size 2020 & 2033
- Table 18: Global Chromatography Data Systems Market Volume Million Forecast, by Enterprise Size 2020 & 2033
- Table 19: Global Chromatography Data Systems Market Revenue Million Forecast, by Technique 2020 & 2033
- Table 20: Global Chromatography Data Systems Market Volume Million Forecast, by Technique 2020 & 2033
- Table 21: Global Chromatography Data Systems Market Revenue Million Forecast, by End User 2020 & 2033
- Table 22: Global Chromatography Data Systems Market Volume Million Forecast, by End User 2020 & 2033
- Table 23: Global Chromatography Data Systems Market Revenue Million Forecast, by Country 2020 & 2033
- Table 24: Global Chromatography Data Systems Market Volume Million Forecast, by Country 2020 & 2033
- Table 25: United States Chromatography Data Systems Market Revenue (Million) Forecast, by Application 2020 & 2033
- Table 26: United States Chromatography Data Systems Market Volume (Million) Forecast, by Application 2020 & 2033
- Table 27: Canada Chromatography Data Systems Market Revenue (Million) Forecast, by Application 2020 & 2033
- Table 28: Canada Chromatography Data Systems Market Volume (Million) Forecast, by Application 2020 & 2033
- Table 29: Mexico Chromatography Data Systems Market Revenue (Million) Forecast, by Application 2020 & 2033
- Table 30: Mexico Chromatography Data Systems Market Volume (Million) Forecast, by Application 2020 & 2033
- Table 31: Global Chromatography Data Systems Market Revenue Million Forecast, by Type 2020 & 2033
- Table 32: Global Chromatography Data Systems Market Volume Million Forecast, by Type 2020 & 2033
- Table 33: Global Chromatography Data Systems Market Revenue Million Forecast, by Deployment Mode 2020 & 2033
- Table 34: Global Chromatography Data Systems Market Volume Million Forecast, by Deployment Mode 2020 & 2033
- Table 35: Global Chromatography Data Systems Market Revenue Million Forecast, by Enterprise Size 2020 & 2033
- Table 36: Global Chromatography Data Systems Market Volume Million Forecast, by Enterprise Size 2020 & 2033
- Table 37: Global Chromatography Data Systems Market Revenue Million Forecast, by Technique 2020 & 2033
- Table 38: Global Chromatography Data Systems Market Volume Million Forecast, by Technique 2020 & 2033
- Table 39: Global Chromatography Data Systems Market Revenue Million Forecast, by End User 2020 & 2033
- Table 40: Global Chromatography Data Systems Market Volume Million Forecast, by End User 2020 & 2033
- Table 41: Global Chromatography Data Systems Market Revenue Million Forecast, by Country 2020 & 2033
- Table 42: Global Chromatography Data Systems Market Volume Million Forecast, by Country 2020 & 2033
- Table 43: Germany Chromatography Data Systems Market Revenue (Million) Forecast, by Application 2020 & 2033
- Table 44: Germany Chromatography Data Systems Market Volume (Million) Forecast, by Application 2020 & 2033
- Table 45: United Kingdom Chromatography Data Systems Market Revenue (Million) Forecast, by Application 2020 & 2033
- Table 46: United Kingdom Chromatography Data Systems Market Volume (Million) Forecast, by Application 2020 & 2033
- Table 47: France Chromatography Data Systems Market Revenue (Million) Forecast, by Application 2020 & 2033
- Table 48: France Chromatography Data Systems Market Volume (Million) Forecast, by Application 2020 & 2033
- Table 49: Italy Chromatography Data Systems Market Revenue (Million) Forecast, by Application 2020 & 2033
- Table 50: Italy Chromatography Data Systems Market Volume (Million) Forecast, by Application 2020 & 2033
- Table 51: Spain Chromatography Data Systems Market Revenue (Million) Forecast, by Application 2020 & 2033
- Table 52: Spain Chromatography Data Systems Market Volume (Million) Forecast, by Application 2020 & 2033
- Table 53: Rest of Europe Chromatography Data Systems Market Revenue (Million) Forecast, by Application 2020 & 2033
- Table 54: Rest of Europe Chromatography Data Systems Market Volume (Million) Forecast, by Application 2020 & 2033
- Table 55: Global Chromatography Data Systems Market Revenue Million Forecast, by Type 2020 & 2033
- Table 56: Global Chromatography Data Systems Market Volume Million Forecast, by Type 2020 & 2033
- Table 57: Global Chromatography Data Systems Market Revenue Million Forecast, by Deployment Mode 2020 & 2033
- Table 58: Global Chromatography Data Systems Market Volume Million Forecast, by Deployment Mode 2020 & 2033
- Table 59: Global Chromatography Data Systems Market Revenue Million Forecast, by Enterprise Size 2020 & 2033
- Table 60: Global Chromatography Data Systems Market Volume Million Forecast, by Enterprise Size 2020 & 2033
- Table 61: Global Chromatography Data Systems Market Revenue Million Forecast, by Technique 2020 & 2033
- Table 62: Global Chromatography Data Systems Market Volume Million Forecast, by Technique 2020 & 2033
- Table 63: Global Chromatography Data Systems Market Revenue Million Forecast, by End User 2020 & 2033
- Table 64: Global Chromatography Data Systems Market Volume Million Forecast, by End User 2020 & 2033
- Table 65: Global Chromatography Data Systems Market Revenue Million Forecast, by Country 2020 & 2033
- Table 66: Global Chromatography Data Systems Market Volume Million Forecast, by Country 2020 & 2033
- Table 67: China Chromatography Data Systems Market Revenue (Million) Forecast, by Application 2020 & 2033
- Table 68: China Chromatography Data Systems Market Volume (Million) Forecast, by Application 2020 & 2033
- Table 69: Japan Chromatography Data Systems Market Revenue (Million) Forecast, by Application 2020 & 2033
- Table 70: Japan Chromatography Data Systems Market Volume (Million) Forecast, by Application 2020 & 2033
- Table 71: India Chromatography Data Systems Market Revenue (Million) Forecast, by Application 2020 & 2033
- Table 72: India Chromatography Data Systems Market Volume (Million) Forecast, by Application 2020 & 2033
- Table 73: Australia Chromatography Data Systems Market Revenue (Million) Forecast, by Application 2020 & 2033
- Table 74: Australia Chromatography Data Systems Market Volume (Million) Forecast, by Application 2020 & 2033
- Table 75: South Korea Chromatography Data Systems Market Revenue (Million) Forecast, by Application 2020 & 2033
- Table 76: South Korea Chromatography Data Systems Market Volume (Million) Forecast, by Application 2020 & 2033
- Table 77: Rest of Asia Pacific Chromatography Data Systems Market Revenue (Million) Forecast, by Application 2020 & 2033
- Table 78: Rest of Asia Pacific Chromatography Data Systems Market Volume (Million) Forecast, by Application 2020 & 2033
- Table 79: Global Chromatography Data Systems Market Revenue Million Forecast, by Type 2020 & 2033
- Table 80: Global Chromatography Data Systems Market Volume Million Forecast, by Type 2020 & 2033
- Table 81: Global Chromatography Data Systems Market Revenue Million Forecast, by Deployment Mode 2020 & 2033
- Table 82: Global Chromatography Data Systems Market Volume Million Forecast, by Deployment Mode 2020 & 2033
- Table 83: Global Chromatography Data Systems Market Revenue Million Forecast, by Enterprise Size 2020 & 2033
- Table 84: Global Chromatography Data Systems Market Volume Million Forecast, by Enterprise Size 2020 & 2033
- Table 85: Global Chromatography Data Systems Market Revenue Million Forecast, by Technique 2020 & 2033
- Table 86: Global Chromatography Data Systems Market Volume Million Forecast, by Technique 2020 & 2033
- Table 87: Global Chromatography Data Systems Market Revenue Million Forecast, by End User 2020 & 2033
- Table 88: Global Chromatography Data Systems Market Volume Million Forecast, by End User 2020 & 2033
- Table 89: Global Chromatography Data Systems Market Revenue Million Forecast, by Country 2020 & 2033
- Table 90: Global Chromatography Data Systems Market Volume Million Forecast, by Country 2020 & 2033
- Table 91: GCC Chromatography Data Systems Market Revenue (Million) Forecast, by Application 2020 & 2033
- Table 92: GCC Chromatography Data Systems Market Volume (Million) Forecast, by Application 2020 & 2033
- Table 93: South Africa Chromatography Data Systems Market Revenue (Million) Forecast, by Application 2020 & 2033
- Table 94: South Africa Chromatography Data Systems Market Volume (Million) Forecast, by Application 2020 & 2033
- Table 95: Rest of Middle East and Africa Chromatography Data Systems Market Revenue (Million) Forecast, by Application 2020 & 2033
- Table 96: Rest of Middle East and Africa Chromatography Data Systems Market Volume (Million) Forecast, by Application 2020 & 2033
- Table 97: Global Chromatography Data Systems Market Revenue Million Forecast, by Type 2020 & 2033
- Table 98: Global Chromatography Data Systems Market Volume Million Forecast, by Type 2020 & 2033
- Table 99: Global Chromatography Data Systems Market Revenue Million Forecast, by Deployment Mode 2020 & 2033
- Table 100: Global Chromatography Data Systems Market Volume Million Forecast, by Deployment Mode 2020 & 2033
- Table 101: Global Chromatography Data Systems Market Revenue Million Forecast, by Enterprise Size 2020 & 2033
- Table 102: Global Chromatography Data Systems Market Volume Million Forecast, by Enterprise Size 2020 & 2033
- Table 103: Global Chromatography Data Systems Market Revenue Million Forecast, by Technique 2020 & 2033
- Table 104: Global Chromatography Data Systems Market Volume Million Forecast, by Technique 2020 & 2033
- Table 105: Global Chromatography Data Systems Market Revenue Million Forecast, by End User 2020 & 2033
- Table 106: Global Chromatography Data Systems Market Volume Million Forecast, by End User 2020 & 2033
- Table 107: Global Chromatography Data Systems Market Revenue Million Forecast, by Country 2020 & 2033
- Table 108: Global Chromatography Data Systems Market Volume Million Forecast, by Country 2020 & 2033
- Table 109: Brazil Chromatography Data Systems Market Revenue (Million) Forecast, by Application 2020 & 2033
- Table 110: Brazil Chromatography Data Systems Market Volume (Million) Forecast, by Application 2020 & 2033
- Table 111: Argentina Chromatography Data Systems Market Revenue (Million) Forecast, by Application 2020 & 2033
- Table 112: Argentina Chromatography Data Systems Market Volume (Million) Forecast, by Application 2020 & 2033
- Table 113: Rest of South America Chromatography Data Systems Market Revenue (Million) Forecast, by Application 2020 & 2033
- Table 114: Rest of South America Chromatography Data Systems Market Volume (Million) Forecast, by Application 2020 & 2033
Frequently Asked Questions
1. What is the projected Compound Annual Growth Rate (CAGR) of the Chromatography Data Systems Market?
The projected CAGR is approximately 7.92%.
2. Which companies are prominent players in the Chromatography Data Systems Market?
Key companies in the market include Advanced Chemistry Development Inc, Agilent Technologies Inc, Bio-Rad Laboratories Inc, Bruker Corporation, JASCO International Co Ltd, Justice Innovations Inc, PerkinElmer Inc, Shimadzu Corporation, Thermo Fisher Scientific Inc, Waters Corporatio.
3. What are the main segments of the Chromatography Data Systems Market?
The market segments include Type, Deployment Mode, Enterprise Size, Technique, End User.
4. Can you provide details about the market size?
The market size is estimated to be USD 506.63 Million as of 2022.
5. What are some drivers contributing to market growth?
Rising Expenses on Research and Development From Life Sciences Sector; Growing Demand for Food Testing.
6. What are the notable trends driving market growth?
The Cloud Segment is Expected to Witness Substantial Growth Over the Forecast Period.
7. Are there any restraints impacting market growth?
Rising Expenses on Research and Development From Life Sciences Sector; Growing Demand for Food Testing.
8. Can you provide examples of recent developments in the market?
May 2023: Sciex Corporation, a United States-based manufacturer of mass spectrometry instrumentation, launched the BioPhase 8800 driver, which enables the easy integration of the BioPhase 8800 system with the Empower chromatography data system from Waters Technologies Corporation.
9. What pricing options are available for accessing the report?
Pricing options include single-user, multi-user, and enterprise licenses priced at USD 4750, USD 5250, and USD 8750 respectively.
10. Is the market size provided in terms of value or volume?
The market size is provided in terms of value, measured in Million and volume, measured in Million.
11. Are there any specific market keywords associated with the report?
Yes, the market keyword associated with the report is "Chromatography Data Systems Market," which aids in identifying and referencing the specific market segment covered.
12. How do I determine which pricing option suits my needs best?
The pricing options vary based on user requirements and access needs. Individual users may opt for single-user licenses, while businesses requiring broader access may choose multi-user or enterprise licenses for cost-effective access to the report.
13. Are there any additional resources or data provided in the Chromatography Data Systems Market report?
While the report offers comprehensive insights, it's advisable to review the specific contents or supplementary materials provided to ascertain if additional resources or data are available.
14. How can I stay updated on further developments or reports in the Chromatography Data Systems Market?
To stay informed about further developments, trends, and reports in the Chromatography Data Systems Market, consider subscribing to industry newsletters, following relevant companies and organizations, or regularly checking reputable industry news sources and publications.
Methodology
Step 1 - Identification of Relevant Samples Size from Population Database


Step 2 - Approaches for Defining Global Market Size (Value, Volume* & Price*)

Note*: In applicable scenarios
Step 3 - Data Sources
Primary Research
- Web Analytics
- Survey Reports
- Research Institute
- Latest Research Reports
- Opinion Leaders
Secondary Research
- Annual Reports
- White Paper
- Latest Press Release
- Industry Association
- Paid Database
- Investor Presentations

Step 4 - Data Triangulation
Involves using different sources of information in order to increase the validity of a study
These sources are likely to be stakeholders in a program - participants, other researchers, program staff, other community members, and so on.
Then we put all data in single framework & apply various statistical tools to find out the dynamic on the market.
During the analysis stage, feedback from the stakeholder groups would be compared to determine areas of agreement as well as areas of divergence