
Key Insights
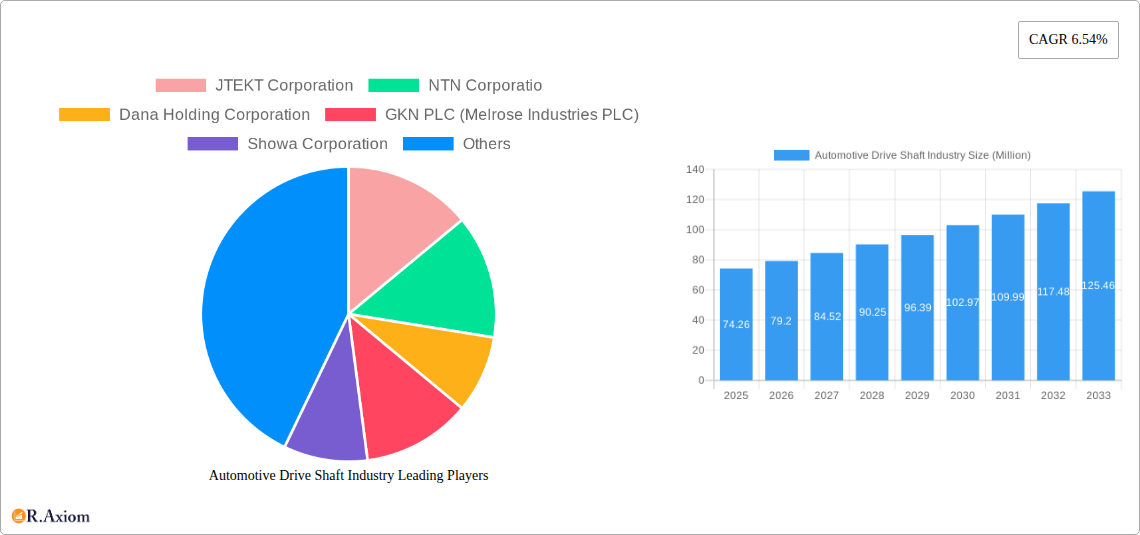
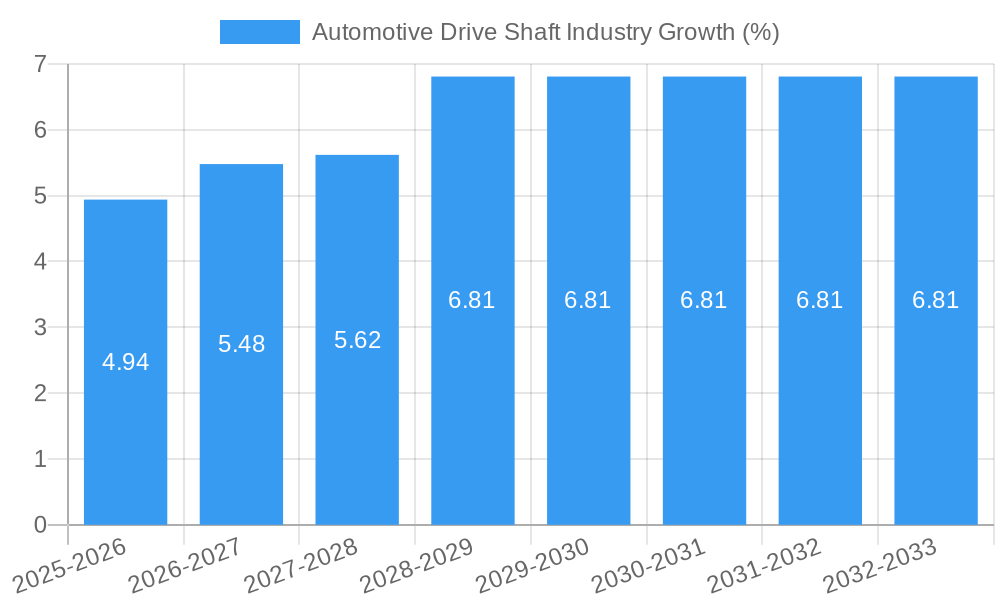
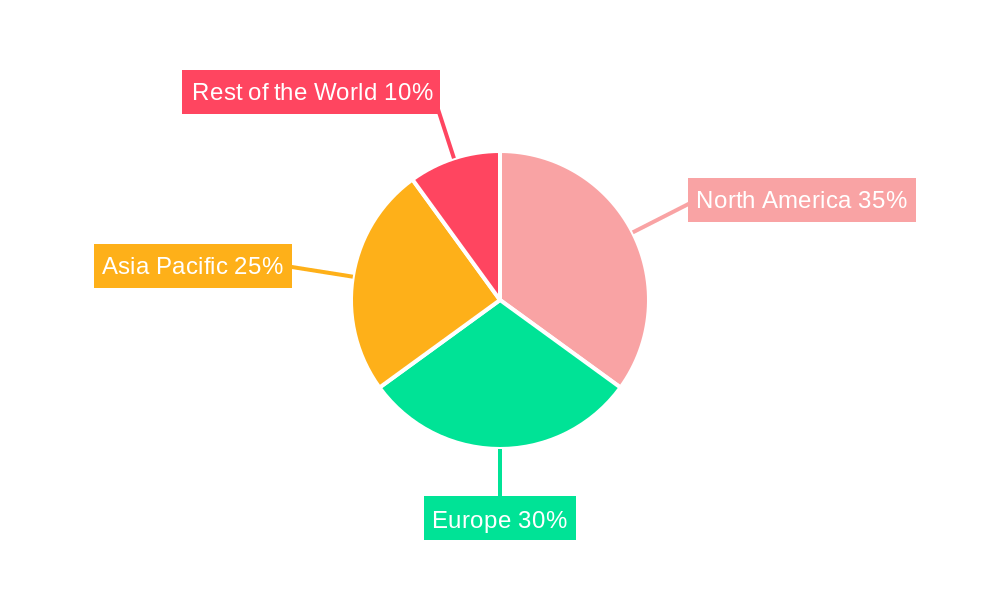
The automotive drive shaft market, valued at $74.26 million in 2025, is projected to experience robust growth, driven by the increasing demand for passenger cars and commercial vehicles globally. A compound annual growth rate (CAGR) of 6.54% from 2025 to 2033 indicates a significant expansion of this market. Key growth drivers include the rising adoption of advanced driver-assistance systems (ADAS), the increasing preference for fuel-efficient vehicles, and the continuous technological advancements in drive shaft materials and designs. The market is segmented by design type (hollow shaft and solid shaft), position type (rear axle and front axle), vehicle type (passenger cars and commercial vehicles), and sales channel (OEM and aftermarket). The shift towards electric and hybrid vehicles presents both opportunities and challenges. While the demand for traditional drive shafts might decrease in the long term, the market will likely see growth in specialized drive shafts designed for electric vehicle powertrains. Geographic analysis shows strong market presence in North America, Europe, and Asia Pacific, with China and India emerging as key growth regions. Competitive rivalry is intense, with major players like JTEKT, NTN, Dana Holding, GKN, Showa, and others vying for market share through innovation and strategic partnerships.
The aftermarket segment is expected to witness substantial growth, driven by the increasing number of aging vehicles requiring replacement parts. Furthermore, the rising demand for high-performance vehicles is fueling the need for advanced drive shaft technology, impacting the segment’s overall expansion. Technological advancements such as the integration of lightweight materials like carbon fiber and aluminum into drive shaft manufacturing are expected to enhance fuel efficiency and performance, which in turn, will stimulate demand. However, fluctuating raw material prices and stringent emission regulations pose significant challenges to the industry. Sustained investment in research and development, coupled with strategic acquisitions and mergers, will be key for companies to maintain a competitive edge in this dynamic market landscape. The forecast period (2025-2033) is expected to show steady growth fueled by the factors mentioned above, albeit at a potentially moderating pace toward the end of the forecast period as the market reaches a higher level of saturation.
Automotive Drive Shaft Industry Market Report: 2019-2033
This comprehensive report provides a detailed analysis of the global automotive drive shaft industry, offering invaluable insights for industry stakeholders, investors, and strategic decision-makers. The report covers the period from 2019 to 2033, with a focus on the forecast period of 2025-2033 and a base year of 2025. It delves into market dynamics, segmentation, key players, recent developments, and future opportunities, providing actionable intelligence for navigating this evolving landscape. The global market size is projected to reach xx Million by 2033.
Automotive Drive Shaft Industry Market Concentration & Innovation
The automotive drive shaft industry exhibits a moderately concentrated market structure, with a few major players holding significant market share. JTEKT Corporation, NTN Corporation, Dana Holding Corporation, and GKN PLC (Melrose Industries PLC) are among the leading companies, collectively accounting for an estimated xx% of the global market in 2024. Market share fluctuations are influenced by factors such as technological advancements, strategic partnerships, and mergers and acquisitions (M&A) activities. The value of M&A deals in the sector has fluctuated in recent years, reaching xx Million in 2022, driven primarily by the consolidation efforts of major players seeking to expand their product portfolio and geographical reach.
Innovation is a critical driver within this industry, fueled by the increasing demand for lighter, more efficient, and durable drive shafts. Key innovation areas include:
- Development of advanced materials (e.g., lightweight alloys, carbon fiber composites) to reduce vehicle weight and improve fuel efficiency.
- Design optimization using computer-aided engineering (CAE) tools to enhance strength, durability, and NVH (Noise, Vibration, and Harshness) performance.
- Integration of smart sensors and electronics for real-time monitoring of drive shaft health and predictive maintenance.
Regulatory frameworks concerning emissions and fuel efficiency standards significantly influence industry innovation. The increasing adoption of electric vehicles (EVs) and hybrid electric vehicles (HEVs) presents both challenges and opportunities, prompting the development of specialized drive shafts for these applications. Product substitutes, such as electric motors and alternative drivetrain technologies, pose a long-term competitive threat but also stimulate innovation in drive shaft design and functionality. End-user trends, particularly towards enhanced vehicle performance and fuel economy, drive the demand for higher-quality, more technologically advanced drive shafts.
Automotive Drive Shaft Industry Industry Trends & Insights
The automotive drive shaft industry is experiencing a period of significant transformation, driven by several key factors. The global market is projected to witness a Compound Annual Growth Rate (CAGR) of xx% during the forecast period (2025-2033). Market penetration of advanced drive shaft technologies, such as those incorporating lightweight materials and improved designs, is steadily increasing, fueled by the demand for enhanced vehicle efficiency and performance. Technological disruptions, particularly in the areas of electric vehicle (EV) and autonomous vehicle (AV) technologies, are reshaping the industry landscape, leading to new design requirements and manufacturing processes. The rising consumer preference for fuel-efficient and environmentally friendly vehicles is driving innovation in drive shaft materials and manufacturing methods. Competitive dynamics are characterized by intense rivalry among established players and the emergence of new entrants, especially in the niche markets of EV and AV drive shafts. This intense competition leads to pricing pressures and continuous innovation to stay ahead of the curve.
Dominant Markets & Segments in Automotive Drive Shaft Industry
The Asia Pacific region is currently the dominant market for automotive drive shafts, driven primarily by the high volume of automotive production in countries like China, India, and Japan. Within this region, China stands out as the leading national market due to its massive automotive manufacturing base and rapidly expanding consumer demand.
Key Drivers of Regional Dominance:
- Favorable economic policies supporting automotive manufacturing.
- Well-developed automotive supply chain infrastructure.
- Strong domestic demand for passenger cars and commercial vehicles.
Segment Dominance Analysis:
By Design Type: The hollow shaft segment holds a larger market share than the solid shaft segment due to its lighter weight and enhanced strength-to-weight ratio, aligning with fuel efficiency standards.
By Position Type: The rear axle segment dominates due to its widespread use in conventional vehicles and the increasing demand for high-performance rear-wheel and all-wheel drive systems.
By Vehicle Type: The passenger car segment currently holds the largest market share, although the commercial vehicle segment is expected to exhibit faster growth during the forecast period due to rising freight transportation demands.
By Sales Channel: The Original Equipment Manufacturer (OEM) channel accounts for a significantly larger market share compared to the aftermarket channel, as OEMs are the primary source of new vehicle production.
Automotive Drive Shaft Industry Product Developments
Recent advancements in automotive drive shaft technology have focused on improving efficiency, durability, and NVH (noise, vibration, and harshness) performance. The adoption of lightweight materials, such as aluminum and carbon fiber composites, has gained traction, leading to reduced vehicle weight and enhanced fuel economy. Innovative designs, incorporating advanced manufacturing techniques like forging and precision machining, improve strength and durability while minimizing NVH characteristics. These advancements are improving market fit by providing automotive manufacturers with solutions that meet stringent emissions standards and increasingly demanding consumer preferences for fuel efficiency and quiet operation.
Report Scope & Segmentation Analysis
This report provides a comprehensive segmentation of the automotive drive shaft market, broken down by design type (hollow shaft, solid shaft), position type (rear axle, front axle), vehicle type (passenger cars, commercial vehicles), and sales channel (OEM, aftermarket). Each segment’s growth projections, market sizes, and competitive dynamics are analyzed in detail, providing a granular understanding of the industry's structure and opportunities. The hollow shaft segment is projected to experience significant growth driven by its lightweight properties, while the rear axle segment is expected to maintain its dominance. The passenger car segment is currently the largest but the commercial vehicle segment is projected to experience strong growth due to increased logistics and transportation needs. The OEM channel will continue to dominate due to its importance in new vehicle production.
Key Drivers of Automotive Drive Shaft Industry Growth
The growth of the automotive drive shaft industry is primarily driven by factors such as the expanding global automotive production, the increasing demand for fuel-efficient vehicles, and the rising adoption of advanced driver-assistance systems (ADAS). Stringent government regulations aimed at improving vehicle fuel economy and reducing emissions are also significant drivers. Moreover, the increasing demand for electric vehicles and hybrid vehicles has spurred growth in the development of specialized drive shafts designed for these applications.
Challenges in the Automotive Drive Shaft Industry Sector
The automotive drive shaft industry faces several challenges, including fluctuations in raw material prices, intense competition from both established and emerging players, and the complexity of global supply chain management. Stringent emission regulations necessitate continuous innovation in lightweight materials and energy-efficient designs, adding cost pressures. Furthermore, technological disruptions and shifting consumer preferences create uncertainty and necessitate rapid adaptation from industry participants.
Emerging Opportunities in Automotive Drive Shaft Industry
The rising demand for electric vehicles (EVs) and hybrid electric vehicles (HEVs) presents a significant opportunity for the automotive drive shaft industry. The development of advanced drive shafts tailored for electric drivetrains, including those incorporating lightweight materials and integrated sensors, represents a considerable growth prospect. Moreover, the expanding adoption of autonomous driving technologies opens new avenues for innovative drive shaft designs and functionalities, further enhancing market expansion.
Leading Players in the Automotive Drive Shaft Industry Market
- JTEKT Corporation
- NTN Corporation
- Dana Holding Corporation
- GKN PLC (Melrose Industries PLC)
- Showa Corporation
- Wanxiang Qianchao Co Ltd
- American Axle & Manufacturing Co Ltd
- Hyundai Wia Corporation
- Nexteer Automotive Group Ltd
- Yamada Manufacturing Co Ltd
Key Developments in Automotive Drive Shaft Industry Industry
January 2023: Dana Cardenas opened a new USD 21 Million plant in Querétaro, Mexico, with a production line for Toyota components, showcasing expansion in the Americas and strengthening the OEM relationship with Toyota. The planned expansion to three lines suggests high demand and confidence in the future.
December 2022: JTEKT Corporation's adoption of its "low-vibration drive shaft" by Toyota for the Lexus RX highlights technological advancements enhancing fuel efficiency and driving experience, further solidifying JTEKT's position as a technology leader.
October 2022: JTEKT and Koyo's development of the JTEKT Ultra Small Seal for BEV eAxles demonstrates responsiveness to the growing EV market and emphasizes the company's commitment to innovation in this crucial sector.
Strategic Outlook for Automotive Drive Shaft Industry Market
The automotive drive shaft industry is poised for continued growth, fueled by the global expansion of the automotive sector, the increasing demand for fuel-efficient and electric vehicles, and ongoing technological advancements in materials and manufacturing processes. The industry is expected to benefit from strategic collaborations and M&A activities as companies seek to expand their market share and technological capabilities. The focus on sustainability and environmental concerns will further drive demand for lightweight and efficient drive shaft designs. The rising adoption of autonomous vehicles also presents significant opportunities for innovation in drive shaft technology.
Automotive Drive Shaft Industry Segmentation
-
1. Design Type
- 1.1. Hollow Shaft
- 1.2. Solid Shaft
-
2. Position Type
- 2.1. Rear Axle
- 2.2. Front Axle
-
3. Vehicle Type
- 3.1. Passenger Cars
- 3.2. Commercial Vehicles
-
4. Sales Channel
- 4.1. OEM
- 4.2. Aftermarket
Automotive Drive Shaft Industry Segmentation By Geography
-
1. North America
- 1.1. United States
- 1.2. Canada
- 1.3. Rest of North America
-
2. Europe
- 2.1. Germany
- 2.2. United Kingdom
- 2.3. France
- 2.4. Rest of Europe
-
3. Asia Pacific
- 3.1. India
- 3.2. China
- 3.3. Japan
- 3.4. South Korea
- 3.5. Rest of Asia Pacific
-
4. Rest of the World
- 4.1. South America
- 4.2. Middle East and Africa
Automotive Drive Shaft Industry REPORT HIGHLIGHTS
| Aspects | Details |
|---|---|
| Study Period | 2019-2033 |
| Base Year | 2024 |
| Estimated Year | 2025 |
| Forecast Period | 2025-2033 |
| Historical Period | 2019-2024 |
| Growth Rate | CAGR of 6.54% from 2019-2033 |
| Segmentation |
|
Table of Contents
- 1. Introduction
- 1.1. Research Scope
- 1.2. Market Segmentation
- 1.3. Research Methodology
- 1.4. Definitions and Assumptions
- 2. Executive Summary
- 2.1. Introduction
- 3. Market Dynamics
- 3.1. Introduction
- 3.2. Market Drivers
- 3.2.1. Automotive Industry Continues to Witness Steady Growth in Vehicle Production; Growing Awareness of Air Pollution and Health Concerns
- 3.3. Market Restrains
- 3.3.1. Shift towards Disposable Filters
- 3.4. Market Trends
- 3.4.1. Increasing Demand for Electric Vehicles to Drive Growth of the Market
- 4. Market Factor Analysis
- 4.1. Porters Five Forces
- 4.2. Supply/Value Chain
- 4.3. PESTEL analysis
- 4.4. Market Entropy
- 4.5. Patent/Trademark Analysis
- 5. Global Automotive Drive Shaft Industry Analysis, Insights and Forecast, 2019-2031
- 5.1. Market Analysis, Insights and Forecast - by Design Type
- 5.1.1. Hollow Shaft
- 5.1.2. Solid Shaft
- 5.2. Market Analysis, Insights and Forecast - by Position Type
- 5.2.1. Rear Axle
- 5.2.2. Front Axle
- 5.3. Market Analysis, Insights and Forecast - by Vehicle Type
- 5.3.1. Passenger Cars
- 5.3.2. Commercial Vehicles
- 5.4. Market Analysis, Insights and Forecast - by Sales Channel
- 5.4.1. OEM
- 5.4.2. Aftermarket
- 5.5. Market Analysis, Insights and Forecast - by Region
- 5.5.1. North America
- 5.5.2. Europe
- 5.5.3. Asia Pacific
- 5.5.4. Rest of the World
- 5.1. Market Analysis, Insights and Forecast - by Design Type
- 6. North America Automotive Drive Shaft Industry Analysis, Insights and Forecast, 2019-2031
- 6.1. Market Analysis, Insights and Forecast - by Design Type
- 6.1.1. Hollow Shaft
- 6.1.2. Solid Shaft
- 6.2. Market Analysis, Insights and Forecast - by Position Type
- 6.2.1. Rear Axle
- 6.2.2. Front Axle
- 6.3. Market Analysis, Insights and Forecast - by Vehicle Type
- 6.3.1. Passenger Cars
- 6.3.2. Commercial Vehicles
- 6.4. Market Analysis, Insights and Forecast - by Sales Channel
- 6.4.1. OEM
- 6.4.2. Aftermarket
- 6.1. Market Analysis, Insights and Forecast - by Design Type
- 7. Europe Automotive Drive Shaft Industry Analysis, Insights and Forecast, 2019-2031
- 7.1. Market Analysis, Insights and Forecast - by Design Type
- 7.1.1. Hollow Shaft
- 7.1.2. Solid Shaft
- 7.2. Market Analysis, Insights and Forecast - by Position Type
- 7.2.1. Rear Axle
- 7.2.2. Front Axle
- 7.3. Market Analysis, Insights and Forecast - by Vehicle Type
- 7.3.1. Passenger Cars
- 7.3.2. Commercial Vehicles
- 7.4. Market Analysis, Insights and Forecast - by Sales Channel
- 7.4.1. OEM
- 7.4.2. Aftermarket
- 7.1. Market Analysis, Insights and Forecast - by Design Type
- 8. Asia Pacific Automotive Drive Shaft Industry Analysis, Insights and Forecast, 2019-2031
- 8.1. Market Analysis, Insights and Forecast - by Design Type
- 8.1.1. Hollow Shaft
- 8.1.2. Solid Shaft
- 8.2. Market Analysis, Insights and Forecast - by Position Type
- 8.2.1. Rear Axle
- 8.2.2. Front Axle
- 8.3. Market Analysis, Insights and Forecast - by Vehicle Type
- 8.3.1. Passenger Cars
- 8.3.2. Commercial Vehicles
- 8.4. Market Analysis, Insights and Forecast - by Sales Channel
- 8.4.1. OEM
- 8.4.2. Aftermarket
- 8.1. Market Analysis, Insights and Forecast - by Design Type
- 9. Rest of the World Automotive Drive Shaft Industry Analysis, Insights and Forecast, 2019-2031
- 9.1. Market Analysis, Insights and Forecast - by Design Type
- 9.1.1. Hollow Shaft
- 9.1.2. Solid Shaft
- 9.2. Market Analysis, Insights and Forecast - by Position Type
- 9.2.1. Rear Axle
- 9.2.2. Front Axle
- 9.3. Market Analysis, Insights and Forecast - by Vehicle Type
- 9.3.1. Passenger Cars
- 9.3.2. Commercial Vehicles
- 9.4. Market Analysis, Insights and Forecast - by Sales Channel
- 9.4.1. OEM
- 9.4.2. Aftermarket
- 9.1. Market Analysis, Insights and Forecast - by Design Type
- 10. North America Automotive Drive Shaft Industry Analysis, Insights and Forecast, 2019-2031
- 10.1. Market Analysis, Insights and Forecast - By Country/Sub-region
- 10.1.1 United States
- 10.1.2 Canada
- 10.1.3 Rest of North America
- 11. Europe Automotive Drive Shaft Industry Analysis, Insights and Forecast, 2019-2031
- 11.1. Market Analysis, Insights and Forecast - By Country/Sub-region
- 11.1.1 Germany
- 11.1.2 United Kingdom
- 11.1.3 France
- 11.1.4 Rest of Europe
- 12. Asia Pacific Automotive Drive Shaft Industry Analysis, Insights and Forecast, 2019-2031
- 12.1. Market Analysis, Insights and Forecast - By Country/Sub-region
- 12.1.1 India
- 12.1.2 China
- 12.1.3 Japan
- 12.1.4 South Korea
- 12.1.5 Rest of Asia Pacific
- 13. Rest of the World Automotive Drive Shaft Industry Analysis, Insights and Forecast, 2019-2031
- 13.1. Market Analysis, Insights and Forecast - By Country/Sub-region
- 13.1.1 Brazil
- 13.1.2 South Africa
- 13.1.3 Other Countries
- 14. Competitive Analysis
- 14.1. Global Market Share Analysis 2024
- 14.2. Company Profiles
- 14.2.1 JTEKT Corporation
- 14.2.1.1. Overview
- 14.2.1.2. Products
- 14.2.1.3. SWOT Analysis
- 14.2.1.4. Recent Developments
- 14.2.1.5. Financials (Based on Availability)
- 14.2.2 NTN Corporatio
- 14.2.2.1. Overview
- 14.2.2.2. Products
- 14.2.2.3. SWOT Analysis
- 14.2.2.4. Recent Developments
- 14.2.2.5. Financials (Based on Availability)
- 14.2.3 Dana Holding Corporation
- 14.2.3.1. Overview
- 14.2.3.2. Products
- 14.2.3.3. SWOT Analysis
- 14.2.3.4. Recent Developments
- 14.2.3.5. Financials (Based on Availability)
- 14.2.4 GKN PLC (Melrose Industries PLC)
- 14.2.4.1. Overview
- 14.2.4.2. Products
- 14.2.4.3. SWOT Analysis
- 14.2.4.4. Recent Developments
- 14.2.4.5. Financials (Based on Availability)
- 14.2.5 Showa Corporation
- 14.2.5.1. Overview
- 14.2.5.2. Products
- 14.2.5.3. SWOT Analysis
- 14.2.5.4. Recent Developments
- 14.2.5.5. Financials (Based on Availability)
- 14.2.6 Wanxiang Qianchao Co Ltd
- 14.2.6.1. Overview
- 14.2.6.2. Products
- 14.2.6.3. SWOT Analysis
- 14.2.6.4. Recent Developments
- 14.2.6.5. Financials (Based on Availability)
- 14.2.7 American Axle & Manufacturing Co Ltd
- 14.2.7.1. Overview
- 14.2.7.2. Products
- 14.2.7.3. SWOT Analysis
- 14.2.7.4. Recent Developments
- 14.2.7.5. Financials (Based on Availability)
- 14.2.8 Hyundai Wia Corporation
- 14.2.8.1. Overview
- 14.2.8.2. Products
- 14.2.8.3. SWOT Analysis
- 14.2.8.4. Recent Developments
- 14.2.8.5. Financials (Based on Availability)
- 14.2.9 Nexteer Automotive Group Ltd
- 14.2.9.1. Overview
- 14.2.9.2. Products
- 14.2.9.3. SWOT Analysis
- 14.2.9.4. Recent Developments
- 14.2.9.5. Financials (Based on Availability)
- 14.2.10 Yamada Manufacturing Co Ltd
- 14.2.10.1. Overview
- 14.2.10.2. Products
- 14.2.10.3. SWOT Analysis
- 14.2.10.4. Recent Developments
- 14.2.10.5. Financials (Based on Availability)
- 14.2.1 JTEKT Corporation
List of Figures
- Figure 1: Global Automotive Drive Shaft Industry Revenue Breakdown (Million, %) by Region 2024 & 2032
- Figure 2: North America Automotive Drive Shaft Industry Revenue (Million), by Country 2024 & 2032
- Figure 3: North America Automotive Drive Shaft Industry Revenue Share (%), by Country 2024 & 2032
- Figure 4: Europe Automotive Drive Shaft Industry Revenue (Million), by Country 2024 & 2032
- Figure 5: Europe Automotive Drive Shaft Industry Revenue Share (%), by Country 2024 & 2032
- Figure 6: Asia Pacific Automotive Drive Shaft Industry Revenue (Million), by Country 2024 & 2032
- Figure 7: Asia Pacific Automotive Drive Shaft Industry Revenue Share (%), by Country 2024 & 2032
- Figure 8: Rest of the World Automotive Drive Shaft Industry Revenue (Million), by Country 2024 & 2032
- Figure 9: Rest of the World Automotive Drive Shaft Industry Revenue Share (%), by Country 2024 & 2032
- Figure 10: North America Automotive Drive Shaft Industry Revenue (Million), by Design Type 2024 & 2032
- Figure 11: North America Automotive Drive Shaft Industry Revenue Share (%), by Design Type 2024 & 2032
- Figure 12: North America Automotive Drive Shaft Industry Revenue (Million), by Position Type 2024 & 2032
- Figure 13: North America Automotive Drive Shaft Industry Revenue Share (%), by Position Type 2024 & 2032
- Figure 14: North America Automotive Drive Shaft Industry Revenue (Million), by Vehicle Type 2024 & 2032
- Figure 15: North America Automotive Drive Shaft Industry Revenue Share (%), by Vehicle Type 2024 & 2032
- Figure 16: North America Automotive Drive Shaft Industry Revenue (Million), by Sales Channel 2024 & 2032
- Figure 17: North America Automotive Drive Shaft Industry Revenue Share (%), by Sales Channel 2024 & 2032
- Figure 18: North America Automotive Drive Shaft Industry Revenue (Million), by Country 2024 & 2032
- Figure 19: North America Automotive Drive Shaft Industry Revenue Share (%), by Country 2024 & 2032
- Figure 20: Europe Automotive Drive Shaft Industry Revenue (Million), by Design Type 2024 & 2032
- Figure 21: Europe Automotive Drive Shaft Industry Revenue Share (%), by Design Type 2024 & 2032
- Figure 22: Europe Automotive Drive Shaft Industry Revenue (Million), by Position Type 2024 & 2032
- Figure 23: Europe Automotive Drive Shaft Industry Revenue Share (%), by Position Type 2024 & 2032
- Figure 24: Europe Automotive Drive Shaft Industry Revenue (Million), by Vehicle Type 2024 & 2032
- Figure 25: Europe Automotive Drive Shaft Industry Revenue Share (%), by Vehicle Type 2024 & 2032
- Figure 26: Europe Automotive Drive Shaft Industry Revenue (Million), by Sales Channel 2024 & 2032
- Figure 27: Europe Automotive Drive Shaft Industry Revenue Share (%), by Sales Channel 2024 & 2032
- Figure 28: Europe Automotive Drive Shaft Industry Revenue (Million), by Country 2024 & 2032
- Figure 29: Europe Automotive Drive Shaft Industry Revenue Share (%), by Country 2024 & 2032
- Figure 30: Asia Pacific Automotive Drive Shaft Industry Revenue (Million), by Design Type 2024 & 2032
- Figure 31: Asia Pacific Automotive Drive Shaft Industry Revenue Share (%), by Design Type 2024 & 2032
- Figure 32: Asia Pacific Automotive Drive Shaft Industry Revenue (Million), by Position Type 2024 & 2032
- Figure 33: Asia Pacific Automotive Drive Shaft Industry Revenue Share (%), by Position Type 2024 & 2032
- Figure 34: Asia Pacific Automotive Drive Shaft Industry Revenue (Million), by Vehicle Type 2024 & 2032
- Figure 35: Asia Pacific Automotive Drive Shaft Industry Revenue Share (%), by Vehicle Type 2024 & 2032
- Figure 36: Asia Pacific Automotive Drive Shaft Industry Revenue (Million), by Sales Channel 2024 & 2032
- Figure 37: Asia Pacific Automotive Drive Shaft Industry Revenue Share (%), by Sales Channel 2024 & 2032
- Figure 38: Asia Pacific Automotive Drive Shaft Industry Revenue (Million), by Country 2024 & 2032
- Figure 39: Asia Pacific Automotive Drive Shaft Industry Revenue Share (%), by Country 2024 & 2032
- Figure 40: Rest of the World Automotive Drive Shaft Industry Revenue (Million), by Design Type 2024 & 2032
- Figure 41: Rest of the World Automotive Drive Shaft Industry Revenue Share (%), by Design Type 2024 & 2032
- Figure 42: Rest of the World Automotive Drive Shaft Industry Revenue (Million), by Position Type 2024 & 2032
- Figure 43: Rest of the World Automotive Drive Shaft Industry Revenue Share (%), by Position Type 2024 & 2032
- Figure 44: Rest of the World Automotive Drive Shaft Industry Revenue (Million), by Vehicle Type 2024 & 2032
- Figure 45: Rest of the World Automotive Drive Shaft Industry Revenue Share (%), by Vehicle Type 2024 & 2032
- Figure 46: Rest of the World Automotive Drive Shaft Industry Revenue (Million), by Sales Channel 2024 & 2032
- Figure 47: Rest of the World Automotive Drive Shaft Industry Revenue Share (%), by Sales Channel 2024 & 2032
- Figure 48: Rest of the World Automotive Drive Shaft Industry Revenue (Million), by Country 2024 & 2032
- Figure 49: Rest of the World Automotive Drive Shaft Industry Revenue Share (%), by Country 2024 & 2032
List of Tables
- Table 1: Global Automotive Drive Shaft Industry Revenue Million Forecast, by Region 2019 & 2032
- Table 2: Global Automotive Drive Shaft Industry Revenue Million Forecast, by Design Type 2019 & 2032
- Table 3: Global Automotive Drive Shaft Industry Revenue Million Forecast, by Position Type 2019 & 2032
- Table 4: Global Automotive Drive Shaft Industry Revenue Million Forecast, by Vehicle Type 2019 & 2032
- Table 5: Global Automotive Drive Shaft Industry Revenue Million Forecast, by Sales Channel 2019 & 2032
- Table 6: Global Automotive Drive Shaft Industry Revenue Million Forecast, by Region 2019 & 2032
- Table 7: Global Automotive Drive Shaft Industry Revenue Million Forecast, by Country 2019 & 2032
- Table 8: United States Automotive Drive Shaft Industry Revenue (Million) Forecast, by Application 2019 & 2032
- Table 9: Canada Automotive Drive Shaft Industry Revenue (Million) Forecast, by Application 2019 & 2032
- Table 10: Rest of North America Automotive Drive Shaft Industry Revenue (Million) Forecast, by Application 2019 & 2032
- Table 11: Global Automotive Drive Shaft Industry Revenue Million Forecast, by Country 2019 & 2032
- Table 12: Germany Automotive Drive Shaft Industry Revenue (Million) Forecast, by Application 2019 & 2032
- Table 13: United Kingdom Automotive Drive Shaft Industry Revenue (Million) Forecast, by Application 2019 & 2032
- Table 14: France Automotive Drive Shaft Industry Revenue (Million) Forecast, by Application 2019 & 2032
- Table 15: Rest of Europe Automotive Drive Shaft Industry Revenue (Million) Forecast, by Application 2019 & 2032
- Table 16: Global Automotive Drive Shaft Industry Revenue Million Forecast, by Country 2019 & 2032
- Table 17: India Automotive Drive Shaft Industry Revenue (Million) Forecast, by Application 2019 & 2032
- Table 18: China Automotive Drive Shaft Industry Revenue (Million) Forecast, by Application 2019 & 2032
- Table 19: Japan Automotive Drive Shaft Industry Revenue (Million) Forecast, by Application 2019 & 2032
- Table 20: South Korea Automotive Drive Shaft Industry Revenue (Million) Forecast, by Application 2019 & 2032
- Table 21: Rest of Asia Pacific Automotive Drive Shaft Industry Revenue (Million) Forecast, by Application 2019 & 2032
- Table 22: Global Automotive Drive Shaft Industry Revenue Million Forecast, by Country 2019 & 2032
- Table 23: Brazil Automotive Drive Shaft Industry Revenue (Million) Forecast, by Application 2019 & 2032
- Table 24: South Africa Automotive Drive Shaft Industry Revenue (Million) Forecast, by Application 2019 & 2032
- Table 25: Other Countries Automotive Drive Shaft Industry Revenue (Million) Forecast, by Application 2019 & 2032
- Table 26: Global Automotive Drive Shaft Industry Revenue Million Forecast, by Design Type 2019 & 2032
- Table 27: Global Automotive Drive Shaft Industry Revenue Million Forecast, by Position Type 2019 & 2032
- Table 28: Global Automotive Drive Shaft Industry Revenue Million Forecast, by Vehicle Type 2019 & 2032
- Table 29: Global Automotive Drive Shaft Industry Revenue Million Forecast, by Sales Channel 2019 & 2032
- Table 30: Global Automotive Drive Shaft Industry Revenue Million Forecast, by Country 2019 & 2032
- Table 31: United States Automotive Drive Shaft Industry Revenue (Million) Forecast, by Application 2019 & 2032
- Table 32: Canada Automotive Drive Shaft Industry Revenue (Million) Forecast, by Application 2019 & 2032
- Table 33: Rest of North America Automotive Drive Shaft Industry Revenue (Million) Forecast, by Application 2019 & 2032
- Table 34: Global Automotive Drive Shaft Industry Revenue Million Forecast, by Design Type 2019 & 2032
- Table 35: Global Automotive Drive Shaft Industry Revenue Million Forecast, by Position Type 2019 & 2032
- Table 36: Global Automotive Drive Shaft Industry Revenue Million Forecast, by Vehicle Type 2019 & 2032
- Table 37: Global Automotive Drive Shaft Industry Revenue Million Forecast, by Sales Channel 2019 & 2032
- Table 38: Global Automotive Drive Shaft Industry Revenue Million Forecast, by Country 2019 & 2032
- Table 39: Germany Automotive Drive Shaft Industry Revenue (Million) Forecast, by Application 2019 & 2032
- Table 40: United Kingdom Automotive Drive Shaft Industry Revenue (Million) Forecast, by Application 2019 & 2032
- Table 41: France Automotive Drive Shaft Industry Revenue (Million) Forecast, by Application 2019 & 2032
- Table 42: Rest of Europe Automotive Drive Shaft Industry Revenue (Million) Forecast, by Application 2019 & 2032
- Table 43: Global Automotive Drive Shaft Industry Revenue Million Forecast, by Design Type 2019 & 2032
- Table 44: Global Automotive Drive Shaft Industry Revenue Million Forecast, by Position Type 2019 & 2032
- Table 45: Global Automotive Drive Shaft Industry Revenue Million Forecast, by Vehicle Type 2019 & 2032
- Table 46: Global Automotive Drive Shaft Industry Revenue Million Forecast, by Sales Channel 2019 & 2032
- Table 47: Global Automotive Drive Shaft Industry Revenue Million Forecast, by Country 2019 & 2032
- Table 48: India Automotive Drive Shaft Industry Revenue (Million) Forecast, by Application 2019 & 2032
- Table 49: China Automotive Drive Shaft Industry Revenue (Million) Forecast, by Application 2019 & 2032
- Table 50: Japan Automotive Drive Shaft Industry Revenue (Million) Forecast, by Application 2019 & 2032
- Table 51: South Korea Automotive Drive Shaft Industry Revenue (Million) Forecast, by Application 2019 & 2032
- Table 52: Rest of Asia Pacific Automotive Drive Shaft Industry Revenue (Million) Forecast, by Application 2019 & 2032
- Table 53: Global Automotive Drive Shaft Industry Revenue Million Forecast, by Design Type 2019 & 2032
- Table 54: Global Automotive Drive Shaft Industry Revenue Million Forecast, by Position Type 2019 & 2032
- Table 55: Global Automotive Drive Shaft Industry Revenue Million Forecast, by Vehicle Type 2019 & 2032
- Table 56: Global Automotive Drive Shaft Industry Revenue Million Forecast, by Sales Channel 2019 & 2032
- Table 57: Global Automotive Drive Shaft Industry Revenue Million Forecast, by Country 2019 & 2032
- Table 58: South America Automotive Drive Shaft Industry Revenue (Million) Forecast, by Application 2019 & 2032
- Table 59: Middle East and Africa Automotive Drive Shaft Industry Revenue (Million) Forecast, by Application 2019 & 2032
Frequently Asked Questions
1. What is the projected Compound Annual Growth Rate (CAGR) of the Automotive Drive Shaft Industry?
The projected CAGR is approximately 6.54%.
2. Which companies are prominent players in the Automotive Drive Shaft Industry?
Key companies in the market include JTEKT Corporation, NTN Corporatio, Dana Holding Corporation, GKN PLC (Melrose Industries PLC), Showa Corporation, Wanxiang Qianchao Co Ltd, American Axle & Manufacturing Co Ltd, Hyundai Wia Corporation, Nexteer Automotive Group Ltd, Yamada Manufacturing Co Ltd.
3. What are the main segments of the Automotive Drive Shaft Industry?
The market segments include Design Type, Position Type, Vehicle Type, Sales Channel.
4. Can you provide details about the market size?
The market size is estimated to be USD 74.26 Million as of 2022.
5. What are some drivers contributing to market growth?
Automotive Industry Continues to Witness Steady Growth in Vehicle Production; Growing Awareness of Air Pollution and Health Concerns.
6. What are the notable trends driving market growth?
Increasing Demand for Electric Vehicles to Drive Growth of the Market.
7. Are there any restraints impacting market growth?
Shift towards Disposable Filters.
8. Can you provide examples of recent developments in the market?
January 2023: Dana Cardenas opened a new USD 21 million plant in Querétaro, Mexico, with a production line that will make Toyota components. The first production line, which already began with 110 employees, will be joined by two more lines later in 2023 for a total annual production of 545,000 units with 300 employees. Alejandro Sánchez Alvarado, Operations Director at Dana Cardanes, explained that three production lines are being installed in the new 917-square-meter facility, where cardan shafts (drive shafts) will be manufactured for use in Toyota trucks.
9. What pricing options are available for accessing the report?
Pricing options include single-user, multi-user, and enterprise licenses priced at USD 4750, USD 5250, and USD 8750 respectively.
10. Is the market size provided in terms of value or volume?
The market size is provided in terms of value, measured in Million.
11. Are there any specific market keywords associated with the report?
Yes, the market keyword associated with the report is "Automotive Drive Shaft Industry," which aids in identifying and referencing the specific market segment covered.
12. How do I determine which pricing option suits my needs best?
The pricing options vary based on user requirements and access needs. Individual users may opt for single-user licenses, while businesses requiring broader access may choose multi-user or enterprise licenses for cost-effective access to the report.
13. Are there any additional resources or data provided in the Automotive Drive Shaft Industry report?
While the report offers comprehensive insights, it's advisable to review the specific contents or supplementary materials provided to ascertain if additional resources or data are available.
14. How can I stay updated on further developments or reports in the Automotive Drive Shaft Industry?
To stay informed about further developments, trends, and reports in the Automotive Drive Shaft Industry, consider subscribing to industry newsletters, following relevant companies and organizations, or regularly checking reputable industry news sources and publications.
Methodology
Step 1 - Identification of Relevant Samples Size from Population Database


Step 2 - Approaches for Defining Global Market Size (Value, Volume* & Price*)

Note*: In applicable scenarios
Step 3 - Data Sources
Primary Research
- Web Analytics
- Survey Reports
- Research Institute
- Latest Research Reports
- Opinion Leaders
Secondary Research
- Annual Reports
- White Paper
- Latest Press Release
- Industry Association
- Paid Database
- Investor Presentations

Step 4 - Data Triangulation
Involves using different sources of information in order to increase the validity of a study
These sources are likely to be stakeholders in a program - participants, other researchers, program staff, other community members, and so on.
Then we put all data in single framework & apply various statistical tools to find out the dynamic on the market.
During the analysis stage, feedback from the stakeholder groups would be compared to determine areas of agreement as well as areas of divergence


