


Key Insights
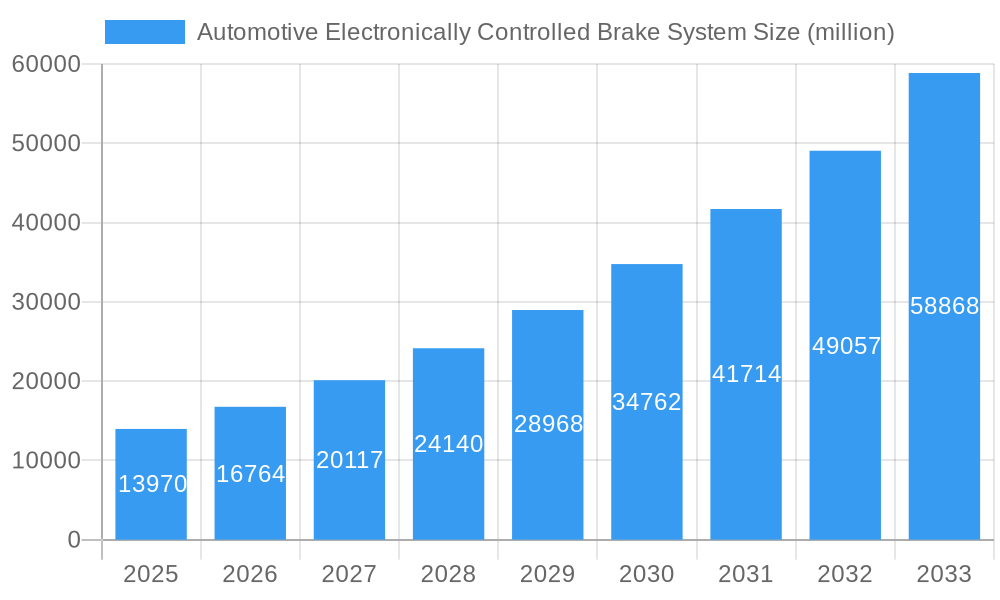
The global automotive electronically controlled brake system (ECBS) market is experiencing robust growth, projected to reach \$13.97 billion in 2025 and maintain a Compound Annual Growth Rate (CAGR) of 20% from 2025 to 2033. This expansion is driven by several key factors. The increasing demand for advanced driver-assistance systems (ADAS) and autonomous driving technologies necessitates sophisticated braking systems capable of precise and rapid responses. Stringent government regulations worldwide mandating improved vehicle safety standards are further fueling market growth. Furthermore, the rising adoption of electric and hybrid vehicles contributes to this trend, as ECBS is crucial for efficient energy management and enhanced braking performance in these vehicles. The shift towards more sophisticated braking technologies, such as integrated braking systems and brake-by-wire systems, represents a significant opportunity for market players. Competition is intense, with established automotive suppliers like Bosch, Continental, ZF, and others vying for market share through innovation and strategic partnerships.
Automotive Electronically Controlled Brake System Market Size (In Billion)

The market segmentation is likely diverse, encompassing various vehicle types (passenger cars, commercial vehicles), brake system types (Anti-lock Braking System (ABS), Electronic Stability Control (ESC), Electronic Brakeforce Distribution (EBD)), and geographic regions. While precise segmental data is unavailable, it's reasonable to assume that passenger cars currently dominate the market share, followed by commercial vehicles. However, the latter segment shows higher growth potential given increasing regulations and the demand for safety enhancements in heavy-duty vehicles. Regional growth is likely to be influenced by factors such as vehicle production levels, economic growth, and regulatory landscapes. Developing economies in Asia-Pacific are anticipated to witness significant growth, while established markets in North America and Europe will continue to demonstrate steady expansion. However, challenges such as the high initial investment costs associated with ECBS technology and the potential for cybersecurity vulnerabilities could act as restraints.
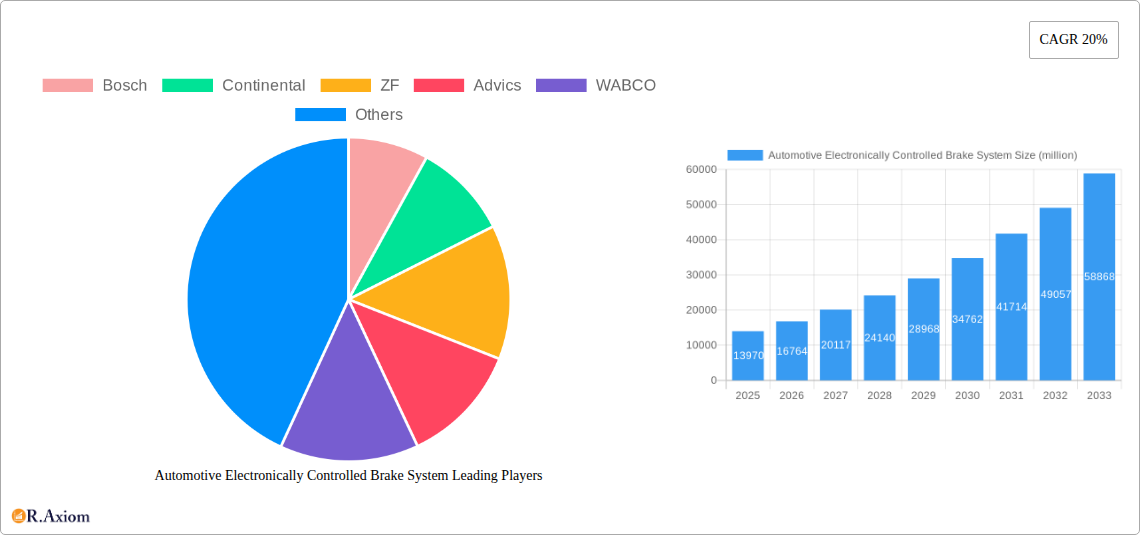
Automotive Electronically Controlled Brake System Company Market Share
Automotive Electronically Controlled Brake System Market: A Comprehensive Analysis (2019-2033)
This in-depth report provides a comprehensive analysis of the global automotive electronically controlled brake system (ECBS) market, offering invaluable insights for industry stakeholders, investors, and strategic decision-makers. The report covers the period from 2019 to 2033, with a focus on the forecast period (2025-2033) and a detailed examination of the base year (2025) and estimated year (2025). The report leverages millions as its value unit and provides actionable insights into market trends, key players, technological advancements, and future growth prospects.
Automotive Electronically Controlled Brake System Market Concentration & Innovation
The global automotive ECBS market exhibits a moderately concentrated landscape, with major players like Bosch, Continental, ZF, and others holding significant market share. Bosch currently commands an estimated xx% market share in 2025, followed by Continental at xx% and ZF at xx%. These companies benefit from extensive R&D investments, technological expertise, and established global distribution networks. The market is characterized by ongoing innovation, driven by stringent safety regulations, the rising demand for advanced driver-assistance systems (ADAS), and the increasing adoption of electric and autonomous vehicles. Several significant M&A activities have been observed in recent years, with total deal values exceeding $xx million between 2019 and 2024, mainly focusing on strategic acquisitions to enhance technological capabilities and expand market reach. Regulatory frameworks, such as those mandating advanced braking systems, are strong catalysts. Product substitutes are limited, though hydraulic braking systems still exist, although their market penetration is significantly declining. End-user trends reflect a strong preference for enhanced safety features and autonomous driving capabilities, fueling demand for sophisticated ECBS.
- Market Share (2025 Estimate): Bosch (xx%), Continental (xx%), ZF (xx%), Others (xx%)
- M&A Activity (2019-2024): Total deal value exceeding $xx million
Automotive Electronically Controlled Brake System Industry Trends & Insights
The automotive ECBS market is experiencing robust growth, with a projected CAGR of xx% during the forecast period (2025-2033). This growth is primarily fueled by several key factors: the increasing adoption of ADAS features like automatic emergency braking (AEB) and adaptive cruise control (ACC), the rising demand for electric vehicles (EVs) that inherently benefit from ECBS integration, and strengthening safety regulations worldwide mandating advanced braking technologies. Technological disruptions, such as the integration of artificial intelligence (AI) and machine learning (ML) in ECBS, are transforming the industry, enabling more precise and responsive braking systems. Consumer preferences are shifting towards vehicles equipped with advanced safety and autonomous driving features, driving demand for ECBS. The competitive landscape is dynamic, with established players focusing on innovation and strategic partnerships to maintain their market position. Market penetration of ECBS in passenger vehicles is estimated at xx% in 2025, and it's expected to reach xx% by 2033.
Dominant Markets & Segments in Automotive Electronically Controlled Brake System
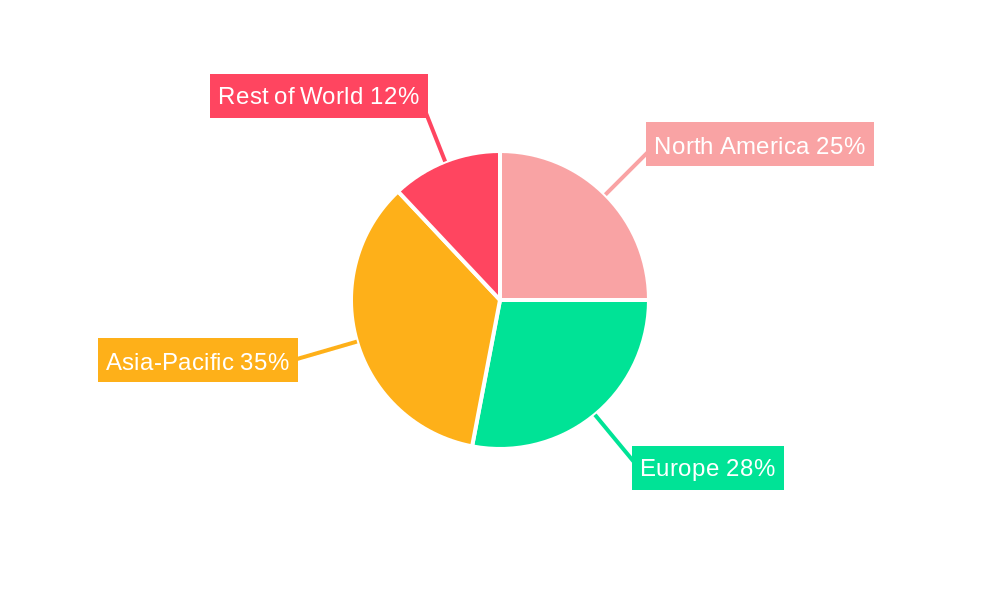
The Asia-Pacific region is currently the dominant market for automotive ECBS, driven by rapid economic growth, increasing vehicle production, and rising consumer demand for advanced safety features. China and India, in particular, are key growth drivers within this region.
- Key Drivers in Asia-Pacific:
- Rapid economic growth
- High vehicle production volumes
- Increasing consumer disposable income
- Stringent government safety regulations
- Growing adoption of ADAS and autonomous driving technologies
The dominance of the Asia-Pacific region stems from several factors: The region’s booming automotive industry provides a massive consumer base, coupled with favorable government policies that encourage the adoption of advanced safety technologies. Furthermore, the region's growing middle class is increasingly demanding vehicles with enhanced safety and comfort features, further propelling the demand for ECBS. The continued infrastructural development in the region also contributes to increased vehicle ownership and usage, reinforcing market growth.
Automotive Electronically Controlled Brake System Product Developments
Recent product innovations in the automotive ECBS market focus on enhanced safety features, improved efficiency, and greater integration with other ADAS systems. Developments include the integration of sensor fusion technologies for improved object detection and braking response, advanced algorithms for optimized braking performance in diverse driving conditions, and the miniaturization of ECBS components for better vehicle integration. This focus on sophisticated technology enhances market fit by directly addressing consumer demand for increased safety and vehicle autonomy. These improvements provide competitive advantages by offering enhanced safety performance and reduced maintenance costs.
Report Scope & Segmentation Analysis
This report segments the automotive ECBS market by vehicle type (passenger cars, commercial vehicles), braking system type (hydraulic, electro-hydraulic, fully electronic), region (North America, Europe, Asia-Pacific, Rest of World), and technology (ABS, ESC, AEB). Each segment shows substantial growth potential. The passenger car segment currently dominates, but the commercial vehicle segment is anticipated to witness faster growth owing to stricter regulations and increasing adoption of ADAS. The electro-hydraulic segment holds a significant market share, while the fully electronic segment is poised for substantial growth in the coming years.
Key Drivers of Automotive Electronically Controlled Brake System Growth
The growth of the automotive ECBS market is driven by a confluence of factors, primarily including the stringent government regulations mandating advanced safety features in vehicles, the increasing demand for ADAS and autonomous driving technologies, and the rising consumer awareness regarding vehicle safety. Technological advancements in sensor technology, AI, and ML enable the development of more efficient and sophisticated ECBS. The expanding global automotive industry and rising disposable incomes in emerging markets further augment market growth.
Challenges in the Automotive Electronically Controlled Brake System Sector
Significant challenges include the high initial cost of implementing ECBS, the complexity of integrating ECBS with existing vehicle systems, and potential cybersecurity vulnerabilities associated with advanced electronic systems. Supply chain disruptions can also affect production and market availability. Furthermore, the intense competition among established players and emerging companies can put pricing pressure on margins. These factors, though posing challenges, also fuel innovation.
Emerging Opportunities in Automotive Electronically Controlled Brake System
Emerging opportunities lie in the development of more cost-effective and energy-efficient ECBS, integration with connected car technologies for improved safety and predictive braking, and expansion into new markets with growing vehicle production. Advanced driver assistance systems (ADAS) are increasing the need for more sophisticated systems, offering a significant market opportunity. The development of robust cybersecurity measures for ECBS is crucial for mitigating risks.
Leading Players in the Automotive Electronically Controlled Brake System Market
- Bosch
- Continental
- ZF
- Advics
- WABCO
- Knorr Bremse
- HL Mando
- Haldex
- MAN
- Bethel
Key Developments in Automotive Electronically Controlled Brake System Industry
- 2022-Q4: Bosch launched a new generation of ECBS with integrated AI capabilities.
- 2023-Q1: Continental and ZF announced a strategic partnership to develop next-generation ECBS.
- 2024-Q2: A significant merger occurred between two smaller players, consolidating their market presence. (Specific details omitted due to confidentiality).
- 2025-Q1: New safety regulations came into effect in several key markets, boosting ECBS adoption.
Strategic Outlook for Automotive Electronically Controlled Brake System Market
The automotive ECBS market is poised for substantial growth, driven by technological innovation, government regulations, and growing consumer demand for enhanced safety and autonomous driving features. The integration of AI, ML, and sensor fusion technologies will further enhance system performance, leading to increased market penetration. Expansion into new markets, particularly in developing countries, will offer significant opportunities for growth in the coming years. The market will continue to be dominated by major players, but innovative startups and strategic partnerships are expected to reshape the competitive landscape.
Automotive Electronically Controlled Brake System Segmentation
-
1. Application
- 1.1. Passenger Car
- 1.2. Commercial Vehicle
-
2. Type
- 2.1. One-box
- 2.2. Two-box
Automotive Electronically Controlled Brake System Segmentation By Geography
-
1. North America
- 1.1. United States
- 1.2. Canada
- 1.3. Mexico
-
2. South America
- 2.1. Brazil
- 2.2. Argentina
- 2.3. Rest of South America
-
3. Europe
- 3.1. United Kingdom
- 3.2. Germany
- 3.3. France
- 3.4. Italy
- 3.5. Spain
- 3.6. Russia
- 3.7. Benelux
- 3.8. Nordics
- 3.9. Rest of Europe
-
4. Middle East & Africa
- 4.1. Turkey
- 4.2. Israel
- 4.3. GCC
- 4.4. North Africa
- 4.5. South Africa
- 4.6. Rest of Middle East & Africa
-
5. Asia Pacific
- 5.1. China
- 5.2. India
- 5.3. Japan
- 5.4. South Korea
- 5.5. ASEAN
- 5.6. Oceania
- 5.7. Rest of Asia Pacific
Automotive Electronically Controlled Brake System Regional Market Share
Geographic Coverage of Automotive Electronically Controlled Brake System
Automotive Electronically Controlled Brake System REPORT HIGHLIGHTS
| Aspects | Details |
|---|---|
| Study Period | 2020-2034 |
| Base Year | 2025 |
| Estimated Year | 2026 |
| Forecast Period | 2026-2034 |
| Historical Period | 2020-2025 |
| Growth Rate | CAGR of 20% from 2020-2034 |
| Segmentation |
|
Table of Contents
- 1. Introduction
- 1.1. Research Scope
- 1.2. Market Segmentation
- 1.3. Research Methodology
- 1.4. Definitions and Assumptions
- 2. Executive Summary
- 2.1. Introduction
- 3. Market Dynamics
- 3.1. Introduction
- 3.2. Market Drivers
- 3.3. Market Restrains
- 3.4. Market Trends
- 4. Market Factor Analysis
- 4.1. Porters Five Forces
- 4.2. Supply/Value Chain
- 4.3. PESTEL analysis
- 4.4. Market Entropy
- 4.5. Patent/Trademark Analysis
- 5. Global Automotive Electronically Controlled Brake System Analysis, Insights and Forecast, 2020-2032
- 5.1. Market Analysis, Insights and Forecast - by Application
- 5.1.1. Passenger Car
- 5.1.2. Commercial Vehicle
- 5.2. Market Analysis, Insights and Forecast - by Type
- 5.2.1. One-box
- 5.2.2. Two-box
- 5.3. Market Analysis, Insights and Forecast - by Region
- 5.3.1. North America
- 5.3.2. South America
- 5.3.3. Europe
- 5.3.4. Middle East & Africa
- 5.3.5. Asia Pacific
- 5.1. Market Analysis, Insights and Forecast - by Application
- 6. North America Automotive Electronically Controlled Brake System Analysis, Insights and Forecast, 2020-2032
- 6.1. Market Analysis, Insights and Forecast - by Application
- 6.1.1. Passenger Car
- 6.1.2. Commercial Vehicle
- 6.2. Market Analysis, Insights and Forecast - by Type
- 6.2.1. One-box
- 6.2.2. Two-box
- 6.1. Market Analysis, Insights and Forecast - by Application
- 7. South America Automotive Electronically Controlled Brake System Analysis, Insights and Forecast, 2020-2032
- 7.1. Market Analysis, Insights and Forecast - by Application
- 7.1.1. Passenger Car
- 7.1.2. Commercial Vehicle
- 7.2. Market Analysis, Insights and Forecast - by Type
- 7.2.1. One-box
- 7.2.2. Two-box
- 7.1. Market Analysis, Insights and Forecast - by Application
- 8. Europe Automotive Electronically Controlled Brake System Analysis, Insights and Forecast, 2020-2032
- 8.1. Market Analysis, Insights and Forecast - by Application
- 8.1.1. Passenger Car
- 8.1.2. Commercial Vehicle
- 8.2. Market Analysis, Insights and Forecast - by Type
- 8.2.1. One-box
- 8.2.2. Two-box
- 8.1. Market Analysis, Insights and Forecast - by Application
- 9. Middle East & Africa Automotive Electronically Controlled Brake System Analysis, Insights and Forecast, 2020-2032
- 9.1. Market Analysis, Insights and Forecast - by Application
- 9.1.1. Passenger Car
- 9.1.2. Commercial Vehicle
- 9.2. Market Analysis, Insights and Forecast - by Type
- 9.2.1. One-box
- 9.2.2. Two-box
- 9.1. Market Analysis, Insights and Forecast - by Application
- 10. Asia Pacific Automotive Electronically Controlled Brake System Analysis, Insights and Forecast, 2020-2032
- 10.1. Market Analysis, Insights and Forecast - by Application
- 10.1.1. Passenger Car
- 10.1.2. Commercial Vehicle
- 10.2. Market Analysis, Insights and Forecast - by Type
- 10.2.1. One-box
- 10.2.2. Two-box
- 10.1. Market Analysis, Insights and Forecast - by Application
- 11. Competitive Analysis
- 11.1. Global Market Share Analysis 2025
- 11.2. Company Profiles
- 11.2.1 Bosch
- 11.2.1.1. Overview
- 11.2.1.2. Products
- 11.2.1.3. SWOT Analysis
- 11.2.1.4. Recent Developments
- 11.2.1.5. Financials (Based on Availability)
- 11.2.2 Continental
- 11.2.2.1. Overview
- 11.2.2.2. Products
- 11.2.2.3. SWOT Analysis
- 11.2.2.4. Recent Developments
- 11.2.2.5. Financials (Based on Availability)
- 11.2.3 ZF
- 11.2.3.1. Overview
- 11.2.3.2. Products
- 11.2.3.3. SWOT Analysis
- 11.2.3.4. Recent Developments
- 11.2.3.5. Financials (Based on Availability)
- 11.2.4 Advics
- 11.2.4.1. Overview
- 11.2.4.2. Products
- 11.2.4.3. SWOT Analysis
- 11.2.4.4. Recent Developments
- 11.2.4.5. Financials (Based on Availability)
- 11.2.5 WABCO
- 11.2.5.1. Overview
- 11.2.5.2. Products
- 11.2.5.3. SWOT Analysis
- 11.2.5.4. Recent Developments
- 11.2.5.5. Financials (Based on Availability)
- 11.2.6 Knorr Bremse
- 11.2.6.1. Overview
- 11.2.6.2. Products
- 11.2.6.3. SWOT Analysis
- 11.2.6.4. Recent Developments
- 11.2.6.5. Financials (Based on Availability)
- 11.2.7 HL Mando
- 11.2.7.1. Overview
- 11.2.7.2. Products
- 11.2.7.3. SWOT Analysis
- 11.2.7.4. Recent Developments
- 11.2.7.5. Financials (Based on Availability)
- 11.2.8 Haldex
- 11.2.8.1. Overview
- 11.2.8.2. Products
- 11.2.8.3. SWOT Analysis
- 11.2.8.4. Recent Developments
- 11.2.8.5. Financials (Based on Availability)
- 11.2.9 MAN
- 11.2.9.1. Overview
- 11.2.9.2. Products
- 11.2.9.3. SWOT Analysis
- 11.2.9.4. Recent Developments
- 11.2.9.5. Financials (Based on Availability)
- 11.2.10 Bethel
- 11.2.10.1. Overview
- 11.2.10.2. Products
- 11.2.10.3. SWOT Analysis
- 11.2.10.4. Recent Developments
- 11.2.10.5. Financials (Based on Availability)
- 11.2.1 Bosch
List of Figures
- Figure 1: Global Automotive Electronically Controlled Brake System Revenue Breakdown (million, %) by Region 2025 & 2033
- Figure 2: Global Automotive Electronically Controlled Brake System Volume Breakdown (K, %) by Region 2025 & 2033
- Figure 3: North America Automotive Electronically Controlled Brake System Revenue (million), by Application 2025 & 2033
- Figure 4: North America Automotive Electronically Controlled Brake System Volume (K), by Application 2025 & 2033
- Figure 5: North America Automotive Electronically Controlled Brake System Revenue Share (%), by Application 2025 & 2033
- Figure 6: North America Automotive Electronically Controlled Brake System Volume Share (%), by Application 2025 & 2033
- Figure 7: North America Automotive Electronically Controlled Brake System Revenue (million), by Type 2025 & 2033
- Figure 8: North America Automotive Electronically Controlled Brake System Volume (K), by Type 2025 & 2033
- Figure 9: North America Automotive Electronically Controlled Brake System Revenue Share (%), by Type 2025 & 2033
- Figure 10: North America Automotive Electronically Controlled Brake System Volume Share (%), by Type 2025 & 2033
- Figure 11: North America Automotive Electronically Controlled Brake System Revenue (million), by Country 2025 & 2033
- Figure 12: North America Automotive Electronically Controlled Brake System Volume (K), by Country 2025 & 2033
- Figure 13: North America Automotive Electronically Controlled Brake System Revenue Share (%), by Country 2025 & 2033
- Figure 14: North America Automotive Electronically Controlled Brake System Volume Share (%), by Country 2025 & 2033
- Figure 15: South America Automotive Electronically Controlled Brake System Revenue (million), by Application 2025 & 2033
- Figure 16: South America Automotive Electronically Controlled Brake System Volume (K), by Application 2025 & 2033
- Figure 17: South America Automotive Electronically Controlled Brake System Revenue Share (%), by Application 2025 & 2033
- Figure 18: South America Automotive Electronically Controlled Brake System Volume Share (%), by Application 2025 & 2033
- Figure 19: South America Automotive Electronically Controlled Brake System Revenue (million), by Type 2025 & 2033
- Figure 20: South America Automotive Electronically Controlled Brake System Volume (K), by Type 2025 & 2033
- Figure 21: South America Automotive Electronically Controlled Brake System Revenue Share (%), by Type 2025 & 2033
- Figure 22: South America Automotive Electronically Controlled Brake System Volume Share (%), by Type 2025 & 2033
- Figure 23: South America Automotive Electronically Controlled Brake System Revenue (million), by Country 2025 & 2033
- Figure 24: South America Automotive Electronically Controlled Brake System Volume (K), by Country 2025 & 2033
- Figure 25: South America Automotive Electronically Controlled Brake System Revenue Share (%), by Country 2025 & 2033
- Figure 26: South America Automotive Electronically Controlled Brake System Volume Share (%), by Country 2025 & 2033
- Figure 27: Europe Automotive Electronically Controlled Brake System Revenue (million), by Application 2025 & 2033
- Figure 28: Europe Automotive Electronically Controlled Brake System Volume (K), by Application 2025 & 2033
- Figure 29: Europe Automotive Electronically Controlled Brake System Revenue Share (%), by Application 2025 & 2033
- Figure 30: Europe Automotive Electronically Controlled Brake System Volume Share (%), by Application 2025 & 2033
- Figure 31: Europe Automotive Electronically Controlled Brake System Revenue (million), by Type 2025 & 2033
- Figure 32: Europe Automotive Electronically Controlled Brake System Volume (K), by Type 2025 & 2033
- Figure 33: Europe Automotive Electronically Controlled Brake System Revenue Share (%), by Type 2025 & 2033
- Figure 34: Europe Automotive Electronically Controlled Brake System Volume Share (%), by Type 2025 & 2033
- Figure 35: Europe Automotive Electronically Controlled Brake System Revenue (million), by Country 2025 & 2033
- Figure 36: Europe Automotive Electronically Controlled Brake System Volume (K), by Country 2025 & 2033
- Figure 37: Europe Automotive Electronically Controlled Brake System Revenue Share (%), by Country 2025 & 2033
- Figure 38: Europe Automotive Electronically Controlled Brake System Volume Share (%), by Country 2025 & 2033
- Figure 39: Middle East & Africa Automotive Electronically Controlled Brake System Revenue (million), by Application 2025 & 2033
- Figure 40: Middle East & Africa Automotive Electronically Controlled Brake System Volume (K), by Application 2025 & 2033
- Figure 41: Middle East & Africa Automotive Electronically Controlled Brake System Revenue Share (%), by Application 2025 & 2033
- Figure 42: Middle East & Africa Automotive Electronically Controlled Brake System Volume Share (%), by Application 2025 & 2033
- Figure 43: Middle East & Africa Automotive Electronically Controlled Brake System Revenue (million), by Type 2025 & 2033
- Figure 44: Middle East & Africa Automotive Electronically Controlled Brake System Volume (K), by Type 2025 & 2033
- Figure 45: Middle East & Africa Automotive Electronically Controlled Brake System Revenue Share (%), by Type 2025 & 2033
- Figure 46: Middle East & Africa Automotive Electronically Controlled Brake System Volume Share (%), by Type 2025 & 2033
- Figure 47: Middle East & Africa Automotive Electronically Controlled Brake System Revenue (million), by Country 2025 & 2033
- Figure 48: Middle East & Africa Automotive Electronically Controlled Brake System Volume (K), by Country 2025 & 2033
- Figure 49: Middle East & Africa Automotive Electronically Controlled Brake System Revenue Share (%), by Country 2025 & 2033
- Figure 50: Middle East & Africa Automotive Electronically Controlled Brake System Volume Share (%), by Country 2025 & 2033
- Figure 51: Asia Pacific Automotive Electronically Controlled Brake System Revenue (million), by Application 2025 & 2033
- Figure 52: Asia Pacific Automotive Electronically Controlled Brake System Volume (K), by Application 2025 & 2033
- Figure 53: Asia Pacific Automotive Electronically Controlled Brake System Revenue Share (%), by Application 2025 & 2033
- Figure 54: Asia Pacific Automotive Electronically Controlled Brake System Volume Share (%), by Application 2025 & 2033
- Figure 55: Asia Pacific Automotive Electronically Controlled Brake System Revenue (million), by Type 2025 & 2033
- Figure 56: Asia Pacific Automotive Electronically Controlled Brake System Volume (K), by Type 2025 & 2033
- Figure 57: Asia Pacific Automotive Electronically Controlled Brake System Revenue Share (%), by Type 2025 & 2033
- Figure 58: Asia Pacific Automotive Electronically Controlled Brake System Volume Share (%), by Type 2025 & 2033
- Figure 59: Asia Pacific Automotive Electronically Controlled Brake System Revenue (million), by Country 2025 & 2033
- Figure 60: Asia Pacific Automotive Electronically Controlled Brake System Volume (K), by Country 2025 & 2033
- Figure 61: Asia Pacific Automotive Electronically Controlled Brake System Revenue Share (%), by Country 2025 & 2033
- Figure 62: Asia Pacific Automotive Electronically Controlled Brake System Volume Share (%), by Country 2025 & 2033
List of Tables
- Table 1: Global Automotive Electronically Controlled Brake System Revenue million Forecast, by Application 2020 & 2033
- Table 2: Global Automotive Electronically Controlled Brake System Volume K Forecast, by Application 2020 & 2033
- Table 3: Global Automotive Electronically Controlled Brake System Revenue million Forecast, by Type 2020 & 2033
- Table 4: Global Automotive Electronically Controlled Brake System Volume K Forecast, by Type 2020 & 2033
- Table 5: Global Automotive Electronically Controlled Brake System Revenue million Forecast, by Region 2020 & 2033
- Table 6: Global Automotive Electronically Controlled Brake System Volume K Forecast, by Region 2020 & 2033
- Table 7: Global Automotive Electronically Controlled Brake System Revenue million Forecast, by Application 2020 & 2033
- Table 8: Global Automotive Electronically Controlled Brake System Volume K Forecast, by Application 2020 & 2033
- Table 9: Global Automotive Electronically Controlled Brake System Revenue million Forecast, by Type 2020 & 2033
- Table 10: Global Automotive Electronically Controlled Brake System Volume K Forecast, by Type 2020 & 2033
- Table 11: Global Automotive Electronically Controlled Brake System Revenue million Forecast, by Country 2020 & 2033
- Table 12: Global Automotive Electronically Controlled Brake System Volume K Forecast, by Country 2020 & 2033
- Table 13: United States Automotive Electronically Controlled Brake System Revenue (million) Forecast, by Application 2020 & 2033
- Table 14: United States Automotive Electronically Controlled Brake System Volume (K) Forecast, by Application 2020 & 2033
- Table 15: Canada Automotive Electronically Controlled Brake System Revenue (million) Forecast, by Application 2020 & 2033
- Table 16: Canada Automotive Electronically Controlled Brake System Volume (K) Forecast, by Application 2020 & 2033
- Table 17: Mexico Automotive Electronically Controlled Brake System Revenue (million) Forecast, by Application 2020 & 2033
- Table 18: Mexico Automotive Electronically Controlled Brake System Volume (K) Forecast, by Application 2020 & 2033
- Table 19: Global Automotive Electronically Controlled Brake System Revenue million Forecast, by Application 2020 & 2033
- Table 20: Global Automotive Electronically Controlled Brake System Volume K Forecast, by Application 2020 & 2033
- Table 21: Global Automotive Electronically Controlled Brake System Revenue million Forecast, by Type 2020 & 2033
- Table 22: Global Automotive Electronically Controlled Brake System Volume K Forecast, by Type 2020 & 2033
- Table 23: Global Automotive Electronically Controlled Brake System Revenue million Forecast, by Country 2020 & 2033
- Table 24: Global Automotive Electronically Controlled Brake System Volume K Forecast, by Country 2020 & 2033
- Table 25: Brazil Automotive Electronically Controlled Brake System Revenue (million) Forecast, by Application 2020 & 2033
- Table 26: Brazil Automotive Electronically Controlled Brake System Volume (K) Forecast, by Application 2020 & 2033
- Table 27: Argentina Automotive Electronically Controlled Brake System Revenue (million) Forecast, by Application 2020 & 2033
- Table 28: Argentina Automotive Electronically Controlled Brake System Volume (K) Forecast, by Application 2020 & 2033
- Table 29: Rest of South America Automotive Electronically Controlled Brake System Revenue (million) Forecast, by Application 2020 & 2033
- Table 30: Rest of South America Automotive Electronically Controlled Brake System Volume (K) Forecast, by Application 2020 & 2033
- Table 31: Global Automotive Electronically Controlled Brake System Revenue million Forecast, by Application 2020 & 2033
- Table 32: Global Automotive Electronically Controlled Brake System Volume K Forecast, by Application 2020 & 2033
- Table 33: Global Automotive Electronically Controlled Brake System Revenue million Forecast, by Type 2020 & 2033
- Table 34: Global Automotive Electronically Controlled Brake System Volume K Forecast, by Type 2020 & 2033
- Table 35: Global Automotive Electronically Controlled Brake System Revenue million Forecast, by Country 2020 & 2033
- Table 36: Global Automotive Electronically Controlled Brake System Volume K Forecast, by Country 2020 & 2033
- Table 37: United Kingdom Automotive Electronically Controlled Brake System Revenue (million) Forecast, by Application 2020 & 2033
- Table 38: United Kingdom Automotive Electronically Controlled Brake System Volume (K) Forecast, by Application 2020 & 2033
- Table 39: Germany Automotive Electronically Controlled Brake System Revenue (million) Forecast, by Application 2020 & 2033
- Table 40: Germany Automotive Electronically Controlled Brake System Volume (K) Forecast, by Application 2020 & 2033
- Table 41: France Automotive Electronically Controlled Brake System Revenue (million) Forecast, by Application 2020 & 2033
- Table 42: France Automotive Electronically Controlled Brake System Volume (K) Forecast, by Application 2020 & 2033
- Table 43: Italy Automotive Electronically Controlled Brake System Revenue (million) Forecast, by Application 2020 & 2033
- Table 44: Italy Automotive Electronically Controlled Brake System Volume (K) Forecast, by Application 2020 & 2033
- Table 45: Spain Automotive Electronically Controlled Brake System Revenue (million) Forecast, by Application 2020 & 2033
- Table 46: Spain Automotive Electronically Controlled Brake System Volume (K) Forecast, by Application 2020 & 2033
- Table 47: Russia Automotive Electronically Controlled Brake System Revenue (million) Forecast, by Application 2020 & 2033
- Table 48: Russia Automotive Electronically Controlled Brake System Volume (K) Forecast, by Application 2020 & 2033
- Table 49: Benelux Automotive Electronically Controlled Brake System Revenue (million) Forecast, by Application 2020 & 2033
- Table 50: Benelux Automotive Electronically Controlled Brake System Volume (K) Forecast, by Application 2020 & 2033
- Table 51: Nordics Automotive Electronically Controlled Brake System Revenue (million) Forecast, by Application 2020 & 2033
- Table 52: Nordics Automotive Electronically Controlled Brake System Volume (K) Forecast, by Application 2020 & 2033
- Table 53: Rest of Europe Automotive Electronically Controlled Brake System Revenue (million) Forecast, by Application 2020 & 2033
- Table 54: Rest of Europe Automotive Electronically Controlled Brake System Volume (K) Forecast, by Application 2020 & 2033
- Table 55: Global Automotive Electronically Controlled Brake System Revenue million Forecast, by Application 2020 & 2033
- Table 56: Global Automotive Electronically Controlled Brake System Volume K Forecast, by Application 2020 & 2033
- Table 57: Global Automotive Electronically Controlled Brake System Revenue million Forecast, by Type 2020 & 2033
- Table 58: Global Automotive Electronically Controlled Brake System Volume K Forecast, by Type 2020 & 2033
- Table 59: Global Automotive Electronically Controlled Brake System Revenue million Forecast, by Country 2020 & 2033
- Table 60: Global Automotive Electronically Controlled Brake System Volume K Forecast, by Country 2020 & 2033
- Table 61: Turkey Automotive Electronically Controlled Brake System Revenue (million) Forecast, by Application 2020 & 2033
- Table 62: Turkey Automotive Electronically Controlled Brake System Volume (K) Forecast, by Application 2020 & 2033
- Table 63: Israel Automotive Electronically Controlled Brake System Revenue (million) Forecast, by Application 2020 & 2033
- Table 64: Israel Automotive Electronically Controlled Brake System Volume (K) Forecast, by Application 2020 & 2033
- Table 65: GCC Automotive Electronically Controlled Brake System Revenue (million) Forecast, by Application 2020 & 2033
- Table 66: GCC Automotive Electronically Controlled Brake System Volume (K) Forecast, by Application 2020 & 2033
- Table 67: North Africa Automotive Electronically Controlled Brake System Revenue (million) Forecast, by Application 2020 & 2033
- Table 68: North Africa Automotive Electronically Controlled Brake System Volume (K) Forecast, by Application 2020 & 2033
- Table 69: South Africa Automotive Electronically Controlled Brake System Revenue (million) Forecast, by Application 2020 & 2033
- Table 70: South Africa Automotive Electronically Controlled Brake System Volume (K) Forecast, by Application 2020 & 2033
- Table 71: Rest of Middle East & Africa Automotive Electronically Controlled Brake System Revenue (million) Forecast, by Application 2020 & 2033
- Table 72: Rest of Middle East & Africa Automotive Electronically Controlled Brake System Volume (K) Forecast, by Application 2020 & 2033
- Table 73: Global Automotive Electronically Controlled Brake System Revenue million Forecast, by Application 2020 & 2033
- Table 74: Global Automotive Electronically Controlled Brake System Volume K Forecast, by Application 2020 & 2033
- Table 75: Global Automotive Electronically Controlled Brake System Revenue million Forecast, by Type 2020 & 2033
- Table 76: Global Automotive Electronically Controlled Brake System Volume K Forecast, by Type 2020 & 2033
- Table 77: Global Automotive Electronically Controlled Brake System Revenue million Forecast, by Country 2020 & 2033
- Table 78: Global Automotive Electronically Controlled Brake System Volume K Forecast, by Country 2020 & 2033
- Table 79: China Automotive Electronically Controlled Brake System Revenue (million) Forecast, by Application 2020 & 2033
- Table 80: China Automotive Electronically Controlled Brake System Volume (K) Forecast, by Application 2020 & 2033
- Table 81: India Automotive Electronically Controlled Brake System Revenue (million) Forecast, by Application 2020 & 2033
- Table 82: India Automotive Electronically Controlled Brake System Volume (K) Forecast, by Application 2020 & 2033
- Table 83: Japan Automotive Electronically Controlled Brake System Revenue (million) Forecast, by Application 2020 & 2033
- Table 84: Japan Automotive Electronically Controlled Brake System Volume (K) Forecast, by Application 2020 & 2033
- Table 85: South Korea Automotive Electronically Controlled Brake System Revenue (million) Forecast, by Application 2020 & 2033
- Table 86: South Korea Automotive Electronically Controlled Brake System Volume (K) Forecast, by Application 2020 & 2033
- Table 87: ASEAN Automotive Electronically Controlled Brake System Revenue (million) Forecast, by Application 2020 & 2033
- Table 88: ASEAN Automotive Electronically Controlled Brake System Volume (K) Forecast, by Application 2020 & 2033
- Table 89: Oceania Automotive Electronically Controlled Brake System Revenue (million) Forecast, by Application 2020 & 2033
- Table 90: Oceania Automotive Electronically Controlled Brake System Volume (K) Forecast, by Application 2020 & 2033
- Table 91: Rest of Asia Pacific Automotive Electronically Controlled Brake System Revenue (million) Forecast, by Application 2020 & 2033
- Table 92: Rest of Asia Pacific Automotive Electronically Controlled Brake System Volume (K) Forecast, by Application 2020 & 2033
Frequently Asked Questions
1. What is the projected Compound Annual Growth Rate (CAGR) of the Automotive Electronically Controlled Brake System?
The projected CAGR is approximately 20%.
2. Which companies are prominent players in the Automotive Electronically Controlled Brake System?
Key companies in the market include Bosch, Continental, ZF, Advics, WABCO, Knorr Bremse, HL Mando, Haldex, MAN, Bethel.
3. What are the main segments of the Automotive Electronically Controlled Brake System?
The market segments include Application, Type.
4. Can you provide details about the market size?
The market size is estimated to be USD 13970 million as of 2022.
5. What are some drivers contributing to market growth?
N/A
6. What are the notable trends driving market growth?
N/A
7. Are there any restraints impacting market growth?
N/A
8. Can you provide examples of recent developments in the market?
N/A
9. What pricing options are available for accessing the report?
Pricing options include single-user, multi-user, and enterprise licenses priced at USD 3950.00, USD 5925.00, and USD 7900.00 respectively.
10. Is the market size provided in terms of value or volume?
The market size is provided in terms of value, measured in million and volume, measured in K.
11. Are there any specific market keywords associated with the report?
Yes, the market keyword associated with the report is "Automotive Electronically Controlled Brake System," which aids in identifying and referencing the specific market segment covered.
12. How do I determine which pricing option suits my needs best?
The pricing options vary based on user requirements and access needs. Individual users may opt for single-user licenses, while businesses requiring broader access may choose multi-user or enterprise licenses for cost-effective access to the report.
13. Are there any additional resources or data provided in the Automotive Electronically Controlled Brake System report?
While the report offers comprehensive insights, it's advisable to review the specific contents or supplementary materials provided to ascertain if additional resources or data are available.
14. How can I stay updated on further developments or reports in the Automotive Electronically Controlled Brake System?
To stay informed about further developments, trends, and reports in the Automotive Electronically Controlled Brake System, consider subscribing to industry newsletters, following relevant companies and organizations, or regularly checking reputable industry news sources and publications.
Methodology
Step 1 - Identification of Relevant Samples Size from Population Database


Step 2 - Approaches for Defining Global Market Size (Value, Volume* & Price*)

Note*: In applicable scenarios
Step 3 - Data Sources
Primary Research
- Web Analytics
- Survey Reports
- Research Institute
- Latest Research Reports
- Opinion Leaders
Secondary Research
- Annual Reports
- White Paper
- Latest Press Release
- Industry Association
- Paid Database
- Investor Presentations

Step 4 - Data Triangulation
Involves using different sources of information in order to increase the validity of a study
These sources are likely to be stakeholders in a program - participants, other researchers, program staff, other community members, and so on.
Then we put all data in single framework & apply various statistical tools to find out the dynamic on the market.
During the analysis stage, feedback from the stakeholder groups would be compared to determine areas of agreement as well as areas of divergence