Key Insights
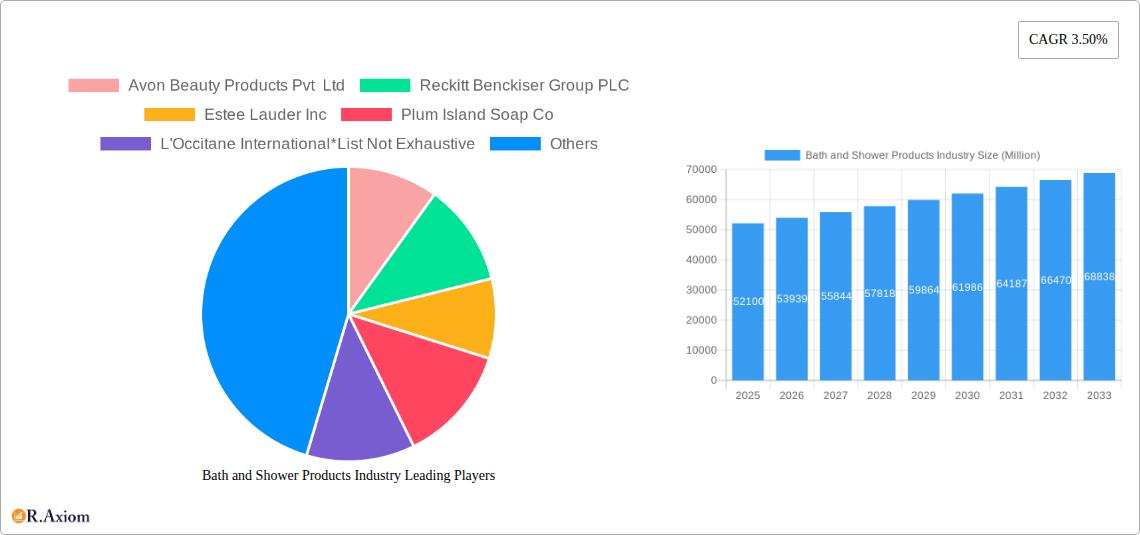
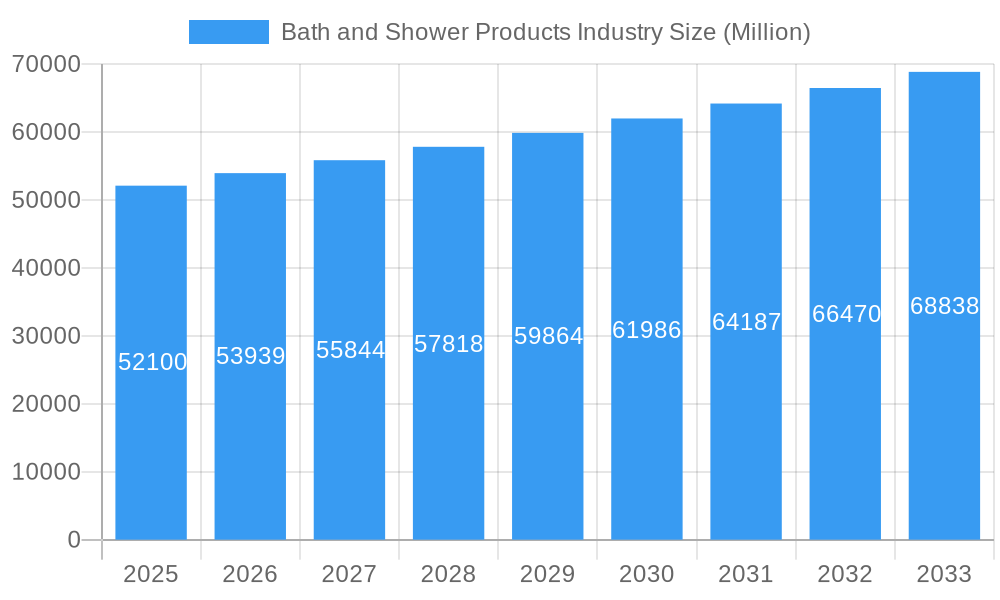
The global Bath and Shower Products market is poised for steady growth, projected to reach an estimated $52,100 Million in 2025, with a CAGR of 3.50% through 2033. This expansion is fueled by a growing consumer emphasis on personal hygiene, wellness, and the evolving preferences for premium and specialized bath and shower experiences. The market is driven by factors such as increasing disposable incomes, rising awareness about the benefits of skincare routines, and the continuous innovation in product formulations, including the introduction of natural, organic, and dermatologically tested products. The convenience offered by modern retail channels like online platforms and hypermarkets also plays a significant role in market accessibility and consumer reach, further bolstering sales.
Bath and Shower Products Industry Market Size (In Billion)
The market segments reflect diverse consumer needs and purchasing habits. Shower creams and gels are expected to dominate the market, catering to the demand for convenient and moisturizing cleansing solutions. Bar soaps, while a traditional staple, are experiencing a resurgence with premium and artisanal offerings. Shower oils are gaining traction for their nourishing and luxurious properties. Distribution channels are shifting, with online retail stores rapidly expanding their footprint due to ease of access and a wider product selection. Supermarkets and hypermarkets remain strongholds, offering mass-market appeal. Geographically, North America and Europe currently hold significant market shares, driven by established economies and a high concentration of key players. However, the Asia Pacific region presents the most substantial growth potential, attributed to its large and rapidly urbanizing population, increasing disposable incomes, and a growing adoption of Western lifestyle trends related to personal care.
Bath and Shower Products Industry Company Market Share
Bath and Shower Products Industry Market Concentration & Innovation
The global bath and shower products market exhibits a moderately concentrated landscape, with a few dominant players accounting for a significant portion of market share, estimated to be over 500 Billion USD in revenue for the Base Year 2025. Innovation serves as a primary driver for market growth, with companies continuously investing in research and development to introduce novel formulations, sustainable packaging, and unique sensory experiences. Regulatory frameworks, primarily concerning product safety, ingredient transparency, and environmental impact, play a crucial role in shaping market entry and product development. The increasing consumer awareness regarding natural and organic ingredients, coupled with a demand for personalized and therapeutic bathing experiences, fuels innovation. Product substitutes, such as bar soaps and body lotions, offer alternatives but are increasingly being outpaced by the premiumization and specialized benefits offered by shower gels and oils. Mergers and acquisitions (M&A) activities, valued at approximately 5 Billion USD in the Historical Period 2019-2024, are anticipated to continue as companies seek to expand their product portfolios, gain market access, and acquire innovative technologies.
- Market Share Concentration: Dominated by a mix of multinational corporations and niche premium brands.
- Innovation Focus: Driven by natural ingredients, sustainability, and enhanced user experience.
- Regulatory Impact: Emphasis on safety, biodegradability, and ethical sourcing.
- Product Substitutes: Bar soaps remain a staple, but innovation in premium formats is shifting preference.
- M&A Value: Significant activity driven by strategic expansion and technology acquisition.
Bath and Shower Products Industry Industry Trends & Insights
The bath and shower products industry is poised for robust growth, projected to experience a Compound Annual Growth Rate (CAGR) of 6.8% from 2025 to 2033. This expansion is underpinned by a confluence of factors, including rising disposable incomes in emerging economies, an increasing focus on personal hygiene and wellness, and a growing consumer demand for premium and specialized bath and shower experiences. Technological disruptions are significantly impacting product development, with advancements in ingredient science leading to formulations offering enhanced skin benefits such as hydration, exfoliation, and anti-aging properties. The rise of the internet and e-commerce has democratized market access, allowing smaller brands to reach a wider audience and fostering a more competitive environment. Consumer preferences are increasingly shifting towards natural, organic, and ethically sourced ingredients, with a strong emphasis on sustainability and eco-friendly packaging solutions. This trend is evident in the growing popularity of refillable options and biodegradable materials.
Furthermore, the industry is witnessing a growing segmentation based on specific consumer needs and lifestyle choices. Products catering to sensitive skin, aromatherapy benefits, and targeted skin concerns like acne or dryness are gaining traction. The competitive dynamics are characterized by intense brand loyalty, coupled with a consumer willingness to experiment with new products that offer unique value propositions. Social media plays a pivotal role in influencing purchasing decisions, with influencer marketing and user-generated content shaping brand perception and product discovery. The market penetration of premium and specialty bath and shower products is expected to rise as consumers increasingly view these items as an integral part of their self-care routines rather than mere commodities. The ongoing pursuit of sensorial experiences – encompassing scent, texture, and lather – remains a critical differentiator for brands aiming to capture and retain consumer attention in this dynamic market. The forecast period is expected to see continued innovation in product formats, with a focus on multi-functional products that offer convenience and efficacy. The market penetration for online retail channels is predicted to surge, driven by convenience and a wider selection available to consumers.
Dominant Markets & Segments in Bath and Shower Products Industry
The global bath and shower products market is characterized by significant regional variations in dominance and consumer preferences. North America and Europe currently hold substantial market share, driven by high disposable incomes, established beauty and personal care markets, and a strong consumer awareness of premium and specialized products. However, the Asia-Pacific region is emerging as a rapid growth engine, fueled by a burgeoning middle class, increasing urbanization, and a growing adoption of Western beauty and hygiene standards. Within this dynamic market, specific segments are demonstrating remarkable strength and potential.
Type Segmentation:
- Shower Cream/Gel: This segment is projected to maintain its dominance, accounting for an estimated 450 Billion USD in market size by 2025. Its popularity stems from its convenience, luxurious feel, and the wide array of formulations catering to diverse skin types and preferences. Brands are innovating with moisturizing agents, natural extracts, and sophisticated fragrances to appeal to a discerning consumer base. The projected CAGR for this segment is 7.2% during the forecast period.
- Bar Soap: While historically a dominant product, bar soap's market share is stabilizing, with a market size estimated at 120 Billion USD for 2025. Innovation in this segment is focusing on artisanal formulations, natural ingredients, and eco-friendly packaging to recapture consumer interest. Its affordability and perceived simplicity continue to drive its appeal in certain demographics and regions.
- Shower Oil: This niche but rapidly growing segment, estimated at 50 Billion USD in 2025, offers a premium moisturizing experience. Its appeal lies in its ability to cleanse while deeply nourishing the skin, making it ideal for dry or mature skin types. The projected CAGR for shower oil is 8.5%, driven by increasing consumer awareness of its benefits.
- Other Types: This category, including bath bombs, salts, and cleansing bars, is valued at approximately 30 Billion USD for 2025 and is expected to grow at a steady pace, driven by the demand for unique and experiential bathing rituals.
Distribution Channel Segmentation:
- Supermarkets/Hypermarkets: This channel continues to be a cornerstone, representing an estimated 300 Billion USD in sales for 2025. Its strength lies in widespread accessibility, convenience, and the ability to cater to a broad consumer base seeking value and variety. Economic policies promoting consumer spending and robust retail infrastructure support the dominance of this channel.
- Online Retail Stores: This channel is experiencing exponential growth, with an estimated market size of 250 Billion USD in 2025 and a projected CAGR of 10.1%. Factors driving this surge include increasing internet penetration, the convenience of doorstep delivery, a wider product selection, and the ability for consumers to compare prices and read reviews. E-commerce giants and direct-to-consumer (DTC) brand websites are reshaping the retail landscape.
- Convenience Stores: While a smaller segment, convenience stores, valued at 50 Billion USD in 2025, play a role in impulse purchases and accessibility in urban areas. Their market share is expected to remain stable.
- Other Distribution Channels: This includes pharmacies, specialty beauty stores, and direct selling, collectively valued at 70 Billion USD in 2025. These channels often cater to niche markets and offer specialized product assortments.
Bath and Shower Products Industry Product Developments
Product development in the bath and shower products industry is heavily influenced by consumer demand for natural, sustainable, and effective solutions. Innovations are centered around enhanced moisturizing properties, skin-benefiting ingredients like hyaluronic acid and retinol, and the creation of unique sensory experiences through advanced fragrance technologies. The push for sustainability is leading to the development of biodegradable formulations and significant reductions in plastic packaging, with refillable pouches emerging as a key trend. Brands are focusing on creating multi-functional products that offer targeted skincare benefits, such as exfoliation and deep cleansing, while maintaining a gentle touch. This approach not only meets consumer needs for convenience but also provides a competitive advantage in a saturated market.
Report Scope & Segmentation Analysis
This comprehensive report analyzes the global bath and shower products market across various key segments. The Type segmentation includes Shower Cream/Gel, Bar Soap, Shower Oil, and Other Types, each analyzed for its market size, growth projections, and competitive dynamics. The Distribution Channel segmentation examines Supermarkets/Hypermarkets, Convenience Stores, Online Retail Stores, and Other Distribution Channels, providing insights into their market penetration, consumer reach, and evolving strategies. Each segment's analysis is tailored to understand its specific growth catalysts and challenges, offering a granular view of the market landscape.
- Shower Cream/Gel: Projected to maintain strong growth, driven by consumer preference for rich textures and diverse formulations.
- Bar Soap: Stable demand with ongoing innovation in natural and artisanal offerings.
- Shower Oil: High growth potential due to increasing consumer focus on skin hydration and premium care.
- Other Types: Experiential products like bath bombs are expected to see consistent, albeit niche, growth.
- Supermarkets/Hypermarkets: Continued dominance due to accessibility and broad product availability.
- Online Retail Stores: Rapid expansion driven by convenience, selection, and competitive pricing.
- Convenience Stores: Steady performance catering to immediate needs and impulse purchases.
- Other Distribution Channels: Focus on specialized retail and direct-to-consumer models.
Key Drivers of Bath and Shower Products Industry Growth
The bath and shower products industry is propelled by several key drivers, fostering its continuous expansion.
- Growing Health and Wellness Consciousness: Consumers are increasingly prioritizing personal hygiene and self-care routines, leading to higher demand for specialized bath and shower products that offer therapeutic and skin-enhancing benefits.
- Rising Disposable Incomes: Particularly in emerging economies, increasing disposable incomes translate to greater consumer spending on premium and luxury personal care items, including sophisticated bath and shower formulations.
- Innovation in Product Development: Continuous advancements in ingredient technology, sustainable packaging, and unique sensory experiences, such as aromatherapy and exotic fragrances, attract new consumers and encourage repeat purchases.
- E-commerce Expansion: The proliferation of online retail platforms provides greater accessibility and convenience, allowing consumers to easily discover and purchase a wider array of bath and shower products, thereby boosting market reach.
Challenges in the Bath and Shower Products Industry Sector
Despite robust growth, the bath and shower products industry faces several challenges that can temper its expansion.
- Intense Market Competition: The market is saturated with numerous global and local brands, leading to price pressures and a constant need for differentiation through innovation and marketing.
- Stringent Regulatory Compliance: Adherence to evolving safety, labeling, and environmental regulations across different regions adds complexity and cost to product development and manufacturing.
- Supply Chain Volatility: Disruptions in the sourcing of raw materials, shipping, and logistics can impact production schedules and increase operational costs.
- Consumer Price Sensitivity: While premium products are gaining traction, a significant portion of the market remains price-sensitive, making it challenging for brands to command higher prices without demonstrable value.
Emerging Opportunities in Bath and Shower Products Industry
The bath and shower products industry is ripe with emerging opportunities for forward-thinking brands.
- Sustainable and Eco-Friendly Products: A growing consumer demand for environmentally conscious products presents a significant opportunity for brands focusing on biodegradable ingredients, minimal packaging, and refillable options.
- Personalized and Customized Solutions: The trend towards personalized skincare extends to bath and shower products, with opportunities in offering tailored formulations for specific skin concerns or preferences.
- Expansion in Emerging Markets: Rapidly growing economies in Asia, Africa, and Latin America offer substantial untapped potential for brands to introduce their products and capture new customer bases.
- Technological Integration: Leveraging AI for personalized recommendations, AR for virtual product try-ons, and advanced ingredient delivery systems can create unique consumer experiences and drive engagement.
Leading Players in the Bath and Shower Products Industry Market
- Avon Beauty Products Pvt Ltd
- Reckitt Benckiser Group PLC
- Estee Lauder Inc
- Plum Island Soap Co
- L'Occitane International
- Unilever PLC
- Colgate-Palmolive Company
- L'Oreal SA
- Johnson & Johnson Consumer Inc
- L'Artisan Parfumeur
Key Developments in Bath and Shower Products Industry Industry
- October 2022: Barker Wellness and Kourtney Kardashian Barker collaborated to launch a new line of bath and body products, tapping into celebrity influence and the wellness trend.
- April 2021: Olay launched a significant product bundle featuring three new premium collections: Olay Premium Exfoliating Body Wash Collection, Olay Cleansing & Renewing Body Care Duo with Retinol, and the Olay Dermatologist Designed Collection, focusing on advanced skincare benefits.
- April 2021: Kiehl's introduced its Grapefruit Body Wash Refillable Pouch, a product demonstrating a strong commitment to environmental impact reduction by saving approximately 80% more plastic compared to single-use packaging.
Strategic Outlook for Bath and Shower Products Industry Market
The strategic outlook for the bath and shower products market remains exceptionally positive, driven by evolving consumer lifestyles and a continuous pursuit of wellness and self-care. Future growth will likely be shaped by brands that prioritize sustainability, innovation in natural ingredients, and personalized consumer experiences. The increasing digitalization of retail and marketing will continue to empower direct-to-consumer models and necessitate strong online presences. Companies that can effectively cater to niche segments, such as those seeking vegan, cruelty-free, or highly specialized formulations, will find significant opportunities for market penetration and brand loyalty. The integration of advanced technologies for product development and customer engagement will be crucial for maintaining a competitive edge in this dynamic and evolving industry.
Bath and Shower Products Industry Segmentation
-
1. Type
- 1.1. Shower Cream/Gel
- 1.2. Bar Soap
- 1.3. Shower Oil
- 1.4. Other Types
-
2. Distribution Channel
- 2.1. Supermarkets/Hypermarkets
- 2.2. Convenience Stores
- 2.3. Online Retail Stores
- 2.4. Other Distribution Channels
Bath and Shower Products Industry Segmentation By Geography
-
1. North America
- 1.1. United States
- 1.2. Canada
- 1.3. Mexico
- 1.4. Rest of North America
-
2. Europe
- 2.1. Germany
- 2.2. United Kingdom
- 2.3. Russia
- 2.4. France
- 2.5. Spain
- 2.6. Italy
- 2.7. Rest of Europe
-
3. Asia Pacific
- 3.1. China
- 3.2. Japan
- 3.3. Australia
- 3.4. India
- 3.5. Rest of Asia Pacific
-
4. Rest of the World
- 4.1. South America
- 4.2. Middle East and Africa
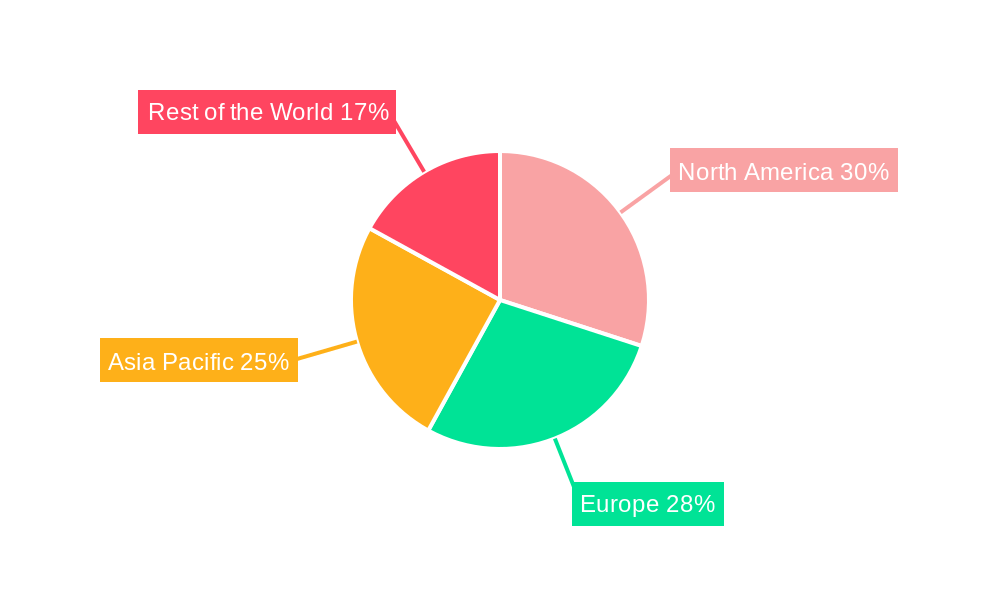
Bath and Shower Products Industry Regional Market Share
Geographic Coverage of Bath and Shower Products Industry
Bath and Shower Products Industry REPORT HIGHLIGHTS
| Aspects | Details |
|---|---|
| Study Period | 2020-2034 |
| Base Year | 2025 |
| Estimated Year | 2026 |
| Forecast Period | 2026-2034 |
| Historical Period | 2020-2025 |
| Growth Rate | CAGR of 4.55% from 2020-2034 |
| Segmentation |
|
Table of Contents
- 1. Introduction
- 1.1. Research Scope
- 1.2. Market Segmentation
- 1.3. Research Objective
- 1.4. Definitions and Assumptions
- 2. Executive Summary
- 2.1. Market Snapshot
- 3. Market Dynamics
- 3.1. Market Drivers
- 3.2. Market Restrains
- 3.3. Market Trends
- 3.4. Market Opportunities
- 4. Market Factor Analysis
- 4.1. Porters Five Forces
- 4.1.1. Bargaining Power of Suppliers
- 4.1.2. Bargaining Power of Buyers
- 4.1.3. Threat of New Entrants
- 4.1.4. Threat of Substitutes
- 4.1.5. Competitive Rivalry
- 4.2. PESTEL analysis
- 4.3. BCG Analysis
- 4.3.1. Stars (High Growth, High Market Share)
- 4.3.2. Cash Cows (Low Growth, High Market Share)
- 4.3.3. Question Mark (High Growth, Low Market Share)
- 4.3.4. Dogs (Low Growth, Low Market Share)
- 4.4. Ansoff Matrix Analysis
- 4.5. Supply Chain Analysis
- 4.6. Regulatory Landscape
- 4.7. Current Market Potential and Opportunity Assessment (TAM–SAM–SOM Framework)
- 4.8. RAX Analyst Note
- 4.1. Porters Five Forces
- 5. Market Analysis, Insights and Forecast 2021-2033
- 5.1. Market Analysis, Insights and Forecast - by Type
- 5.1.1. Shower Cream/Gel
- 5.1.2. Bar Soap
- 5.1.3. Shower Oil
- 5.1.4. Other Types
- 5.2. Market Analysis, Insights and Forecast - by Distribution Channel
- 5.2.1. Supermarkets/Hypermarkets
- 5.2.2. Convenience Stores
- 5.2.3. Online Retail Stores
- 5.2.4. Other Distribution Channels
- 5.3. Market Analysis, Insights and Forecast - by Region
- 5.3.1. North America
- 5.3.2. Europe
- 5.3.3. Asia Pacific
- 5.3.4. Rest of the World
- 5.1. Market Analysis, Insights and Forecast - by Type
- 6. Global Bath and Shower Products Industry Analysis, Insights and Forecast, 2021-2033
- 6.1. Market Analysis, Insights and Forecast - by Type
- 6.1.1. Shower Cream/Gel
- 6.1.2. Bar Soap
- 6.1.3. Shower Oil
- 6.1.4. Other Types
- 6.2. Market Analysis, Insights and Forecast - by Distribution Channel
- 6.2.1. Supermarkets/Hypermarkets
- 6.2.2. Convenience Stores
- 6.2.3. Online Retail Stores
- 6.2.4. Other Distribution Channels
- 6.1. Market Analysis, Insights and Forecast - by Type
- 7. North America Bath and Shower Products Industry Analysis, Insights and Forecast, 2020-2032
- 7.1. Market Analysis, Insights and Forecast - by Type
- 7.1.1. Shower Cream/Gel
- 7.1.2. Bar Soap
- 7.1.3. Shower Oil
- 7.1.4. Other Types
- 7.2. Market Analysis, Insights and Forecast - by Distribution Channel
- 7.2.1. Supermarkets/Hypermarkets
- 7.2.2. Convenience Stores
- 7.2.3. Online Retail Stores
- 7.2.4. Other Distribution Channels
- 7.1. Market Analysis, Insights and Forecast - by Type
- 8. Europe Bath and Shower Products Industry Analysis, Insights and Forecast, 2020-2032
- 8.1. Market Analysis, Insights and Forecast - by Type
- 8.1.1. Shower Cream/Gel
- 8.1.2. Bar Soap
- 8.1.3. Shower Oil
- 8.1.4. Other Types
- 8.2. Market Analysis, Insights and Forecast - by Distribution Channel
- 8.2.1. Supermarkets/Hypermarkets
- 8.2.2. Convenience Stores
- 8.2.3. Online Retail Stores
- 8.2.4. Other Distribution Channels
- 8.1. Market Analysis, Insights and Forecast - by Type
- 9. Asia Pacific Bath and Shower Products Industry Analysis, Insights and Forecast, 2020-2032
- 9.1. Market Analysis, Insights and Forecast - by Type
- 9.1.1. Shower Cream/Gel
- 9.1.2. Bar Soap
- 9.1.3. Shower Oil
- 9.1.4. Other Types
- 9.2. Market Analysis, Insights and Forecast - by Distribution Channel
- 9.2.1. Supermarkets/Hypermarkets
- 9.2.2. Convenience Stores
- 9.2.3. Online Retail Stores
- 9.2.4. Other Distribution Channels
- 9.1. Market Analysis, Insights and Forecast - by Type
- 10. Rest of the World Bath and Shower Products Industry Analysis, Insights and Forecast, 2020-2032
- 10.1. Market Analysis, Insights and Forecast - by Type
- 10.1.1. Shower Cream/Gel
- 10.1.2. Bar Soap
- 10.1.3. Shower Oil
- 10.1.4. Other Types
- 10.2. Market Analysis, Insights and Forecast - by Distribution Channel
- 10.2.1. Supermarkets/Hypermarkets
- 10.2.2. Convenience Stores
- 10.2.3. Online Retail Stores
- 10.2.4. Other Distribution Channels
- 10.1. Market Analysis, Insights and Forecast - by Type
- 11. Competitive Analysis
- 11.1. Company Profiles
- 11.1.1 Avon Beauty Products Pvt Ltd
- 11.1.1.1. Company Overview
- 11.1.1.2. Products
- 11.1.1.3. Company Financials
- 11.1.1.4. SWOT Analysis
- 11.1.2 Reckitt Benckiser Group PLC
- 11.1.2.1. Company Overview
- 11.1.2.2. Products
- 11.1.2.3. Company Financials
- 11.1.2.4. SWOT Analysis
- 11.1.3 Estee Lauder Inc
- 11.1.3.1. Company Overview
- 11.1.3.2. Products
- 11.1.3.3. Company Financials
- 11.1.3.4. SWOT Analysis
- 11.1.4 Plum Island Soap Co
- 11.1.4.1. Company Overview
- 11.1.4.2. Products
- 11.1.4.3. Company Financials
- 11.1.4.4. SWOT Analysis
- 11.1.5 L'Occitane International*List Not Exhaustive
- 11.1.5.1. Company Overview
- 11.1.5.2. Products
- 11.1.5.3. Company Financials
- 11.1.5.4. SWOT Analysis
- 11.1.6 Unilever PLC
- 11.1.6.1. Company Overview
- 11.1.6.2. Products
- 11.1.6.3. Company Financials
- 11.1.6.4. SWOT Analysis
- 11.1.7 Colgate-Palmolive Company
- 11.1.7.1. Company Overview
- 11.1.7.2. Products
- 11.1.7.3. Company Financials
- 11.1.7.4. SWOT Analysis
- 11.1.8 L'Oreal SA
- 11.1.8.1. Company Overview
- 11.1.8.2. Products
- 11.1.8.3. Company Financials
- 11.1.8.4. SWOT Analysis
- 11.1.9 Johnson & Johnson Consumer Inc
- 11.1.9.1. Company Overview
- 11.1.9.2. Products
- 11.1.9.3. Company Financials
- 11.1.9.4. SWOT Analysis
- 11.1.10 L'Artisan Parfumeur
- 11.1.10.1. Company Overview
- 11.1.10.2. Products
- 11.1.10.3. Company Financials
- 11.1.10.4. SWOT Analysis
- 11.1.1 Avon Beauty Products Pvt Ltd
- 11.2. Market Entropy
- 11.2.1 Company's Key Areas Served
- 11.2.2 Recent Developments
- 11.3. Company Market Share Analysis 2025
- 11.3.1 Top 5 Companies Market Share Analysis
- 11.3.2 Top 3 Companies Market Share Analysis
- 11.4. List of Potential Customers
- 12. Research Methodology
List of Figures
- Figure 1: Global Bath and Shower Products Industry Revenue Breakdown (billion, %) by Region 2025 & 2033
- Figure 2: Global Bath and Shower Products Industry Volume Breakdown (K Units, %) by Region 2025 & 2033
- Figure 3: North America Bath and Shower Products Industry Revenue (billion), by Type 2025 & 2033
- Figure 4: North America Bath and Shower Products Industry Volume (K Units), by Type 2025 & 2033
- Figure 5: North America Bath and Shower Products Industry Revenue Share (%), by Type 2025 & 2033
- Figure 6: North America Bath and Shower Products Industry Volume Share (%), by Type 2025 & 2033
- Figure 7: North America Bath and Shower Products Industry Revenue (billion), by Distribution Channel 2025 & 2033
- Figure 8: North America Bath and Shower Products Industry Volume (K Units), by Distribution Channel 2025 & 2033
- Figure 9: North America Bath and Shower Products Industry Revenue Share (%), by Distribution Channel 2025 & 2033
- Figure 10: North America Bath and Shower Products Industry Volume Share (%), by Distribution Channel 2025 & 2033
- Figure 11: North America Bath and Shower Products Industry Revenue (billion), by Country 2025 & 2033
- Figure 12: North America Bath and Shower Products Industry Volume (K Units), by Country 2025 & 2033
- Figure 13: North America Bath and Shower Products Industry Revenue Share (%), by Country 2025 & 2033
- Figure 14: North America Bath and Shower Products Industry Volume Share (%), by Country 2025 & 2033
- Figure 15: Europe Bath and Shower Products Industry Revenue (billion), by Type 2025 & 2033
- Figure 16: Europe Bath and Shower Products Industry Volume (K Units), by Type 2025 & 2033
- Figure 17: Europe Bath and Shower Products Industry Revenue Share (%), by Type 2025 & 2033
- Figure 18: Europe Bath and Shower Products Industry Volume Share (%), by Type 2025 & 2033
- Figure 19: Europe Bath and Shower Products Industry Revenue (billion), by Distribution Channel 2025 & 2033
- Figure 20: Europe Bath and Shower Products Industry Volume (K Units), by Distribution Channel 2025 & 2033
- Figure 21: Europe Bath and Shower Products Industry Revenue Share (%), by Distribution Channel 2025 & 2033
- Figure 22: Europe Bath and Shower Products Industry Volume Share (%), by Distribution Channel 2025 & 2033
- Figure 23: Europe Bath and Shower Products Industry Revenue (billion), by Country 2025 & 2033
- Figure 24: Europe Bath and Shower Products Industry Volume (K Units), by Country 2025 & 2033
- Figure 25: Europe Bath and Shower Products Industry Revenue Share (%), by Country 2025 & 2033
- Figure 26: Europe Bath and Shower Products Industry Volume Share (%), by Country 2025 & 2033
- Figure 27: Asia Pacific Bath and Shower Products Industry Revenue (billion), by Type 2025 & 2033
- Figure 28: Asia Pacific Bath and Shower Products Industry Volume (K Units), by Type 2025 & 2033
- Figure 29: Asia Pacific Bath and Shower Products Industry Revenue Share (%), by Type 2025 & 2033
- Figure 30: Asia Pacific Bath and Shower Products Industry Volume Share (%), by Type 2025 & 2033
- Figure 31: Asia Pacific Bath and Shower Products Industry Revenue (billion), by Distribution Channel 2025 & 2033
- Figure 32: Asia Pacific Bath and Shower Products Industry Volume (K Units), by Distribution Channel 2025 & 2033
- Figure 33: Asia Pacific Bath and Shower Products Industry Revenue Share (%), by Distribution Channel 2025 & 2033
- Figure 34: Asia Pacific Bath and Shower Products Industry Volume Share (%), by Distribution Channel 2025 & 2033
- Figure 35: Asia Pacific Bath and Shower Products Industry Revenue (billion), by Country 2025 & 2033
- Figure 36: Asia Pacific Bath and Shower Products Industry Volume (K Units), by Country 2025 & 2033
- Figure 37: Asia Pacific Bath and Shower Products Industry Revenue Share (%), by Country 2025 & 2033
- Figure 38: Asia Pacific Bath and Shower Products Industry Volume Share (%), by Country 2025 & 2033
- Figure 39: Rest of the World Bath and Shower Products Industry Revenue (billion), by Type 2025 & 2033
- Figure 40: Rest of the World Bath and Shower Products Industry Volume (K Units), by Type 2025 & 2033
- Figure 41: Rest of the World Bath and Shower Products Industry Revenue Share (%), by Type 2025 & 2033
- Figure 42: Rest of the World Bath and Shower Products Industry Volume Share (%), by Type 2025 & 2033
- Figure 43: Rest of the World Bath and Shower Products Industry Revenue (billion), by Distribution Channel 2025 & 2033
- Figure 44: Rest of the World Bath and Shower Products Industry Volume (K Units), by Distribution Channel 2025 & 2033
- Figure 45: Rest of the World Bath and Shower Products Industry Revenue Share (%), by Distribution Channel 2025 & 2033
- Figure 46: Rest of the World Bath and Shower Products Industry Volume Share (%), by Distribution Channel 2025 & 2033
- Figure 47: Rest of the World Bath and Shower Products Industry Revenue (billion), by Country 2025 & 2033
- Figure 48: Rest of the World Bath and Shower Products Industry Volume (K Units), by Country 2025 & 2033
- Figure 49: Rest of the World Bath and Shower Products Industry Revenue Share (%), by Country 2025 & 2033
- Figure 50: Rest of the World Bath and Shower Products Industry Volume Share (%), by Country 2025 & 2033
List of Tables
- Table 1: Global Bath and Shower Products Industry Revenue billion Forecast, by Type 2020 & 2033
- Table 2: Global Bath and Shower Products Industry Volume K Units Forecast, by Type 2020 & 2033
- Table 3: Global Bath and Shower Products Industry Revenue billion Forecast, by Distribution Channel 2020 & 2033
- Table 4: Global Bath and Shower Products Industry Volume K Units Forecast, by Distribution Channel 2020 & 2033
- Table 5: Global Bath and Shower Products Industry Revenue billion Forecast, by Region 2020 & 2033
- Table 6: Global Bath and Shower Products Industry Volume K Units Forecast, by Region 2020 & 2033
- Table 7: Global Bath and Shower Products Industry Revenue billion Forecast, by Type 2020 & 2033
- Table 8: Global Bath and Shower Products Industry Volume K Units Forecast, by Type 2020 & 2033
- Table 9: Global Bath and Shower Products Industry Revenue billion Forecast, by Distribution Channel 2020 & 2033
- Table 10: Global Bath and Shower Products Industry Volume K Units Forecast, by Distribution Channel 2020 & 2033
- Table 11: Global Bath and Shower Products Industry Revenue billion Forecast, by Country 2020 & 2033
- Table 12: Global Bath and Shower Products Industry Volume K Units Forecast, by Country 2020 & 2033
- Table 13: United States Bath and Shower Products Industry Revenue (billion) Forecast, by Application 2020 & 2033
- Table 14: United States Bath and Shower Products Industry Volume (K Units) Forecast, by Application 2020 & 2033
- Table 15: Canada Bath and Shower Products Industry Revenue (billion) Forecast, by Application 2020 & 2033
- Table 16: Canada Bath and Shower Products Industry Volume (K Units) Forecast, by Application 2020 & 2033
- Table 17: Mexico Bath and Shower Products Industry Revenue (billion) Forecast, by Application 2020 & 2033
- Table 18: Mexico Bath and Shower Products Industry Volume (K Units) Forecast, by Application 2020 & 2033
- Table 19: Rest of North America Bath and Shower Products Industry Revenue (billion) Forecast, by Application 2020 & 2033
- Table 20: Rest of North America Bath and Shower Products Industry Volume (K Units) Forecast, by Application 2020 & 2033
- Table 21: Global Bath and Shower Products Industry Revenue billion Forecast, by Type 2020 & 2033
- Table 22: Global Bath and Shower Products Industry Volume K Units Forecast, by Type 2020 & 2033
- Table 23: Global Bath and Shower Products Industry Revenue billion Forecast, by Distribution Channel 2020 & 2033
- Table 24: Global Bath and Shower Products Industry Volume K Units Forecast, by Distribution Channel 2020 & 2033
- Table 25: Global Bath and Shower Products Industry Revenue billion Forecast, by Country 2020 & 2033
- Table 26: Global Bath and Shower Products Industry Volume K Units Forecast, by Country 2020 & 2033
- Table 27: Germany Bath and Shower Products Industry Revenue (billion) Forecast, by Application 2020 & 2033
- Table 28: Germany Bath and Shower Products Industry Volume (K Units) Forecast, by Application 2020 & 2033
- Table 29: United Kingdom Bath and Shower Products Industry Revenue (billion) Forecast, by Application 2020 & 2033
- Table 30: United Kingdom Bath and Shower Products Industry Volume (K Units) Forecast, by Application 2020 & 2033
- Table 31: Russia Bath and Shower Products Industry Revenue (billion) Forecast, by Application 2020 & 2033
- Table 32: Russia Bath and Shower Products Industry Volume (K Units) Forecast, by Application 2020 & 2033
- Table 33: France Bath and Shower Products Industry Revenue (billion) Forecast, by Application 2020 & 2033
- Table 34: France Bath and Shower Products Industry Volume (K Units) Forecast, by Application 2020 & 2033
- Table 35: Spain Bath and Shower Products Industry Revenue (billion) Forecast, by Application 2020 & 2033
- Table 36: Spain Bath and Shower Products Industry Volume (K Units) Forecast, by Application 2020 & 2033
- Table 37: Italy Bath and Shower Products Industry Revenue (billion) Forecast, by Application 2020 & 2033
- Table 38: Italy Bath and Shower Products Industry Volume (K Units) Forecast, by Application 2020 & 2033
- Table 39: Rest of Europe Bath and Shower Products Industry Revenue (billion) Forecast, by Application 2020 & 2033
- Table 40: Rest of Europe Bath and Shower Products Industry Volume (K Units) Forecast, by Application 2020 & 2033
- Table 41: Global Bath and Shower Products Industry Revenue billion Forecast, by Type 2020 & 2033
- Table 42: Global Bath and Shower Products Industry Volume K Units Forecast, by Type 2020 & 2033
- Table 43: Global Bath and Shower Products Industry Revenue billion Forecast, by Distribution Channel 2020 & 2033
- Table 44: Global Bath and Shower Products Industry Volume K Units Forecast, by Distribution Channel 2020 & 2033
- Table 45: Global Bath and Shower Products Industry Revenue billion Forecast, by Country 2020 & 2033
- Table 46: Global Bath and Shower Products Industry Volume K Units Forecast, by Country 2020 & 2033
- Table 47: China Bath and Shower Products Industry Revenue (billion) Forecast, by Application 2020 & 2033
- Table 48: China Bath and Shower Products Industry Volume (K Units) Forecast, by Application 2020 & 2033
- Table 49: Japan Bath and Shower Products Industry Revenue (billion) Forecast, by Application 2020 & 2033
- Table 50: Japan Bath and Shower Products Industry Volume (K Units) Forecast, by Application 2020 & 2033
- Table 51: Australia Bath and Shower Products Industry Revenue (billion) Forecast, by Application 2020 & 2033
- Table 52: Australia Bath and Shower Products Industry Volume (K Units) Forecast, by Application 2020 & 2033
- Table 53: India Bath and Shower Products Industry Revenue (billion) Forecast, by Application 2020 & 2033
- Table 54: India Bath and Shower Products Industry Volume (K Units) Forecast, by Application 2020 & 2033
- Table 55: Rest of Asia Pacific Bath and Shower Products Industry Revenue (billion) Forecast, by Application 2020 & 2033
- Table 56: Rest of Asia Pacific Bath and Shower Products Industry Volume (K Units) Forecast, by Application 2020 & 2033
- Table 57: Global Bath and Shower Products Industry Revenue billion Forecast, by Type 2020 & 2033
- Table 58: Global Bath and Shower Products Industry Volume K Units Forecast, by Type 2020 & 2033
- Table 59: Global Bath and Shower Products Industry Revenue billion Forecast, by Distribution Channel 2020 & 2033
- Table 60: Global Bath and Shower Products Industry Volume K Units Forecast, by Distribution Channel 2020 & 2033
- Table 61: Global Bath and Shower Products Industry Revenue billion Forecast, by Country 2020 & 2033
- Table 62: Global Bath and Shower Products Industry Volume K Units Forecast, by Country 2020 & 2033
- Table 63: South America Bath and Shower Products Industry Revenue (billion) Forecast, by Application 2020 & 2033
- Table 64: South America Bath and Shower Products Industry Volume (K Units) Forecast, by Application 2020 & 2033
- Table 65: Middle East and Africa Bath and Shower Products Industry Revenue (billion) Forecast, by Application 2020 & 2033
- Table 66: Middle East and Africa Bath and Shower Products Industry Volume (K Units) Forecast, by Application 2020 & 2033
Frequently Asked Questions
1. What is the projected Compound Annual Growth Rate (CAGR) of the Bath and Shower Products Industry?
The projected CAGR is approximately 4.55%.
2. Which companies are prominent players in the Bath and Shower Products Industry?
Key companies in the market include Avon Beauty Products Pvt Ltd, Reckitt Benckiser Group PLC, Estee Lauder Inc, Plum Island Soap Co, L'Occitane International*List Not Exhaustive, Unilever PLC, Colgate-Palmolive Company, L'Oreal SA, Johnson & Johnson Consumer Inc, L'Artisan Parfumeur.
3. What are the main segments of the Bath and Shower Products Industry?
The market segments include Type, Distribution Channel.
4. Can you provide details about the market size?
The market size is estimated to be USD 52.1 billion as of 2022.
5. What are some drivers contributing to market growth?
Focus on Grooming Habits and Self-Perceptions among Emerging Adults; Aggressive Marketing Influencing Buying Behavior.
6. What are the notable trends driving market growth?
Augmented Demand for Organic Bath and Shower Products.
7. Are there any restraints impacting market growth?
Chemicals Affecting Hair Health.
8. Can you provide examples of recent developments in the market?
In October 2022, Barker Wellness and Kourtney Kardashian Barker collaborated to launch bath and body products.
9. What pricing options are available for accessing the report?
Pricing options include single-user, multi-user, and enterprise licenses priced at USD 4750, USD 5250, and USD 8750 respectively.
10. Is the market size provided in terms of value or volume?
The market size is provided in terms of value, measured in billion and volume, measured in K Units.
11. Are there any specific market keywords associated with the report?
Yes, the market keyword associated with the report is "Bath and Shower Products Industry," which aids in identifying and referencing the specific market segment covered.
12. How do I determine which pricing option suits my needs best?
The pricing options vary based on user requirements and access needs. Individual users may opt for single-user licenses, while businesses requiring broader access may choose multi-user or enterprise licenses for cost-effective access to the report.
13. Are there any additional resources or data provided in the Bath and Shower Products Industry report?
While the report offers comprehensive insights, it's advisable to review the specific contents or supplementary materials provided to ascertain if additional resources or data are available.
14. How can I stay updated on further developments or reports in the Bath and Shower Products Industry?
To stay informed about further developments, trends, and reports in the Bath and Shower Products Industry, consider subscribing to industry newsletters, following relevant companies and organizations, or regularly checking reputable industry news sources and publications.
Methodology
Step 1 - Identification of Relevant Samples Size from Population Database


Step 2 - Approaches for Defining Global Market Size (Value, Volume* & Price*)

Note*: In applicable scenarios
Step 3 - Data Sources
Primary Research
- Web Analytics
- Survey Reports
- Research Institute
- Latest Research Reports
- Opinion Leaders
Secondary Research
- Annual Reports
- White Paper
- Latest Press Release
- Industry Association
- Paid Database
- Investor Presentations

Step 4 - Data Triangulation
Involves using different sources of information in order to increase the validity of a study
These sources are likely to be stakeholders in a program - participants, other researchers, program staff, other community members, and so on.
Then we put all data in single framework & apply various statistical tools to find out the dynamic on the market.
During the analysis stage, feedback from the stakeholder groups would be compared to determine areas of agreement as well as areas of divergence

