

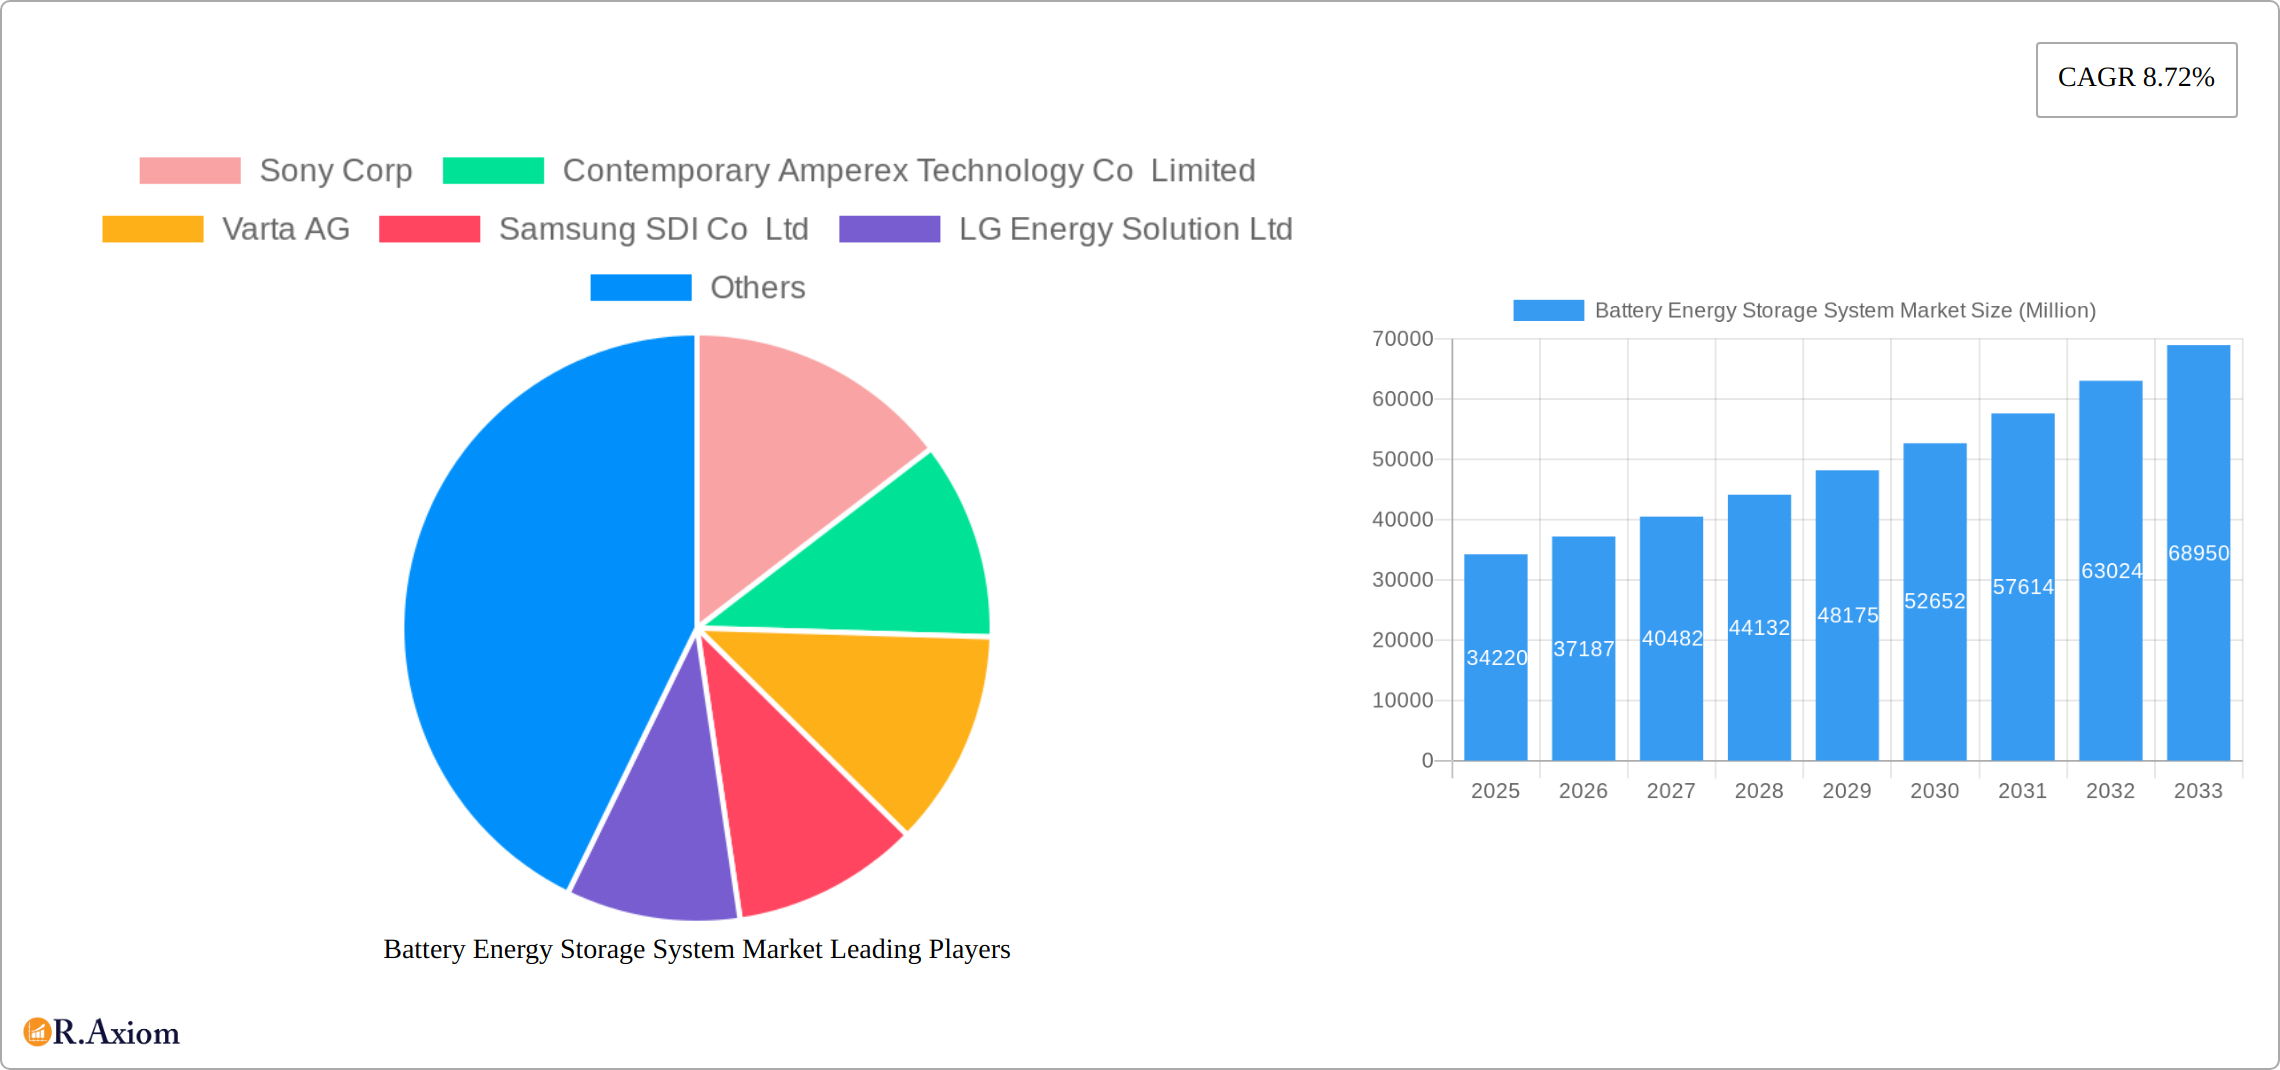
Key Insights
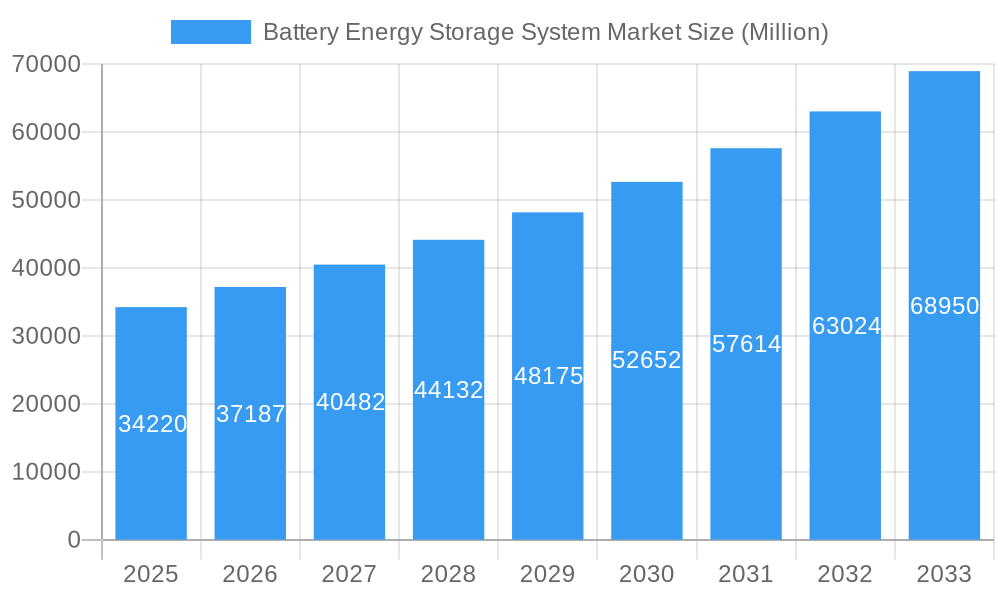
The Battery Energy Storage System (BESS) market is experiencing robust growth, projected to reach \$34.22 billion in 2025 and maintain a Compound Annual Growth Rate (CAGR) of 8.72% from 2025 to 2033. This expansion is driven by several key factors. The increasing adoption of renewable energy sources like solar and wind power necessitates efficient energy storage solutions to address intermittency issues. Government initiatives promoting clean energy and grid modernization are further fueling demand. Technological advancements in battery chemistry, particularly in lithium-ion technology, are leading to improved performance, longer lifespans, and reduced costs, making BESS solutions more economically viable for a wider range of applications. The diverse applications across utility, commercial & industrial, and residential sectors contribute to the market's overall growth. Lithium-ion batteries currently dominate the market due to their high energy density and relatively long cycle life, but other technologies like flow batteries are gaining traction for large-scale energy storage applications. The geographical distribution reflects strong growth across North America and Asia Pacific, with China and the United States representing significant market share due to substantial investments in renewable energy infrastructure and supportive regulatory frameworks. Competition is intense, with key players like Tesla, LG Energy Solution, and CATL vying for market leadership through continuous innovation and expansion.
Battery Energy Storage System Market Market Size (In Billion)
The market segmentation reveals important insights into consumer preferences and technological advancements. While lithium-ion batteries currently hold the largest segment share within the battery type category, the "Other Types" segment, particularly flow batteries, demonstrates significant growth potential, driven by their suitability for large-scale, long-duration energy storage needs. In the application segment, the utility sector shows the strongest demand currently, but the commercial and industrial sectors are experiencing rapid growth due to increasing electrification and the need for reliable backup power. Regional analysis shows that North America and Asia-Pacific are the dominant markets, reflecting substantial investments in renewable energy infrastructure and supportive government policies. However, growth is anticipated across all regions as the global shift towards clean energy accelerates. Continued innovation in battery technology, coupled with decreasing costs, will further unlock the BESS market's potential in the coming years.
Battery Energy Storage System Market Company Market Share
Battery Energy Storage System (BESS) Market: A Comprehensive Report (2019-2033)
This in-depth report provides a comprehensive analysis of the global Battery Energy Storage System (BESS) market, encompassing market size, growth projections, competitive landscape, and key industry trends from 2019 to 2033. The study period covers the historical period (2019-2024), the base year (2025), and the forecast period (2025-2033), offering valuable insights for stakeholders across the value chain. The report incorporates detailed segmentations by type (Lithium-ion Batteries, Lead-acid Batteries, Nickel Metal Hydride, Other Types) and application (Utility, Commercial & Industrial, Residential), providing a granular understanding of market dynamics. Key players such as Sony Corp, Contemporary Amperex Technology Co Limited, Varta AG, Samsung SDI Co Ltd, LG Energy Solution Ltd, Cellcube Energy Storage System Inc, BYD Company Limited, Tesla Inc, and Panasonic Corporation are analyzed, along with emerging players and their market strategies. The report also highlights recent significant industry developments, including substantial investments and project launches.
Battery Energy Storage System Market Concentration & Innovation
The Battery Energy Storage System market exhibits a moderately concentrated landscape, with a few dominant players holding significant market share. However, the market is witnessing increasing participation from smaller players, particularly in niche segments like flow batteries and specialized applications. Market share data for 2024 indicates that the top 5 players account for approximately xx% of the global market, with the remaining xx% distributed amongst numerous competitors. The intense competition fuels innovation, driving advancements in battery chemistry, energy density, and cost-effectiveness.
- Innovation Drivers: The need for grid stability, renewable energy integration, and the growth of electric vehicles are key drivers pushing innovation in BESS technology. This includes the development of improved battery chemistries, advanced energy management systems, and innovative battery recycling solutions.
- Regulatory Frameworks: Government policies promoting renewable energy integration and carbon reduction are influencing market growth significantly. Incentive programs and regulations supporting BESS deployment are creating favorable market conditions.
- Product Substitutes: While BESS is currently the most viable option for large-scale energy storage, technologies such as pumped hydro storage, compressed air energy storage, and thermal energy storage present alternative solutions in specific applications. However, BESS advantages in terms of flexibility, scalability, and deployment ease make it the dominant choice for many applications.
- End-User Trends: The increasing adoption of renewable energy sources like solar and wind power across utility, commercial & industrial, and residential sectors is fueling robust BESS demand. The growing preference for reliable power supply, particularly in regions with intermittent renewable energy, is strengthening this trend.
- M&A Activities: The BESS sector has seen several mergers and acquisitions (M&As) in recent years, driven by the desire for scale, technology acquisition, and market expansion. The average M&A deal value in 2023 was approximately USD xx Million, with a total deal volume of xx deals. These activities further consolidate the market and accelerate innovation.
Battery Energy Storage System Market Industry Trends & Insights
The global Battery Energy Storage System (BESS) market is experiencing remarkable growth, driven by a confluence of factors. Market projections indicate a robust Compound Annual Growth Rate (CAGR) of [Insert Updated CAGR]% during the forecast period (2025-2033), resulting in a market value estimated at USD [Insert Updated Market Value] Million by 2033. This expansion is fueled by several key drivers: the accelerating integration of renewable energy sources like solar and wind power, the urgent need for grid modernization and stabilization to accommodate intermittent renewable energy sources, and the burgeoning adoption of electric vehicles (EVs) and plug-in hybrid electric vehicles (PHEVs). Significant technological advancements, such as breakthroughs in battery chemistry (e.g., improved lithium-ion technologies, solid-state batteries), enhanced energy density, and longer lifecycles, are further accelerating market penetration. Furthermore, the global shift towards sustainable energy solutions and the demand for reliable and resilient power supplies are bolstering the demand for BESS across diverse sectors. The competitive landscape is characterized by intense research and development (R&D) activities, strategic mergers and acquisitions, collaborative partnerships, and geographical expansion into both established and emerging markets. The market penetration rate of BESS systems within the renewable energy sector has shown a significant increase, rising from [Insert Updated 2019 Percentage]% in 2019 to [Insert Updated 2024 Percentage]% in 2024, vividly illustrating the rapid adoption of this crucial technology.
Dominant Markets & Segments in Battery Energy Storage System Market
The global BESS market is geographically diverse, with significant regional variations in adoption and growth rates. While North America and Europe currently hold a large share of the market, Asia-Pacific is witnessing the fastest growth, driven by strong government support for renewable energy and the rapidly expanding EV sector. Within the BESS market segments, Lithium-ion batteries dominate the market due to their high energy density and cycle life. However, other technologies like flow batteries and sodium-sulfur batteries are showing promise in specific applications.
Dominant Region: Asia-Pacific is expected to dominate the market, driven by factors such as supportive government policies, rapid growth in the renewable energy sector, and increasing electric vehicle adoption.
Dominant Type: Lithium-ion batteries are the dominant technology, owing to their high energy density, long cycle life, and relatively low cost.
Dominant Application: The utility sector is the largest application segment, accounting for approximately xx% of the market, driven by the need to stabilize power grids and integrate renewable energy sources.
Key Drivers by Segment:
- Lithium-ion Batteries: Technological advancements, economies of scale, and high energy density.
- Lead-acid Batteries: Lower initial cost compared to other battery types.
- Nickel Metal Hydride: Suitable for niche applications requiring high power density.
- Other Types (Sodium-sulfur and Flow Batteries): Emerging technologies with potential for specific applications, especially long-duration storage.
- Utility Sector: Government regulations, grid stabilization needs, and increasing renewable energy integration.
- Commercial & Industrial Sector: Power backup solutions, cost savings through peak demand shaving.
- Residential Sector: Growing consumer awareness of sustainability, backup power during outages, and decreasing battery prices.
Battery Energy Storage System Market Product Developments
Recent product innovations within the BESS market are intensely focused on enhancing key performance indicators: improving energy density, extending cycle life, strengthening safety features, and reducing overall costs. Manufacturers are continuously developing novel battery chemistries and refining existing technologies to optimize performance and broaden the range of applications. Notable advancements include the emergence of solid-state batteries promising higher energy density and improved safety, sophisticated thermal management systems for enhanced performance and longevity, and the integration of advanced energy management software providing optimized control and grid interaction. These ongoing developments are significantly enhancing the competitiveness of BESS systems across various sectors, facilitating wider market adoption and penetration in diverse applications.
Report Scope & Segmentation Analysis
This report provides a detailed segmentation analysis of the Battery Energy Storage System market based on type and application.
By Type:
Lithium-ion Batteries: This segment is expected to dominate the market due to its high energy density and long cycle life. Market size in 2025: USD xx Million; Projected CAGR: xx%. Competitive landscape is intensely competitive, with multiple established and emerging players.
Lead-acid Batteries: This segment is expected to maintain a moderate market share, primarily in niche applications where cost is a significant factor. Market size in 2025: USD xx Million; Projected CAGR: xx%. Competition is less intense compared to Lithium-ion.
Nickel Metal Hydride Batteries: This segment holds a smaller market share, primarily used in specific applications requiring high power output. Market size in 2025: USD xx Million; Projected CAGR: xx%. Competition is limited.
Other Types (Sodium-sulfur and Flow Batteries): This segment presents emerging opportunities, but current market share remains relatively small. Market size in 2025: USD xx Million; Projected CAGR: xx%. Competitive landscape is nascent.
By Application:
Utility: This is the largest application segment, driven by the increasing adoption of renewable energy sources and the need for grid stability.
Commercial & Industrial: This segment is experiencing steady growth, fueled by the need for backup power and cost optimization.
Residential: This segment is exhibiting rapid growth, driven by increasing consumer awareness and the decreasing cost of BESS systems.
Key Drivers of Battery Energy Storage System Market Growth
The growth of the Battery Energy Storage System market is driven by a confluence of factors. The increasing adoption of renewable energy sources, such as solar and wind power, necessitates effective energy storage solutions to address intermittency and ensure grid stability. Governments worldwide are enacting policies and offering incentives to promote renewable energy integration and reduce carbon emissions, boosting BESS demand. Advances in battery technology, including improved energy density, cycle life, and cost-effectiveness, are making BESS systems more attractive and accessible. The rising demand for reliable power backup in both developed and developing economies further propels market expansion.
Challenges in the Battery Energy Storage System Market Sector
Despite the significant growth potential, the Battery Energy Storage System market faces several challenges. High initial investment costs can be a barrier to entry for some consumers and businesses. The availability of raw materials needed for battery production and the sustainability of battery manufacturing processes pose concerns. Concerns regarding battery safety, lifespan, and disposal also need to be addressed. Furthermore, intense competition and the evolving regulatory landscape add complexity to the market. The impact of these challenges is estimated to reduce the overall market growth by approximately xx% during the forecast period.
Emerging Opportunities in Battery Energy Storage System Market
The Battery Energy Storage System market presents exciting opportunities for innovation and expansion. The development of next-generation battery technologies, such as solid-state batteries and advanced flow batteries, offers potential for improved performance and lower costs. The integration of BESS into smart grids and microgrids is gaining traction, presenting new applications and revenue streams. Emerging markets in developing countries are rapidly adopting renewable energy and BESS technologies, creating significant growth opportunities. Moreover, the increasing integration of BESS in electric vehicle charging infrastructure expands market potential.
Leading Players in the Battery Energy Storage System Market Market
- Sony Corp
- Contemporary Amperex Technology Co Limited
- Varta AG
- Samsung SDI Co Ltd
- LG Energy Solution Ltd
- Cellcube Energy Storage System Inc
- BYD Company Limited
- Tesla Inc
- Panasonic Corporation
Key Developments in Battery Energy Storage System Market Industry
February 2024: Chhattisgarh, India, inaugurated a 100 MW solar facility with a BESS, demonstrating the growing adoption of BESS in large-scale renewable energy projects. This development significantly boosts the BESS market in India and highlights its potential for similar projects globally.
February 2024: GFCL EV Products Ltd. announced a USD 720 Million investment to supply 200 GWh of EV and BESS solutions globally. This substantial investment showcases the confidence in the BESS market's growth potential and signals significant expansion in the sector.
December 2023: NamPower, Namibia, awarded EPC contracts for a 54 MW/54 MWh grid-scale BESS project. This project demonstrates the increasing adoption of BESS in regions with grid instability and underscores the growing global demand for grid-scale energy storage solutions.
Strategic Outlook for Battery Energy Storage System Market Market
The future of the Battery Energy Storage System market is bright, driven by sustained growth in renewable energy adoption, advancements in battery technology, and supportive government policies. The market is poised for considerable expansion, fueled by the increasing need for grid stability, improved energy efficiency, and the growing adoption of electric vehicles. Emerging technologies and new applications will further fuel market growth and create new opportunities for innovation and investment. The focus on sustainability and carbon reduction will continue to be a key driver, solidifying the long-term growth trajectory of the BESS market.
Battery Energy Storage System Market Segmentation
-
1. Type
- 1.1. Lithium-ion Batteries
- 1.2. Lead-acid Batteries
- 1.3. Nickel Metal Hydride
- 1.4. Other Ty
-
2. Application
- 2.1. Utility
- 2.2. Commercial and Industrial
- 2.3. Residential
Battery Energy Storage System Market Segmentation By Geography
-
1. North America
- 1.1. United States
- 1.2. Canada
- 1.3. Rest of North America
-
2. Europe
- 2.1. Germany
- 2.2. France
- 2.3. United Kingdom
- 2.4. Italy
- 2.5. Spain
- 2.6. Nordic
- 2.7. Turkey
- 2.8. Russia
- 2.9. Rest of Europe
-
3. Asia Pacific
- 3.1. China
- 3.2. India
- 3.3. Japan
- 3.4. Australia
- 3.5. Malaysia
- 3.6. Thailand
- 3.7. Indonesia
- 3.8. Vietnam
- 3.9. Rest of Asia pacific
-
4. South America
- 4.1. Brazil
- 4.2. Argentina
- 4.3. Chile
- 4.4. Colombia
- 4.5. Rest of South America
-
5. Middle East and Africa
- 5.1. Saudi Arabia
- 5.2. United Arab Emirates
- 5.3. South Africa
- 5.4. Qatar
- 5.5. Nigeria
- 5.6. Egypt
- 5.7. Rest of Middle East
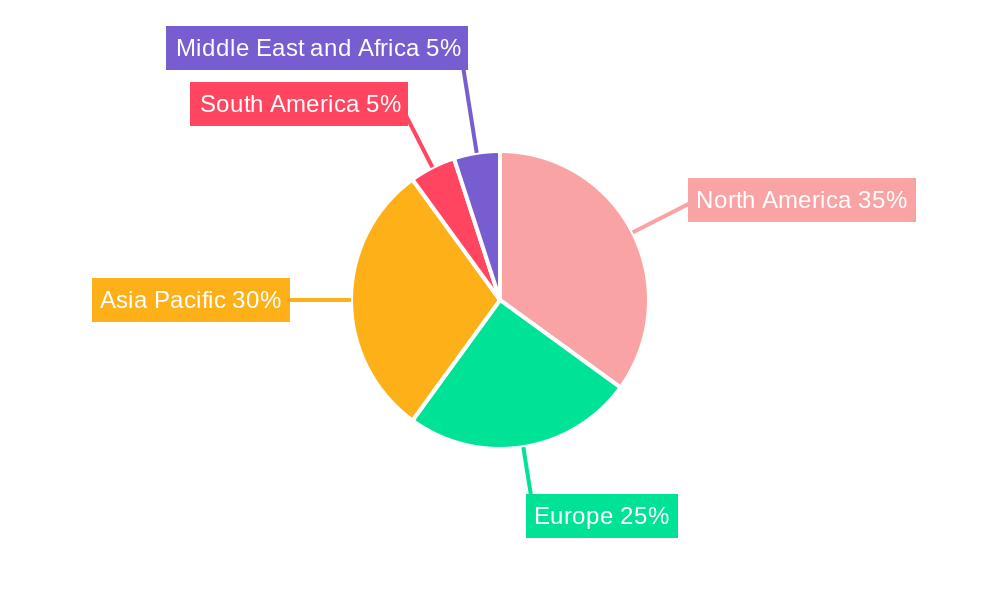
Battery Energy Storage System Market Regional Market Share
Geographic Coverage of Battery Energy Storage System Market
Battery Energy Storage System Market REPORT HIGHLIGHTS
| Aspects | Details |
|---|---|
| Study Period | 2020-2034 |
| Base Year | 2025 |
| Estimated Year | 2026 |
| Forecast Period | 2026-2034 |
| Historical Period | 2020-2025 |
| Growth Rate | CAGR of 8.72% from 2020-2034 |
| Segmentation |
|
Table of Contents
- 1. Introduction
- 1.1. Research Scope
- 1.2. Market Segmentation
- 1.3. Research Objective
- 1.4. Definitions and Assumptions
- 2. Executive Summary
- 2.1. Market Snapshot
- 3. Market Dynamics
- 3.1. Market Drivers
- 3.2. Market Restrains
- 3.3. Market Trends
- 3.4. Market Opportunities
- 4. Market Factor Analysis
- 4.1. Porters Five Forces
- 4.1.1. Bargaining Power of Suppliers
- 4.1.2. Bargaining Power of Buyers
- 4.1.3. Threat of New Entrants
- 4.1.4. Threat of Substitutes
- 4.1.5. Competitive Rivalry
- 4.2. PESTEL analysis
- 4.3. BCG Analysis
- 4.3.1. Stars (High Growth, High Market Share)
- 4.3.2. Cash Cows (Low Growth, High Market Share)
- 4.3.3. Question Mark (High Growth, Low Market Share)
- 4.3.4. Dogs (Low Growth, Low Market Share)
- 4.4. Ansoff Matrix Analysis
- 4.5. Supply Chain Analysis
- 4.6. Regulatory Landscape
- 4.7. Current Market Potential and Opportunity Assessment (TAM–SAM–SOM Framework)
- 4.8. RAX Analyst Note
- 4.1. Porters Five Forces
- 5. Market Analysis, Insights and Forecast 2021-2033
- 5.1. Market Analysis, Insights and Forecast - by Type
- 5.1.1. Lithium-ion Batteries
- 5.1.2. Lead-acid Batteries
- 5.1.3. Nickel Metal Hydride
- 5.1.4. Other Ty
- 5.2. Market Analysis, Insights and Forecast - by Application
- 5.2.1. Utility
- 5.2.2. Commercial and Industrial
- 5.2.3. Residential
- 5.3. Market Analysis, Insights and Forecast - by Region
- 5.3.1. North America
- 5.3.2. Europe
- 5.3.3. Asia Pacific
- 5.3.4. South America
- 5.3.5. Middle East and Africa
- 5.1. Market Analysis, Insights and Forecast - by Type
- 6. Global Battery Energy Storage System Market Analysis, Insights and Forecast, 2021-2033
- 6.1. Market Analysis, Insights and Forecast - by Type
- 6.1.1. Lithium-ion Batteries
- 6.1.2. Lead-acid Batteries
- 6.1.3. Nickel Metal Hydride
- 6.1.4. Other Ty
- 6.2. Market Analysis, Insights and Forecast - by Application
- 6.2.1. Utility
- 6.2.2. Commercial and Industrial
- 6.2.3. Residential
- 6.1. Market Analysis, Insights and Forecast - by Type
- 7. North America Battery Energy Storage System Market Analysis, Insights and Forecast, 2020-2032
- 7.1. Market Analysis, Insights and Forecast - by Type
- 7.1.1. Lithium-ion Batteries
- 7.1.2. Lead-acid Batteries
- 7.1.3. Nickel Metal Hydride
- 7.1.4. Other Ty
- 7.2. Market Analysis, Insights and Forecast - by Application
- 7.2.1. Utility
- 7.2.2. Commercial and Industrial
- 7.2.3. Residential
- 7.1. Market Analysis, Insights and Forecast - by Type
- 8. Europe Battery Energy Storage System Market Analysis, Insights and Forecast, 2020-2032
- 8.1. Market Analysis, Insights and Forecast - by Type
- 8.1.1. Lithium-ion Batteries
- 8.1.2. Lead-acid Batteries
- 8.1.3. Nickel Metal Hydride
- 8.1.4. Other Ty
- 8.2. Market Analysis, Insights and Forecast - by Application
- 8.2.1. Utility
- 8.2.2. Commercial and Industrial
- 8.2.3. Residential
- 8.1. Market Analysis, Insights and Forecast - by Type
- 9. Asia Pacific Battery Energy Storage System Market Analysis, Insights and Forecast, 2020-2032
- 9.1. Market Analysis, Insights and Forecast - by Type
- 9.1.1. Lithium-ion Batteries
- 9.1.2. Lead-acid Batteries
- 9.1.3. Nickel Metal Hydride
- 9.1.4. Other Ty
- 9.2. Market Analysis, Insights and Forecast - by Application
- 9.2.1. Utility
- 9.2.2. Commercial and Industrial
- 9.2.3. Residential
- 9.1. Market Analysis, Insights and Forecast - by Type
- 10. South America Battery Energy Storage System Market Analysis, Insights and Forecast, 2020-2032
- 10.1. Market Analysis, Insights and Forecast - by Type
- 10.1.1. Lithium-ion Batteries
- 10.1.2. Lead-acid Batteries
- 10.1.3. Nickel Metal Hydride
- 10.1.4. Other Ty
- 10.2. Market Analysis, Insights and Forecast - by Application
- 10.2.1. Utility
- 10.2.2. Commercial and Industrial
- 10.2.3. Residential
- 10.1. Market Analysis, Insights and Forecast - by Type
- 11. Middle East and Africa Battery Energy Storage System Market Analysis, Insights and Forecast, 2020-2032
- 11.1. Market Analysis, Insights and Forecast - by Type
- 11.1.1. Lithium-ion Batteries
- 11.1.2. Lead-acid Batteries
- 11.1.3. Nickel Metal Hydride
- 11.1.4. Other Ty
- 11.2. Market Analysis, Insights and Forecast - by Application
- 11.2.1. Utility
- 11.2.2. Commercial and Industrial
- 11.2.3. Residential
- 11.1. Market Analysis, Insights and Forecast - by Type
- 12. Competitive Analysis
- 12.1. Company Profiles
- 12.1.1 Sony Corp
- 12.1.1.1. Company Overview
- 12.1.1.2. Products
- 12.1.1.3. Company Financials
- 12.1.1.4. SWOT Analysis
- 12.1.2 Contemporary Amperex Technology Co Limited
- 12.1.2.1. Company Overview
- 12.1.2.2. Products
- 12.1.2.3. Company Financials
- 12.1.2.4. SWOT Analysis
- 12.1.3 Varta AG
- 12.1.3.1. Company Overview
- 12.1.3.2. Products
- 12.1.3.3. Company Financials
- 12.1.3.4. SWOT Analysis
- 12.1.4 Samsung SDI Co Ltd
- 12.1.4.1. Company Overview
- 12.1.4.2. Products
- 12.1.4.3. Company Financials
- 12.1.4.4. SWOT Analysis
- 12.1.5 LG Energy Solution Ltd
- 12.1.5.1. Company Overview
- 12.1.5.2. Products
- 12.1.5.3. Company Financials
- 12.1.5.4. SWOT Analysis
- 12.1.6 Cellcube Energy Storage System Inc *List Not Exhaustive 6 4 Market Ranking Analysi
- 12.1.6.1. Company Overview
- 12.1.6.2. Products
- 12.1.6.3. Company Financials
- 12.1.6.4. SWOT Analysis
- 12.1.7 BYD Company Limited
- 12.1.7.1. Company Overview
- 12.1.7.2. Products
- 12.1.7.3. Company Financials
- 12.1.7.4. SWOT Analysis
- 12.1.8 Tesla Inc
- 12.1.8.1. Company Overview
- 12.1.8.2. Products
- 12.1.8.3. Company Financials
- 12.1.8.4. SWOT Analysis
- 12.1.9 Panasonic Corporation
- 12.1.9.1. Company Overview
- 12.1.9.2. Products
- 12.1.9.3. Company Financials
- 12.1.9.4. SWOT Analysis
- 12.1.1 Sony Corp
- 12.2. Market Entropy
- 12.2.1 Company's Key Areas Served
- 12.2.2 Recent Developments
- 12.3. Company Market Share Analysis 2025
- 12.3.1 Top 5 Companies Market Share Analysis
- 12.3.2 Top 3 Companies Market Share Analysis
- 12.4. List of Potential Customers
- 13. Research Methodology
List of Figures
- Figure 1: Global Battery Energy Storage System Market Revenue Breakdown (Million, %) by Region 2025 & 2033
- Figure 2: Global Battery Energy Storage System Market Volume Breakdown (K Units, %) by Region 2025 & 2033
- Figure 3: North America Battery Energy Storage System Market Revenue (Million), by Type 2025 & 2033
- Figure 4: North America Battery Energy Storage System Market Volume (K Units), by Type 2025 & 2033
- Figure 5: North America Battery Energy Storage System Market Revenue Share (%), by Type 2025 & 2033
- Figure 6: North America Battery Energy Storage System Market Volume Share (%), by Type 2025 & 2033
- Figure 7: North America Battery Energy Storage System Market Revenue (Million), by Application 2025 & 2033
- Figure 8: North America Battery Energy Storage System Market Volume (K Units), by Application 2025 & 2033
- Figure 9: North America Battery Energy Storage System Market Revenue Share (%), by Application 2025 & 2033
- Figure 10: North America Battery Energy Storage System Market Volume Share (%), by Application 2025 & 2033
- Figure 11: North America Battery Energy Storage System Market Revenue (Million), by Country 2025 & 2033
- Figure 12: North America Battery Energy Storage System Market Volume (K Units), by Country 2025 & 2033
- Figure 13: North America Battery Energy Storage System Market Revenue Share (%), by Country 2025 & 2033
- Figure 14: North America Battery Energy Storage System Market Volume Share (%), by Country 2025 & 2033
- Figure 15: Europe Battery Energy Storage System Market Revenue (Million), by Type 2025 & 2033
- Figure 16: Europe Battery Energy Storage System Market Volume (K Units), by Type 2025 & 2033
- Figure 17: Europe Battery Energy Storage System Market Revenue Share (%), by Type 2025 & 2033
- Figure 18: Europe Battery Energy Storage System Market Volume Share (%), by Type 2025 & 2033
- Figure 19: Europe Battery Energy Storage System Market Revenue (Million), by Application 2025 & 2033
- Figure 20: Europe Battery Energy Storage System Market Volume (K Units), by Application 2025 & 2033
- Figure 21: Europe Battery Energy Storage System Market Revenue Share (%), by Application 2025 & 2033
- Figure 22: Europe Battery Energy Storage System Market Volume Share (%), by Application 2025 & 2033
- Figure 23: Europe Battery Energy Storage System Market Revenue (Million), by Country 2025 & 2033
- Figure 24: Europe Battery Energy Storage System Market Volume (K Units), by Country 2025 & 2033
- Figure 25: Europe Battery Energy Storage System Market Revenue Share (%), by Country 2025 & 2033
- Figure 26: Europe Battery Energy Storage System Market Volume Share (%), by Country 2025 & 2033
- Figure 27: Asia Pacific Battery Energy Storage System Market Revenue (Million), by Type 2025 & 2033
- Figure 28: Asia Pacific Battery Energy Storage System Market Volume (K Units), by Type 2025 & 2033
- Figure 29: Asia Pacific Battery Energy Storage System Market Revenue Share (%), by Type 2025 & 2033
- Figure 30: Asia Pacific Battery Energy Storage System Market Volume Share (%), by Type 2025 & 2033
- Figure 31: Asia Pacific Battery Energy Storage System Market Revenue (Million), by Application 2025 & 2033
- Figure 32: Asia Pacific Battery Energy Storage System Market Volume (K Units), by Application 2025 & 2033
- Figure 33: Asia Pacific Battery Energy Storage System Market Revenue Share (%), by Application 2025 & 2033
- Figure 34: Asia Pacific Battery Energy Storage System Market Volume Share (%), by Application 2025 & 2033
- Figure 35: Asia Pacific Battery Energy Storage System Market Revenue (Million), by Country 2025 & 2033
- Figure 36: Asia Pacific Battery Energy Storage System Market Volume (K Units), by Country 2025 & 2033
- Figure 37: Asia Pacific Battery Energy Storage System Market Revenue Share (%), by Country 2025 & 2033
- Figure 38: Asia Pacific Battery Energy Storage System Market Volume Share (%), by Country 2025 & 2033
- Figure 39: South America Battery Energy Storage System Market Revenue (Million), by Type 2025 & 2033
- Figure 40: South America Battery Energy Storage System Market Volume (K Units), by Type 2025 & 2033
- Figure 41: South America Battery Energy Storage System Market Revenue Share (%), by Type 2025 & 2033
- Figure 42: South America Battery Energy Storage System Market Volume Share (%), by Type 2025 & 2033
- Figure 43: South America Battery Energy Storage System Market Revenue (Million), by Application 2025 & 2033
- Figure 44: South America Battery Energy Storage System Market Volume (K Units), by Application 2025 & 2033
- Figure 45: South America Battery Energy Storage System Market Revenue Share (%), by Application 2025 & 2033
- Figure 46: South America Battery Energy Storage System Market Volume Share (%), by Application 2025 & 2033
- Figure 47: South America Battery Energy Storage System Market Revenue (Million), by Country 2025 & 2033
- Figure 48: South America Battery Energy Storage System Market Volume (K Units), by Country 2025 & 2033
- Figure 49: South America Battery Energy Storage System Market Revenue Share (%), by Country 2025 & 2033
- Figure 50: South America Battery Energy Storage System Market Volume Share (%), by Country 2025 & 2033
- Figure 51: Middle East and Africa Battery Energy Storage System Market Revenue (Million), by Type 2025 & 2033
- Figure 52: Middle East and Africa Battery Energy Storage System Market Volume (K Units), by Type 2025 & 2033
- Figure 53: Middle East and Africa Battery Energy Storage System Market Revenue Share (%), by Type 2025 & 2033
- Figure 54: Middle East and Africa Battery Energy Storage System Market Volume Share (%), by Type 2025 & 2033
- Figure 55: Middle East and Africa Battery Energy Storage System Market Revenue (Million), by Application 2025 & 2033
- Figure 56: Middle East and Africa Battery Energy Storage System Market Volume (K Units), by Application 2025 & 2033
- Figure 57: Middle East and Africa Battery Energy Storage System Market Revenue Share (%), by Application 2025 & 2033
- Figure 58: Middle East and Africa Battery Energy Storage System Market Volume Share (%), by Application 2025 & 2033
- Figure 59: Middle East and Africa Battery Energy Storage System Market Revenue (Million), by Country 2025 & 2033
- Figure 60: Middle East and Africa Battery Energy Storage System Market Volume (K Units), by Country 2025 & 2033
- Figure 61: Middle East and Africa Battery Energy Storage System Market Revenue Share (%), by Country 2025 & 2033
- Figure 62: Middle East and Africa Battery Energy Storage System Market Volume Share (%), by Country 2025 & 2033
List of Tables
- Table 1: Global Battery Energy Storage System Market Revenue Million Forecast, by Type 2020 & 2033
- Table 2: Global Battery Energy Storage System Market Volume K Units Forecast, by Type 2020 & 2033
- Table 3: Global Battery Energy Storage System Market Revenue Million Forecast, by Application 2020 & 2033
- Table 4: Global Battery Energy Storage System Market Volume K Units Forecast, by Application 2020 & 2033
- Table 5: Global Battery Energy Storage System Market Revenue Million Forecast, by Region 2020 & 2033
- Table 6: Global Battery Energy Storage System Market Volume K Units Forecast, by Region 2020 & 2033
- Table 7: Global Battery Energy Storage System Market Revenue Million Forecast, by Type 2020 & 2033
- Table 8: Global Battery Energy Storage System Market Volume K Units Forecast, by Type 2020 & 2033
- Table 9: Global Battery Energy Storage System Market Revenue Million Forecast, by Application 2020 & 2033
- Table 10: Global Battery Energy Storage System Market Volume K Units Forecast, by Application 2020 & 2033
- Table 11: Global Battery Energy Storage System Market Revenue Million Forecast, by Country 2020 & 2033
- Table 12: Global Battery Energy Storage System Market Volume K Units Forecast, by Country 2020 & 2033
- Table 13: United States Battery Energy Storage System Market Revenue (Million) Forecast, by Application 2020 & 2033
- Table 14: United States Battery Energy Storage System Market Volume (K Units) Forecast, by Application 2020 & 2033
- Table 15: Canada Battery Energy Storage System Market Revenue (Million) Forecast, by Application 2020 & 2033
- Table 16: Canada Battery Energy Storage System Market Volume (K Units) Forecast, by Application 2020 & 2033
- Table 17: Rest of North America Battery Energy Storage System Market Revenue (Million) Forecast, by Application 2020 & 2033
- Table 18: Rest of North America Battery Energy Storage System Market Volume (K Units) Forecast, by Application 2020 & 2033
- Table 19: Global Battery Energy Storage System Market Revenue Million Forecast, by Type 2020 & 2033
- Table 20: Global Battery Energy Storage System Market Volume K Units Forecast, by Type 2020 & 2033
- Table 21: Global Battery Energy Storage System Market Revenue Million Forecast, by Application 2020 & 2033
- Table 22: Global Battery Energy Storage System Market Volume K Units Forecast, by Application 2020 & 2033
- Table 23: Global Battery Energy Storage System Market Revenue Million Forecast, by Country 2020 & 2033
- Table 24: Global Battery Energy Storage System Market Volume K Units Forecast, by Country 2020 & 2033
- Table 25: Germany Battery Energy Storage System Market Revenue (Million) Forecast, by Application 2020 & 2033
- Table 26: Germany Battery Energy Storage System Market Volume (K Units) Forecast, by Application 2020 & 2033
- Table 27: France Battery Energy Storage System Market Revenue (Million) Forecast, by Application 2020 & 2033
- Table 28: France Battery Energy Storage System Market Volume (K Units) Forecast, by Application 2020 & 2033
- Table 29: United Kingdom Battery Energy Storage System Market Revenue (Million) Forecast, by Application 2020 & 2033
- Table 30: United Kingdom Battery Energy Storage System Market Volume (K Units) Forecast, by Application 2020 & 2033
- Table 31: Italy Battery Energy Storage System Market Revenue (Million) Forecast, by Application 2020 & 2033
- Table 32: Italy Battery Energy Storage System Market Volume (K Units) Forecast, by Application 2020 & 2033
- Table 33: Spain Battery Energy Storage System Market Revenue (Million) Forecast, by Application 2020 & 2033
- Table 34: Spain Battery Energy Storage System Market Volume (K Units) Forecast, by Application 2020 & 2033
- Table 35: Nordic Battery Energy Storage System Market Revenue (Million) Forecast, by Application 2020 & 2033
- Table 36: Nordic Battery Energy Storage System Market Volume (K Units) Forecast, by Application 2020 & 2033
- Table 37: Turkey Battery Energy Storage System Market Revenue (Million) Forecast, by Application 2020 & 2033
- Table 38: Turkey Battery Energy Storage System Market Volume (K Units) Forecast, by Application 2020 & 2033
- Table 39: Russia Battery Energy Storage System Market Revenue (Million) Forecast, by Application 2020 & 2033
- Table 40: Russia Battery Energy Storage System Market Volume (K Units) Forecast, by Application 2020 & 2033
- Table 41: Rest of Europe Battery Energy Storage System Market Revenue (Million) Forecast, by Application 2020 & 2033
- Table 42: Rest of Europe Battery Energy Storage System Market Volume (K Units) Forecast, by Application 2020 & 2033
- Table 43: Global Battery Energy Storage System Market Revenue Million Forecast, by Type 2020 & 2033
- Table 44: Global Battery Energy Storage System Market Volume K Units Forecast, by Type 2020 & 2033
- Table 45: Global Battery Energy Storage System Market Revenue Million Forecast, by Application 2020 & 2033
- Table 46: Global Battery Energy Storage System Market Volume K Units Forecast, by Application 2020 & 2033
- Table 47: Global Battery Energy Storage System Market Revenue Million Forecast, by Country 2020 & 2033
- Table 48: Global Battery Energy Storage System Market Volume K Units Forecast, by Country 2020 & 2033
- Table 49: China Battery Energy Storage System Market Revenue (Million) Forecast, by Application 2020 & 2033
- Table 50: China Battery Energy Storage System Market Volume (K Units) Forecast, by Application 2020 & 2033
- Table 51: India Battery Energy Storage System Market Revenue (Million) Forecast, by Application 2020 & 2033
- Table 52: India Battery Energy Storage System Market Volume (K Units) Forecast, by Application 2020 & 2033
- Table 53: Japan Battery Energy Storage System Market Revenue (Million) Forecast, by Application 2020 & 2033
- Table 54: Japan Battery Energy Storage System Market Volume (K Units) Forecast, by Application 2020 & 2033
- Table 55: Australia Battery Energy Storage System Market Revenue (Million) Forecast, by Application 2020 & 2033
- Table 56: Australia Battery Energy Storage System Market Volume (K Units) Forecast, by Application 2020 & 2033
- Table 57: Malaysia Battery Energy Storage System Market Revenue (Million) Forecast, by Application 2020 & 2033
- Table 58: Malaysia Battery Energy Storage System Market Volume (K Units) Forecast, by Application 2020 & 2033
- Table 59: Thailand Battery Energy Storage System Market Revenue (Million) Forecast, by Application 2020 & 2033
- Table 60: Thailand Battery Energy Storage System Market Volume (K Units) Forecast, by Application 2020 & 2033
- Table 61: Indonesia Battery Energy Storage System Market Revenue (Million) Forecast, by Application 2020 & 2033
- Table 62: Indonesia Battery Energy Storage System Market Volume (K Units) Forecast, by Application 2020 & 2033
- Table 63: Vietnam Battery Energy Storage System Market Revenue (Million) Forecast, by Application 2020 & 2033
- Table 64: Vietnam Battery Energy Storage System Market Volume (K Units) Forecast, by Application 2020 & 2033
- Table 65: Rest of Asia pacific Battery Energy Storage System Market Revenue (Million) Forecast, by Application 2020 & 2033
- Table 66: Rest of Asia pacific Battery Energy Storage System Market Volume (K Units) Forecast, by Application 2020 & 2033
- Table 67: Global Battery Energy Storage System Market Revenue Million Forecast, by Type 2020 & 2033
- Table 68: Global Battery Energy Storage System Market Volume K Units Forecast, by Type 2020 & 2033
- Table 69: Global Battery Energy Storage System Market Revenue Million Forecast, by Application 2020 & 2033
- Table 70: Global Battery Energy Storage System Market Volume K Units Forecast, by Application 2020 & 2033
- Table 71: Global Battery Energy Storage System Market Revenue Million Forecast, by Country 2020 & 2033
- Table 72: Global Battery Energy Storage System Market Volume K Units Forecast, by Country 2020 & 2033
- Table 73: Brazil Battery Energy Storage System Market Revenue (Million) Forecast, by Application 2020 & 2033
- Table 74: Brazil Battery Energy Storage System Market Volume (K Units) Forecast, by Application 2020 & 2033
- Table 75: Argentina Battery Energy Storage System Market Revenue (Million) Forecast, by Application 2020 & 2033
- Table 76: Argentina Battery Energy Storage System Market Volume (K Units) Forecast, by Application 2020 & 2033
- Table 77: Chile Battery Energy Storage System Market Revenue (Million) Forecast, by Application 2020 & 2033
- Table 78: Chile Battery Energy Storage System Market Volume (K Units) Forecast, by Application 2020 & 2033
- Table 79: Colombia Battery Energy Storage System Market Revenue (Million) Forecast, by Application 2020 & 2033
- Table 80: Colombia Battery Energy Storage System Market Volume (K Units) Forecast, by Application 2020 & 2033
- Table 81: Rest of South America Battery Energy Storage System Market Revenue (Million) Forecast, by Application 2020 & 2033
- Table 82: Rest of South America Battery Energy Storage System Market Volume (K Units) Forecast, by Application 2020 & 2033
- Table 83: Global Battery Energy Storage System Market Revenue Million Forecast, by Type 2020 & 2033
- Table 84: Global Battery Energy Storage System Market Volume K Units Forecast, by Type 2020 & 2033
- Table 85: Global Battery Energy Storage System Market Revenue Million Forecast, by Application 2020 & 2033
- Table 86: Global Battery Energy Storage System Market Volume K Units Forecast, by Application 2020 & 2033
- Table 87: Global Battery Energy Storage System Market Revenue Million Forecast, by Country 2020 & 2033
- Table 88: Global Battery Energy Storage System Market Volume K Units Forecast, by Country 2020 & 2033
- Table 89: Saudi Arabia Battery Energy Storage System Market Revenue (Million) Forecast, by Application 2020 & 2033
- Table 90: Saudi Arabia Battery Energy Storage System Market Volume (K Units) Forecast, by Application 2020 & 2033
- Table 91: United Arab Emirates Battery Energy Storage System Market Revenue (Million) Forecast, by Application 2020 & 2033
- Table 92: United Arab Emirates Battery Energy Storage System Market Volume (K Units) Forecast, by Application 2020 & 2033
- Table 93: South Africa Battery Energy Storage System Market Revenue (Million) Forecast, by Application 2020 & 2033
- Table 94: South Africa Battery Energy Storage System Market Volume (K Units) Forecast, by Application 2020 & 2033
- Table 95: Qatar Battery Energy Storage System Market Revenue (Million) Forecast, by Application 2020 & 2033
- Table 96: Qatar Battery Energy Storage System Market Volume (K Units) Forecast, by Application 2020 & 2033
- Table 97: Nigeria Battery Energy Storage System Market Revenue (Million) Forecast, by Application 2020 & 2033
- Table 98: Nigeria Battery Energy Storage System Market Volume (K Units) Forecast, by Application 2020 & 2033
- Table 99: Egypt Battery Energy Storage System Market Revenue (Million) Forecast, by Application 2020 & 2033
- Table 100: Egypt Battery Energy Storage System Market Volume (K Units) Forecast, by Application 2020 & 2033
- Table 101: Rest of Middle East Battery Energy Storage System Market Revenue (Million) Forecast, by Application 2020 & 2033
- Table 102: Rest of Middle East Battery Energy Storage System Market Volume (K Units) Forecast, by Application 2020 & 2033
Frequently Asked Questions
1. What is the projected Compound Annual Growth Rate (CAGR) of the Battery Energy Storage System Market?
The projected CAGR is approximately 8.72%.
2. Which companies are prominent players in the Battery Energy Storage System Market?
Key companies in the market include Sony Corp, Contemporary Amperex Technology Co Limited, Varta AG, Samsung SDI Co Ltd, LG Energy Solution Ltd, Cellcube Energy Storage System Inc *List Not Exhaustive 6 4 Market Ranking Analysi, BYD Company Limited, Tesla Inc, Panasonic Corporation.
3. What are the main segments of the Battery Energy Storage System Market?
The market segments include Type, Application.
4. Can you provide details about the market size?
The market size is estimated to be USD 34.22 Million as of 2022.
5. What are some drivers contributing to market growth?
4.; Increased Demand of Renewable Energy4.; Reducing Prices of Lithium-ion Batteries.
6. What are the notable trends driving market growth?
Residential Expected to be the Fastest-growing Segment.
7. Are there any restraints impacting market growth?
4.; Reduction in Supply of Raw Materials.
8. Can you provide examples of recent developments in the market?
February 2024: Chhattisgarh successfully inaugurated one of the biggest solar facilities in India with a battery energy storage system located in the Rajnandgaon district. The solar power plant, established by the Solar Corporation of India (SECI) and Chhattisgarh Power Distribution Company, provides a capacity of 100 MW, ensures electricity even during the night, and generates more than five lakh units daily.
9. What pricing options are available for accessing the report?
Pricing options include single-user, multi-user, and enterprise licenses priced at USD 4750, USD 5250, and USD 8750 respectively.
10. Is the market size provided in terms of value or volume?
The market size is provided in terms of value, measured in Million and volume, measured in K Units.
11. Are there any specific market keywords associated with the report?
Yes, the market keyword associated with the report is "Battery Energy Storage System Market," which aids in identifying and referencing the specific market segment covered.
12. How do I determine which pricing option suits my needs best?
The pricing options vary based on user requirements and access needs. Individual users may opt for single-user licenses, while businesses requiring broader access may choose multi-user or enterprise licenses for cost-effective access to the report.
13. Are there any additional resources or data provided in the Battery Energy Storage System Market report?
While the report offers comprehensive insights, it's advisable to review the specific contents or supplementary materials provided to ascertain if additional resources or data are available.
14. How can I stay updated on further developments or reports in the Battery Energy Storage System Market?
To stay informed about further developments, trends, and reports in the Battery Energy Storage System Market, consider subscribing to industry newsletters, following relevant companies and organizations, or regularly checking reputable industry news sources and publications.
Methodology
Step 1 - Identification of Relevant Samples Size from Population Database


Step 2 - Approaches for Defining Global Market Size (Value, Volume* & Price*)

Note*: In applicable scenarios
Step 3 - Data Sources
Primary Research
- Web Analytics
- Survey Reports
- Research Institute
- Latest Research Reports
- Opinion Leaders
Secondary Research
- Annual Reports
- White Paper
- Latest Press Release
- Industry Association
- Paid Database
- Investor Presentations

Step 4 - Data Triangulation
Involves using different sources of information in order to increase the validity of a study
These sources are likely to be stakeholders in a program - participants, other researchers, program staff, other community members, and so on.
Then we put all data in single framework & apply various statistical tools to find out the dynamic on the market.
During the analysis stage, feedback from the stakeholder groups would be compared to determine areas of agreement as well as areas of divergence