

Key Insights
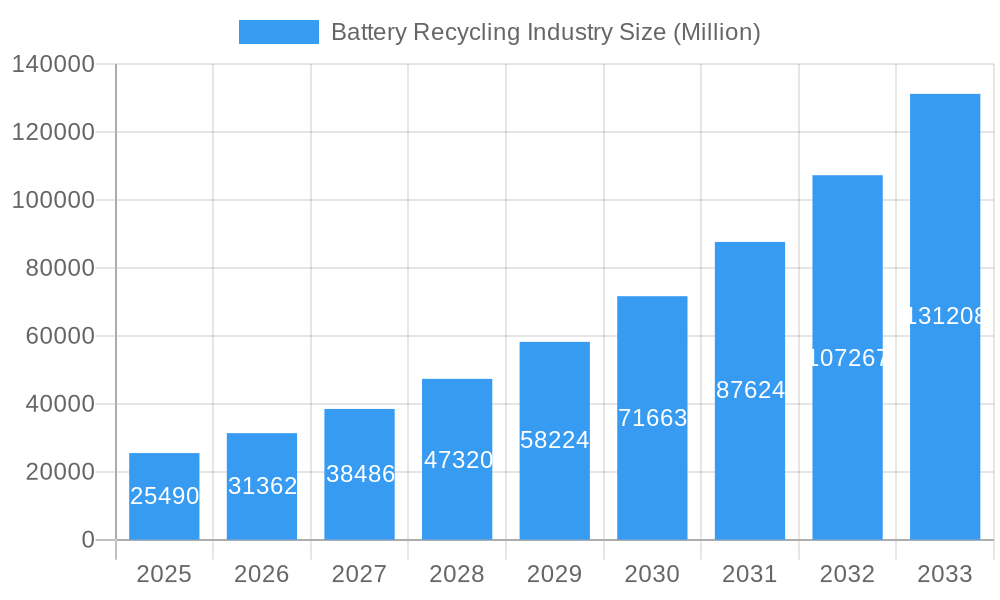
The global battery recycling market is experiencing robust growth, projected to reach \$25.49 billion in 2025 and exhibiting a remarkable Compound Annual Growth Rate (CAGR) of 22.80%. This expansion is fueled by several key factors. Stringent environmental regulations aimed at reducing electronic waste and the increasing scarcity of critical raw materials, such as lithium and cobalt, are driving the demand for efficient and sustainable battery recycling solutions. The rise of electric vehicles (EVs) and the burgeoning energy storage sector further contribute to the market's growth trajectory, as the lifecycle management of these batteries becomes increasingly crucial. Technological advancements in battery recycling processes, leading to higher recovery rates and improved economic viability, are also significant contributors. The market is segmented by battery type, with lithium-ion batteries commanding a significant share due to their prevalence in EVs and portable electronics. Leading players like Aqua Metals Inc, Neometals Ltd, and Eco-Bat Technologies are actively shaping the market landscape through innovation and strategic partnerships. Geographic growth is expected to be widespread, with North America, Europe, and Asia-Pacific representing major markets, driven by varying levels of EV adoption, regulatory frameworks, and technological development.
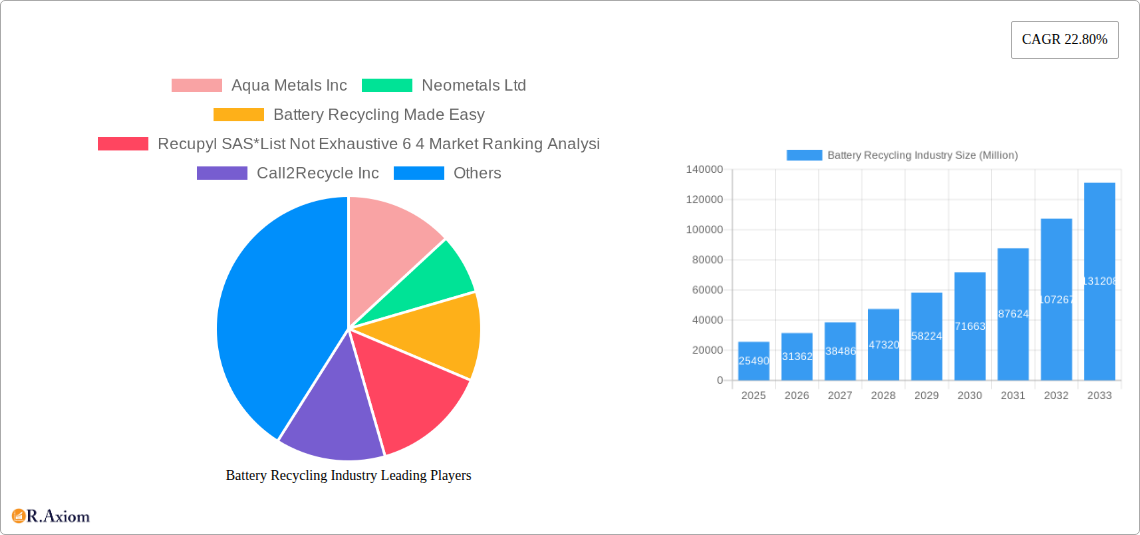
Battery Recycling Industry Market Size (In Billion)
Looking ahead to 2033, the market is poised for continued expansion, driven by the sustained growth of the EV and renewable energy sectors. However, challenges remain, including the complexities associated with recycling various battery chemistries, the need for standardized recycling processes, and the development of cost-effective technologies for processing different battery components. The industry will need to address these challenges to fully realize its potential and meet the growing demand for sustainable battery management. The ongoing research and development efforts aimed at improving recycling technologies and reducing processing costs will be critical in shaping the future trajectory of the battery recycling market. Furthermore, increased collaboration between governments, industry players, and research institutions will play a vital role in the development of efficient and environmentally responsible battery recycling infrastructure.
Battery Recycling Industry Company Market Share
Battery Recycling Industry: A Comprehensive Market Report (2019-2033)
This in-depth report provides a comprehensive analysis of the global battery recycling industry, covering market size, growth drivers, challenges, key players, and future outlook. The study period spans from 2019 to 2033, with 2025 serving as both the base and estimated year. The report leverages data from the historical period (2019-2024) to forecast market trends from 2025 to 2033, offering invaluable insights for industry stakeholders. The report values are expressed in Millions.
Battery Recycling Industry Market Concentration & Innovation
The battery recycling market exhibits a moderately concentrated landscape, with a few major players holding significant market share. However, the emergence of numerous startups and the increasing focus on sustainability are driving innovation and competition. Market share data for 2024 suggests that the top 5 players collectively hold approximately xx% of the market, while the remaining xx% is distributed among numerous smaller players. This fragmented landscape presents both opportunities and challenges.
Several factors influence market concentration:
- Technological advancements: Continuous innovations in battery recycling technologies are lowering costs and improving efficiency, attracting new entrants.
- Stringent regulations: Growing environmental regulations globally are pushing manufacturers and consumers towards responsible battery disposal, fostering market growth but also creating barriers to entry for smaller players without the resources to comply.
- Mergers and Acquisitions (M&A): M&A activity in the sector has been significant, with deal values exceeding xx Million in the last 5 years. These consolidations often result in increased market concentration among large players. Examples include [insert specific M&A deals with values if available, otherwise state “xx Million in undisclosed deals”].
- Product substitutes: While there are currently limited direct substitutes for battery recycling, advancements in battery design and material science could potentially alter the market landscape.
- End-user trends: The rising demand for electric vehicles (EVs) and energy storage solutions is a primary driver of market growth, leading to an increase in the volume of spent batteries requiring recycling.
Battery Recycling Industry Industry Trends & Insights
The global battery recycling market is experiencing robust growth, driven by several key factors. The Compound Annual Growth Rate (CAGR) is projected to be xx% during the forecast period (2025-2033), reaching a market value of xx Million by 2033. This growth is fueled by:
- Increased EV adoption: The surging popularity of electric vehicles is significantly increasing the volume of spent batteries needing recycling.
- Stringent environmental regulations: Governments worldwide are implementing stricter regulations on battery waste disposal, incentivizing recycling and creating a more regulated market.
- Technological advancements: Innovations in battery recycling technologies are improving efficiency and cost-effectiveness, boosting market expansion. Improved methods of material recovery are leading to higher market penetration for recycled materials.
- Growing awareness of circular economy principles: The increasing focus on sustainability and resource efficiency among consumers and businesses is driving demand for recycled battery materials.
- Price volatility of raw materials: Fluctuations in the prices of critical raw materials used in battery manufacturing make recycled materials a more attractive and cost-effective alternative.
- Competitive landscape: The intensifying competition among companies is driving innovation and efficiency improvements, benefiting consumers and fostering market growth.
Dominant Markets & Segments in Battery Recycling Industry
The lithium-ion battery segment dominates the battery recycling market, owing to the exponential growth of electric vehicles and portable electronics. This segment is projected to account for xx% of the total market by 2033.
- Key Drivers for Lithium-ion Battery Recycling Dominance:
- Rapid growth of the EV industry.
- High value of recovered materials (lithium, cobalt, nickel).
- Increasing government support and incentives for recycling.
While other battery types, like lead-acid and nickel-cadmium batteries, also contribute significantly, their market share is relatively smaller compared to lithium-ion. The geographical dominance is shifting towards regions with strong EV adoption and supportive policies, with [insert dominant region/country here] currently leading the market.
- Key Drivers for Regional Dominance:
- Robust governmental support and financial incentives for the battery recycling sector.
- Strong and well-established infrastructure for waste collection and recycling.
- High concentration of manufacturing and automotive industries.
Battery Recycling Industry Product Developments
Recent advancements focus on closed-loop recycling systems, aiming to recover valuable materials with maximum efficiency and minimal environmental impact. This includes hydrometallurgical processes for lithium-ion batteries, allowing for the recovery of critical metals with high purity. New technologies are also emerging to address the challenges of recycling various cathode chemistries. The market is seeing an increased focus on automation, enabling higher throughput and reducing labor costs.
Report Scope & Segmentation Analysis
This report segments the battery recycling market based on battery type:
- Lead-Acid Battery: This segment is mature but still significant, driven by the continued use of lead-acid batteries in automotive and stationary applications. Market size in 2025 is estimated at xx Million, with projected growth of xx% during the forecast period.
- Nickel Battery: The nickel battery segment shows moderate growth, largely due to its use in hybrid and electric vehicles. Market size in 2025 is estimated at xx Million, with projected growth of xx% during the forecast period.
- Lithium-ion Battery: The fastest-growing segment, driven by the explosive growth of EVs and consumer electronics. Market size in 2025 is estimated at xx Million, with projected growth of xx% during the forecast period.
- Other Battery Types: This includes various emerging battery chemistries, with market size in 2025 estimated at xx Million, and projected growth of xx% during the forecast period.
Key Drivers of Battery Recycling Industry Growth
Several factors contribute to the growth of the battery recycling industry:
- Government regulations and incentives: Policies promoting sustainable waste management and the circular economy are key drivers.
- Technological advancements: Innovations in recycling technologies are increasing efficiency and reducing costs.
- Economic factors: The rising cost of raw materials makes recycled materials economically attractive.
- Environmental concerns: Growing awareness of the environmental impact of battery waste drives demand for recycling.
Challenges in the Battery Recycling Industry Sector
The battery recycling industry faces several challenges:
- Regulatory hurdles: Inconsistent regulations across different regions create complexities.
- Supply chain issues: Securing consistent supplies of spent batteries can be challenging.
- Technological limitations: Recycling certain battery chemistries is technologically difficult and expensive.
- Economic viability: Recycling some battery types may not be economically viable without government support.
Emerging Opportunities in Battery Recycling Industry
Significant opportunities exist:
- New battery chemistries: Recycling of emerging battery types presents a huge untapped market.
- Urban mining: Recovery of valuable materials from end-of-life electronics is an expanding opportunity.
- Technological innovation: Developing advanced recycling technologies can improve efficiency and profitability.
Leading Players in the Battery Recycling Industry Market
- Aqua Metals Inc
- Neometals Ltd
- Battery Recycling Made Easy
- Recupyl SAS
- Call2Recycle Inc
- Eco-Bat Technologies Ltd
- Battery Solutions Inc
- Raw Materials Company
- Exide Technologies
- Accurec Recycling GmbH
Key Developments in Battery Recycling Industry Industry
- December 2023: Toyota and Criba Solution partnered to expand their battery recycling network, aiming for 70% reduction in transportation costs and 95% mineral recovery.
- December 2023: LOHUM Cleantech opened an EV battery recycling plant in the UAE, supporting the nation's sustainability goals.
- October 2023: ACE Green Recycling partnered with NREL to improve its lithium-ion battery recycling technology.
Strategic Outlook for Battery Recycling Industry Market
The battery recycling market is poised for significant growth, driven by increasing EV adoption, stricter environmental regulations, and technological advancements. The focus on circular economy principles and the rising cost of raw materials will further fuel market expansion. Companies that invest in innovative technologies and strategic partnerships will be well-positioned to capitalize on the vast opportunities in this growing sector.
Battery Recycling Industry Segmentation
-
1. Battery Type
- 1.1. Lead-Acid Battery
- 1.2. Nickel Battery
- 1.3. Lithium-ion battery
- 1.4. Other Battery Types
Battery Recycling Industry Segmentation By Geography
-
1. North America
- 1.1. United States
- 1.2. Canada
- 1.3. Rest of North America
-
2. Europe
- 2.1. Germany
- 2.2. France
- 2.3. United Kingdom
- 2.4. Italy
- 2.5. Spain
- 2.6. NORDIC
- 2.7. Turkey
- 2.8. Russia
- 2.9. Rest of Europe
-
3. Asia Pacific
- 3.1. China
- 3.2. India
- 3.3. Japan
- 3.4. Australia
- 3.5. Malaysia
- 3.6. Thailand
- 3.7. Indonesia
- 3.8. Vietnam
- 3.9. Rest of Asia Pacific
-
4. South America
- 4.1. Brazil
- 4.2. Argentina
- 4.3. Chile
- 4.4. Colombia
- 4.5. Rest of South America
-
5. Middle East and Africa
- 5.1. Saudi Arabia
- 5.2. United Arab Emirates
- 5.3. South Africa
- 5.4. Qatar
- 5.5. Egypt
- 5.6. Nigeria
- 5.7. Rest of Middle East and Africa
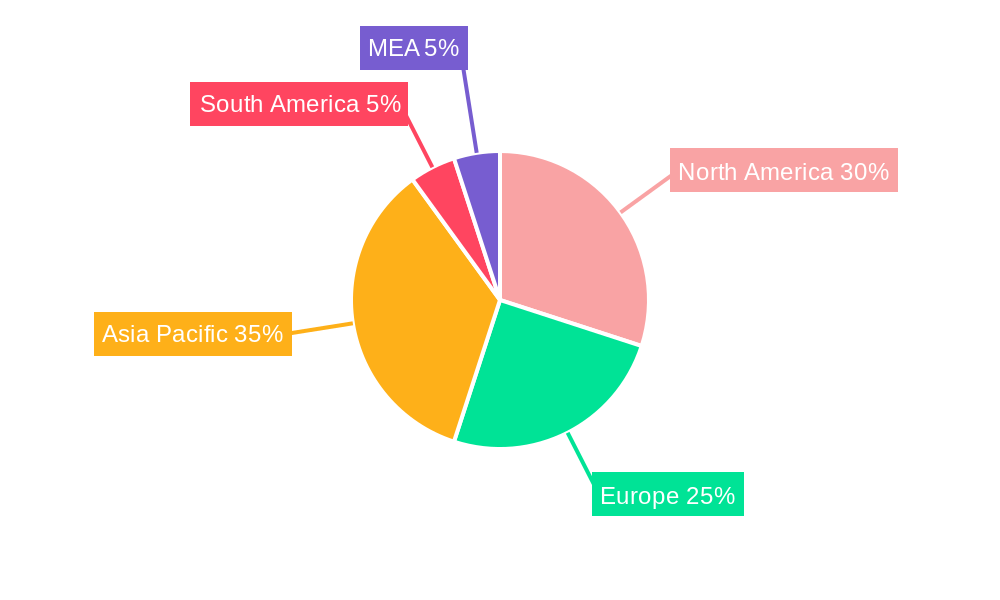
Battery Recycling Industry Regional Market Share
Geographic Coverage of Battery Recycling Industry
Battery Recycling Industry REPORT HIGHLIGHTS
| Aspects | Details |
|---|---|
| Study Period | 2020-2034 |
| Base Year | 2025 |
| Estimated Year | 2026 |
| Forecast Period | 2026-2034 |
| Historical Period | 2020-2025 |
| Growth Rate | CAGR of 22.80% from 2020-2034 |
| Segmentation |
|
Table of Contents
- 1. Introduction
- 1.1. Research Scope
- 1.2. Market Segmentation
- 1.3. Research Objective
- 1.4. Definitions and Assumptions
- 2. Executive Summary
- 2.1. Market Snapshot
- 3. Market Dynamics
- 3.1. Market Drivers
- 3.2. Market Restrains
- 3.3. Market Trends
- 3.4. Market Opportunities
- 4. Market Factor Analysis
- 4.1. Porters Five Forces
- 4.1.1. Bargaining Power of Suppliers
- 4.1.2. Bargaining Power of Buyers
- 4.1.3. Threat of New Entrants
- 4.1.4. Threat of Substitutes
- 4.1.5. Competitive Rivalry
- 4.2. PESTEL analysis
- 4.3. BCG Analysis
- 4.3.1. Stars (High Growth, High Market Share)
- 4.3.2. Cash Cows (Low Growth, High Market Share)
- 4.3.3. Question Mark (High Growth, Low Market Share)
- 4.3.4. Dogs (Low Growth, Low Market Share)
- 4.4. Ansoff Matrix Analysis
- 4.5. Supply Chain Analysis
- 4.6. Regulatory Landscape
- 4.7. Current Market Potential and Opportunity Assessment (TAM–SAM–SOM Framework)
- 4.8. RAX Analyst Note
- 4.1. Porters Five Forces
- 5. Market Analysis, Insights and Forecast 2021-2033
- 5.1. Market Analysis, Insights and Forecast - by Battery Type
- 5.1.1. Lead-Acid Battery
- 5.1.2. Nickel Battery
- 5.1.3. Lithium-ion battery
- 5.1.4. Other Battery Types
- 5.2. Market Analysis, Insights and Forecast - by Region
- 5.2.1. North America
- 5.2.2. Europe
- 5.2.3. Asia Pacific
- 5.2.4. South America
- 5.2.5. Middle East and Africa
- 5.1. Market Analysis, Insights and Forecast - by Battery Type
- 6. Global Battery Recycling Industry Analysis, Insights and Forecast, 2021-2033
- 6.1. Market Analysis, Insights and Forecast - by Battery Type
- 6.1.1. Lead-Acid Battery
- 6.1.2. Nickel Battery
- 6.1.3. Lithium-ion battery
- 6.1.4. Other Battery Types
- 6.1. Market Analysis, Insights and Forecast - by Battery Type
- 7. North America Battery Recycling Industry Analysis, Insights and Forecast, 2020-2032
- 7.1. Market Analysis, Insights and Forecast - by Battery Type
- 7.1.1. Lead-Acid Battery
- 7.1.2. Nickel Battery
- 7.1.3. Lithium-ion battery
- 7.1.4. Other Battery Types
- 7.1. Market Analysis, Insights and Forecast - by Battery Type
- 8. Europe Battery Recycling Industry Analysis, Insights and Forecast, 2020-2032
- 8.1. Market Analysis, Insights and Forecast - by Battery Type
- 8.1.1. Lead-Acid Battery
- 8.1.2. Nickel Battery
- 8.1.3. Lithium-ion battery
- 8.1.4. Other Battery Types
- 8.1. Market Analysis, Insights and Forecast - by Battery Type
- 9. Asia Pacific Battery Recycling Industry Analysis, Insights and Forecast, 2020-2032
- 9.1. Market Analysis, Insights and Forecast - by Battery Type
- 9.1.1. Lead-Acid Battery
- 9.1.2. Nickel Battery
- 9.1.3. Lithium-ion battery
- 9.1.4. Other Battery Types
- 9.1. Market Analysis, Insights and Forecast - by Battery Type
- 10. South America Battery Recycling Industry Analysis, Insights and Forecast, 2020-2032
- 10.1. Market Analysis, Insights and Forecast - by Battery Type
- 10.1.1. Lead-Acid Battery
- 10.1.2. Nickel Battery
- 10.1.3. Lithium-ion battery
- 10.1.4. Other Battery Types
- 10.1. Market Analysis, Insights and Forecast - by Battery Type
- 11. Middle East and Africa Battery Recycling Industry Analysis, Insights and Forecast, 2020-2032
- 11.1. Market Analysis, Insights and Forecast - by Battery Type
- 11.1.1. Lead-Acid Battery
- 11.1.2. Nickel Battery
- 11.1.3. Lithium-ion battery
- 11.1.4. Other Battery Types
- 11.1. Market Analysis, Insights and Forecast - by Battery Type
- 12. Competitive Analysis
- 12.1. Company Profiles
- 12.1.1 Aqua Metals Inc
- 12.1.1.1. Company Overview
- 12.1.1.2. Products
- 12.1.1.3. Company Financials
- 12.1.1.4. SWOT Analysis
- 12.1.2 Neometals Ltd
- 12.1.2.1. Company Overview
- 12.1.2.2. Products
- 12.1.2.3. Company Financials
- 12.1.2.4. SWOT Analysis
- 12.1.3 Battery Recycling Made Easy
- 12.1.3.1. Company Overview
- 12.1.3.2. Products
- 12.1.3.3. Company Financials
- 12.1.3.4. SWOT Analysis
- 12.1.4 Recupyl SAS*List Not Exhaustive 6 4 Market Ranking Analysi
- 12.1.4.1. Company Overview
- 12.1.4.2. Products
- 12.1.4.3. Company Financials
- 12.1.4.4. SWOT Analysis
- 12.1.5 Call2Recycle Inc
- 12.1.5.1. Company Overview
- 12.1.5.2. Products
- 12.1.5.3. Company Financials
- 12.1.5.4. SWOT Analysis
- 12.1.6 Eco-Bat Technologies Ltd
- 12.1.6.1. Company Overview
- 12.1.6.2. Products
- 12.1.6.3. Company Financials
- 12.1.6.4. SWOT Analysis
- 12.1.7 Battery Solutions Inc
- 12.1.7.1. Company Overview
- 12.1.7.2. Products
- 12.1.7.3. Company Financials
- 12.1.7.4. SWOT Analysis
- 12.1.8 Raw Materials Company
- 12.1.8.1. Company Overview
- 12.1.8.2. Products
- 12.1.8.3. Company Financials
- 12.1.8.4. SWOT Analysis
- 12.1.9 Exide Technologies
- 12.1.9.1. Company Overview
- 12.1.9.2. Products
- 12.1.9.3. Company Financials
- 12.1.9.4. SWOT Analysis
- 12.1.10 Accurec Recycling GmbH
- 12.1.10.1. Company Overview
- 12.1.10.2. Products
- 12.1.10.3. Company Financials
- 12.1.10.4. SWOT Analysis
- 12.1.1 Aqua Metals Inc
- 12.2. Market Entropy
- 12.2.1 Company's Key Areas Served
- 12.2.2 Recent Developments
- 12.3. Company Market Share Analysis 2025
- 12.3.1 Top 5 Companies Market Share Analysis
- 12.3.2 Top 3 Companies Market Share Analysis
- 12.4. List of Potential Customers
- 13. Research Methodology
List of Figures
- Figure 1: Global Battery Recycling Industry Revenue Breakdown (Million, %) by Region 2025 & 2033
- Figure 2: North America Battery Recycling Industry Revenue (Million), by Battery Type 2025 & 2033
- Figure 3: North America Battery Recycling Industry Revenue Share (%), by Battery Type 2025 & 2033
- Figure 4: North America Battery Recycling Industry Revenue (Million), by Country 2025 & 2033
- Figure 5: North America Battery Recycling Industry Revenue Share (%), by Country 2025 & 2033
- Figure 6: Europe Battery Recycling Industry Revenue (Million), by Battery Type 2025 & 2033
- Figure 7: Europe Battery Recycling Industry Revenue Share (%), by Battery Type 2025 & 2033
- Figure 8: Europe Battery Recycling Industry Revenue (Million), by Country 2025 & 2033
- Figure 9: Europe Battery Recycling Industry Revenue Share (%), by Country 2025 & 2033
- Figure 10: Asia Pacific Battery Recycling Industry Revenue (Million), by Battery Type 2025 & 2033
- Figure 11: Asia Pacific Battery Recycling Industry Revenue Share (%), by Battery Type 2025 & 2033
- Figure 12: Asia Pacific Battery Recycling Industry Revenue (Million), by Country 2025 & 2033
- Figure 13: Asia Pacific Battery Recycling Industry Revenue Share (%), by Country 2025 & 2033
- Figure 14: South America Battery Recycling Industry Revenue (Million), by Battery Type 2025 & 2033
- Figure 15: South America Battery Recycling Industry Revenue Share (%), by Battery Type 2025 & 2033
- Figure 16: South America Battery Recycling Industry Revenue (Million), by Country 2025 & 2033
- Figure 17: South America Battery Recycling Industry Revenue Share (%), by Country 2025 & 2033
- Figure 18: Middle East and Africa Battery Recycling Industry Revenue (Million), by Battery Type 2025 & 2033
- Figure 19: Middle East and Africa Battery Recycling Industry Revenue Share (%), by Battery Type 2025 & 2033
- Figure 20: Middle East and Africa Battery Recycling Industry Revenue (Million), by Country 2025 & 2033
- Figure 21: Middle East and Africa Battery Recycling Industry Revenue Share (%), by Country 2025 & 2033
List of Tables
- Table 1: Global Battery Recycling Industry Revenue Million Forecast, by Battery Type 2020 & 2033
- Table 2: Global Battery Recycling Industry Revenue Million Forecast, by Region 2020 & 2033
- Table 3: Global Battery Recycling Industry Revenue Million Forecast, by Battery Type 2020 & 2033
- Table 4: Global Battery Recycling Industry Revenue Million Forecast, by Country 2020 & 2033
- Table 5: United States Battery Recycling Industry Revenue (Million) Forecast, by Application 2020 & 2033
- Table 6: Canada Battery Recycling Industry Revenue (Million) Forecast, by Application 2020 & 2033
- Table 7: Rest of North America Battery Recycling Industry Revenue (Million) Forecast, by Application 2020 & 2033
- Table 8: Global Battery Recycling Industry Revenue Million Forecast, by Battery Type 2020 & 2033
- Table 9: Global Battery Recycling Industry Revenue Million Forecast, by Country 2020 & 2033
- Table 10: Germany Battery Recycling Industry Revenue (Million) Forecast, by Application 2020 & 2033
- Table 11: France Battery Recycling Industry Revenue (Million) Forecast, by Application 2020 & 2033
- Table 12: United Kingdom Battery Recycling Industry Revenue (Million) Forecast, by Application 2020 & 2033
- Table 13: Italy Battery Recycling Industry Revenue (Million) Forecast, by Application 2020 & 2033
- Table 14: Spain Battery Recycling Industry Revenue (Million) Forecast, by Application 2020 & 2033
- Table 15: NORDIC Battery Recycling Industry Revenue (Million) Forecast, by Application 2020 & 2033
- Table 16: Turkey Battery Recycling Industry Revenue (Million) Forecast, by Application 2020 & 2033
- Table 17: Russia Battery Recycling Industry Revenue (Million) Forecast, by Application 2020 & 2033
- Table 18: Rest of Europe Battery Recycling Industry Revenue (Million) Forecast, by Application 2020 & 2033
- Table 19: Global Battery Recycling Industry Revenue Million Forecast, by Battery Type 2020 & 2033
- Table 20: Global Battery Recycling Industry Revenue Million Forecast, by Country 2020 & 2033
- Table 21: China Battery Recycling Industry Revenue (Million) Forecast, by Application 2020 & 2033
- Table 22: India Battery Recycling Industry Revenue (Million) Forecast, by Application 2020 & 2033
- Table 23: Japan Battery Recycling Industry Revenue (Million) Forecast, by Application 2020 & 2033
- Table 24: Australia Battery Recycling Industry Revenue (Million) Forecast, by Application 2020 & 2033
- Table 25: Malaysia Battery Recycling Industry Revenue (Million) Forecast, by Application 2020 & 2033
- Table 26: Thailand Battery Recycling Industry Revenue (Million) Forecast, by Application 2020 & 2033
- Table 27: Indonesia Battery Recycling Industry Revenue (Million) Forecast, by Application 2020 & 2033
- Table 28: Vietnam Battery Recycling Industry Revenue (Million) Forecast, by Application 2020 & 2033
- Table 29: Rest of Asia Pacific Battery Recycling Industry Revenue (Million) Forecast, by Application 2020 & 2033
- Table 30: Global Battery Recycling Industry Revenue Million Forecast, by Battery Type 2020 & 2033
- Table 31: Global Battery Recycling Industry Revenue Million Forecast, by Country 2020 & 2033
- Table 32: Brazil Battery Recycling Industry Revenue (Million) Forecast, by Application 2020 & 2033
- Table 33: Argentina Battery Recycling Industry Revenue (Million) Forecast, by Application 2020 & 2033
- Table 34: Chile Battery Recycling Industry Revenue (Million) Forecast, by Application 2020 & 2033
- Table 35: Colombia Battery Recycling Industry Revenue (Million) Forecast, by Application 2020 & 2033
- Table 36: Rest of South America Battery Recycling Industry Revenue (Million) Forecast, by Application 2020 & 2033
- Table 37: Global Battery Recycling Industry Revenue Million Forecast, by Battery Type 2020 & 2033
- Table 38: Global Battery Recycling Industry Revenue Million Forecast, by Country 2020 & 2033
- Table 39: Saudi Arabia Battery Recycling Industry Revenue (Million) Forecast, by Application 2020 & 2033
- Table 40: United Arab Emirates Battery Recycling Industry Revenue (Million) Forecast, by Application 2020 & 2033
- Table 41: South Africa Battery Recycling Industry Revenue (Million) Forecast, by Application 2020 & 2033
- Table 42: Qatar Battery Recycling Industry Revenue (Million) Forecast, by Application 2020 & 2033
- Table 43: Egypt Battery Recycling Industry Revenue (Million) Forecast, by Application 2020 & 2033
- Table 44: Nigeria Battery Recycling Industry Revenue (Million) Forecast, by Application 2020 & 2033
- Table 45: Rest of Middle East and Africa Battery Recycling Industry Revenue (Million) Forecast, by Application 2020 & 2033
Frequently Asked Questions
1. What is the projected Compound Annual Growth Rate (CAGR) of the Battery Recycling Industry?
The projected CAGR is approximately 22.80%.
2. Which companies are prominent players in the Battery Recycling Industry?
Key companies in the market include Aqua Metals Inc, Neometals Ltd, Battery Recycling Made Easy, Recupyl SAS*List Not Exhaustive 6 4 Market Ranking Analysi, Call2Recycle Inc, Eco-Bat Technologies Ltd, Battery Solutions Inc, Raw Materials Company, Exide Technologies, Accurec Recycling GmbH.
3. What are the main segments of the Battery Recycling Industry?
The market segments include Battery Type.
4. Can you provide details about the market size?
The market size is estimated to be USD 25.49 Million as of 2022.
5. What are some drivers contributing to market growth?
4.; Increasing Adoption Of Electric Vehicles4.; Growing Concern for Battery Waste Disposal and Stringent Government Policies.
6. What are the notable trends driving market growth?
The Lithium-ion Battery Segment is Expected to Witness Significant Growth.
7. Are there any restraints impacting market growth?
4.; High Cost of Recycling Operations.
8. Can you provide examples of recent developments in the market?
December 2023: Toyota and Criba Solution entered a partnership to expand the recycling network, involving the gathering, storing, examining, and handling of batteries to support the growing electric vehicle (EV) industry. The aim was to reduce Toyota's transportation and logistics costs for used batteries by 70% while also cutting down on emissions related to transportation. Additionally, this process is expected to enable the recovery of up to 95% of essential minerals.
9. What pricing options are available for accessing the report?
Pricing options include single-user, multi-user, and enterprise licenses priced at USD 4750, USD 5250, and USD 8750 respectively.
10. Is the market size provided in terms of value or volume?
The market size is provided in terms of value, measured in Million.
11. Are there any specific market keywords associated with the report?
Yes, the market keyword associated with the report is "Battery Recycling Industry," which aids in identifying and referencing the specific market segment covered.
12. How do I determine which pricing option suits my needs best?
The pricing options vary based on user requirements and access needs. Individual users may opt for single-user licenses, while businesses requiring broader access may choose multi-user or enterprise licenses for cost-effective access to the report.
13. Are there any additional resources or data provided in the Battery Recycling Industry report?
While the report offers comprehensive insights, it's advisable to review the specific contents or supplementary materials provided to ascertain if additional resources or data are available.
14. How can I stay updated on further developments or reports in the Battery Recycling Industry?
To stay informed about further developments, trends, and reports in the Battery Recycling Industry, consider subscribing to industry newsletters, following relevant companies and organizations, or regularly checking reputable industry news sources and publications.
Methodology
Step 1 - Identification of Relevant Samples Size from Population Database


Step 2 - Approaches for Defining Global Market Size (Value, Volume* & Price*)

Note*: In applicable scenarios
Step 3 - Data Sources
Primary Research
- Web Analytics
- Survey Reports
- Research Institute
- Latest Research Reports
- Opinion Leaders
Secondary Research
- Annual Reports
- White Paper
- Latest Press Release
- Industry Association
- Paid Database
- Investor Presentations

Step 4 - Data Triangulation
Involves using different sources of information in order to increase the validity of a study
These sources are likely to be stakeholders in a program - participants, other researchers, program staff, other community members, and so on.
Then we put all data in single framework & apply various statistical tools to find out the dynamic on the market.
During the analysis stage, feedback from the stakeholder groups would be compared to determine areas of agreement as well as areas of divergence