

Key Insights
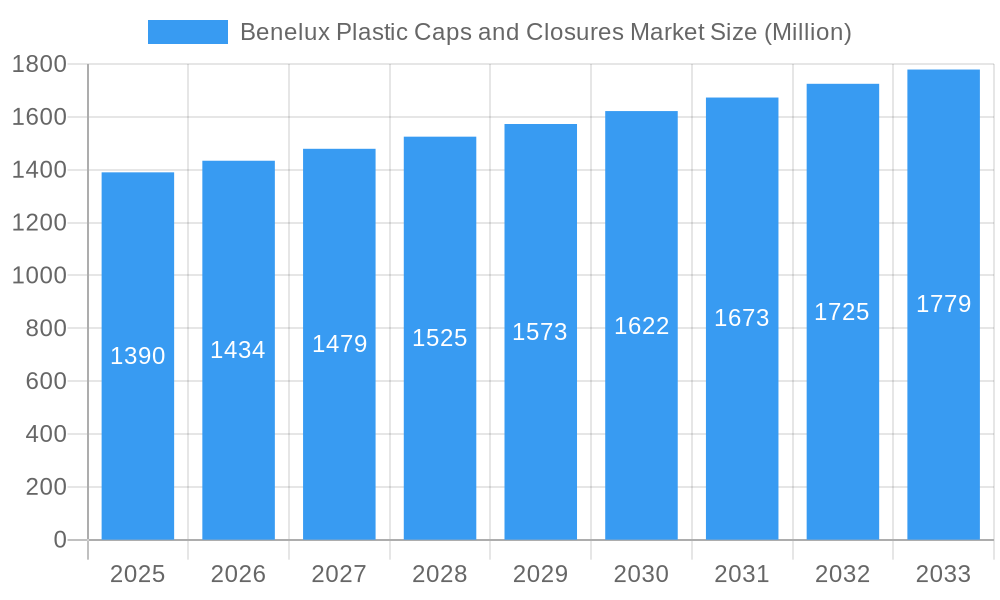
The Benelux plastic caps and closures market is poised for steady growth, projected to reach approximately 1.39 Million units by 2025. This expansion is fueled by a robust Compound Annual Growth Rate (CAGR) of 3.21%, indicating sustained demand and increasing adoption of plastic caps and closures across various end-use industries. The beverage sector, particularly bottled water and juices, along with the personal care and cosmetics segments, are key beneficiaries of this trend, driven by evolving consumer preferences for convenient and safe packaging solutions. The increasing demand for innovative and sustainable packaging materials, coupled with advancements in manufacturing technologies, will further propel market expansion. Companies are focusing on developing caps and closures that offer enhanced functionality, such as child-resistance and tamper-evidence, while also addressing environmental concerns through the use of recyclable and biodegradable materials.
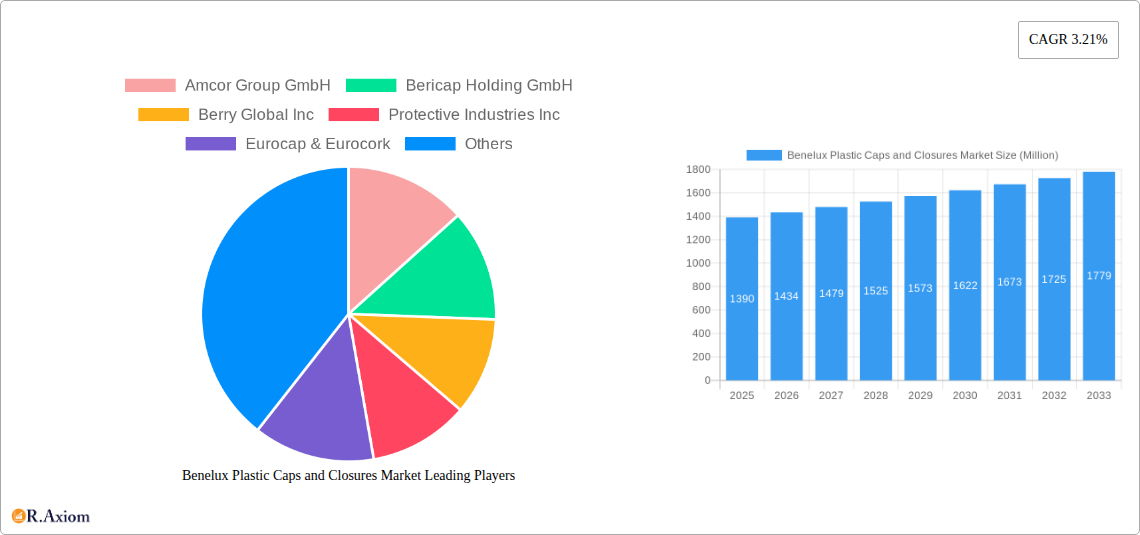
Benelux Plastic Caps and Closures Market Market Size (In Billion)
The market landscape is characterized by a dynamic competitive environment, with both established players and emerging companies vying for market share. Key drivers include the growing demand for packaged goods, rising disposable incomes in the region, and stringent regulations promoting product safety and integrity, which necessitate reliable closure solutions. However, the market also faces certain restraints, including fluctuating raw material prices, particularly for resins like Polyethylene (PE), Polyethylene Terephthalate (PET), and Polypropylene (PP), and increasing environmental scrutiny regarding plastic waste. Innovations in dispensing closures and the growing adoption of e-commerce, which relies heavily on secure and efficient packaging, are significant trends shaping the future of the Benelux plastic caps and closures market. Strategic collaborations and mergers & acquisitions are anticipated as companies aim to expand their product portfolios and geographic reach to capitalize on emerging opportunities.
Benelux Plastic Caps and Closures Market Company Market Share
This comprehensive report offers a detailed analysis of the Benelux plastic caps and closures market, providing critical insights into its current landscape, historical trends, and future trajectory. Covering the period from 2019 to 2033, with a base year of 2025, this study delves into market segmentation, key drivers, challenges, opportunities, and competitive dynamics. The report is designed to equip industry stakeholders, including manufacturers, suppliers, investors, and end-users, with actionable intelligence to navigate this evolving sector.
Benelux Plastic Caps and Closures Market Market Concentration & Innovation
The Benelux plastic caps and closures market exhibits a moderate level of concentration, characterized by the presence of both large multinational corporations and specialized regional players. Innovation is a key differentiator, driven by the growing demand for sustainable packaging solutions, enhanced product safety features, and improved user convenience. Regulatory frameworks, particularly those focused on environmental impact and food-grade safety, significantly influence product development and market entry. Product substitutes, such as metal closures or alternative packaging materials, pose a constant challenge, necessitating continuous innovation in plastic alternatives. End-user trends, such as the rise of e-commerce and the demand for single-serve portions, are shaping product design and functionality. Mergers and acquisitions (M&A) activities are expected to continue as companies seek to expand their product portfolios, gain market share, and achieve economies of scale. For instance, strategic acquisitions by key players could unlock new technologies and customer bases. The market share of leading companies is closely watched as an indicator of competitive intensity.
Benelux Plastic Caps and Closures Market Industry Trends & Insights
The Benelux plastic caps and closures market is poised for sustained growth, driven by a confluence of factors that underscore the indispensability of these packaging components across various industries. The projected Compound Annual Growth Rate (CAGR) for the forecast period is robust, reflecting increasing consumption across the food, beverage, personal care, and household chemical sectors. Technological disruptions are playing a pivotal role, with advancements in material science leading to the development of lighter, stronger, and more sustainable plastic resins. Automation in manufacturing processes is enhancing production efficiency and reducing costs, further contributing to market expansion. Consumer preferences are increasingly leaning towards user-friendly, tamper-evident, and aesthetically pleasing closures that enhance the overall product experience. The growing awareness regarding environmental sustainability is a significant market penetration factor, compelling manufacturers to invest in recyclable, biodegradable, and post-consumer recycled (PCR) content for their plastic caps and closures. Competitive dynamics are characterized by a focus on product differentiation through specialized features like child-resistant mechanisms, dispensing functionalities, and tamper-evident seals. The economic policies within the Benelux region, including trade agreements and environmental regulations, also significantly impact market growth and investment decisions. The market penetration of innovative closure solutions is expected to rise as manufacturers proactively address evolving consumer and regulatory demands.
Dominant Markets & Segments in Benelux Plastic Caps and Closures Market
The Benelux plastic caps and closures market is segmented across various resins, product types, and end-use industries, each exhibiting distinct growth patterns and dominance.
Resin:
- Polyethylene (PE): Dominates due to its versatility, cost-effectiveness, and widespread application in various consumer goods. Its flexibility and durability make it ideal for a broad spectrum of caps and closures.
- Polypropylene (PP): Holds a significant share, particularly for applications requiring higher heat resistance and rigidity. Its chemical inertness also makes it suitable for demanding end-use applications.
- Polyethylene Terephthalate (PET): Crucial for beverage applications, especially for carbonated drinks and bottled water, owing to its clarity, barrier properties, and strength.
- Other Plastics: Includes a range of specialty polymers catering to niche applications requiring specific performance characteristics.
Product Type:
- Threaded - Screw Caps: Represent the largest segment, offering reliable sealing and ease of use across numerous applications. The demand for tamper-evident features within this category is particularly strong.
- Dispensing Closures: Experiencing robust growth due to their convenience in applications like personal care products, household chemicals, and pharmaceuticals, enabling precise dosage or controlled flow.
- Child-resistant Closures: A critical and growing segment, driven by stringent safety regulations, particularly in the pharmaceutical and household chemical sectors, ensuring product safety for children.
- Vacuum Closures: Essential for preserving the shelf life of food and beverage products, these closures play a vital role in extending product viability and reducing spoilage.
- Unthread Closures: While less prevalent, they cater to specific packaging needs where simple closure and opening are prioritized.
End-Use Industries:
- Beverage: This segment is a major consumer of plastic caps and closures, with sub-segments like:
- Bottled Water: High volume demand driven by convenience and health trends.
- Carbonated Soft Drinks: Requires robust, tamper-evident closures to maintain carbonation.
- Juices & Energy Drinks: Growing demand fueled by health-conscious consumers.
- Other Beverages: Encompasses alcoholic beverages and a variety of niche drink products.
- Food: A substantial market for caps and closures used in jars, containers, and pouches, emphasizing preservation and tamper-evidence.
- Personal Care & Cosmetics: Driven by innovation in product design and the demand for specialized dispensing and aesthetic closures.
- Household Chemicals: Requires secure and often child-resistant closures for safety and spill prevention.
- Other End-Use Industries: Includes pharmaceuticals, industrial products, and specialized applications where caps and closures are integral to packaging integrity.
- Beverage: This segment is a major consumer of plastic caps and closures, with sub-segments like:
Benelux Plastic Caps and Closures Market Product Developments
Product innovation in the Benelux plastic caps and closures market is a dynamic force, with companies consistently introducing advanced solutions. Recent developments highlight a strong focus on sustainability, such as the use of lightweight designs and the incorporation of recycled materials. For instance, Berry Global Inc.'s Slimline range of lightweight tube closures, manufactured from virgin PE and PP, demonstrates a commitment to reducing material usage while maintaining functionality for personal care and pharmaceutical applications. These innovations not only meet evolving environmental standards but also offer cost efficiencies and enhanced user experience, providing a competitive edge in the market.
Report Scope & Segmentation Analysis
The Benelux plastic caps and closures market is comprehensively segmented to provide a granular understanding of its dynamics. This report analyzes the market across the following key dimensions:
- Resin: Polyethylene (PE), Polyethylene Terephthalate (PET), Polypropylene (PP), and Other Plastics. Each resin type is evaluated for its market share, growth projections, and key applications, with PE and PP anticipated to maintain their dominance due to their widespread utility and cost-effectiveness.
- Product Type: Threaded - Screw Caps, Vacuum, Dispensing, Unthread, and Child-resistant closures. The analysis will highlight the growth drivers for each, with dispensing and child-resistant closures expected to exhibit higher growth rates driven by safety and convenience demands.
- End-Use Industries: Food, Beverage (further segmented into Bottled Water, Carbonated Soft Drinks, Alcoholic Beverages, Juices & Energy Drinks, Other Beverages), Personal Care & Cosmetics, Household Chemicals, and Other End-Use Industries. The beverage and food segments are projected to remain the largest contributors, with personal care and cosmetics showing significant expansion potential.
Key Drivers of Benelux Plastic Caps and Closures Market Growth
The growth of the Benelux plastic caps and closures market is propelled by several key factors. Increasing consumer demand for packaged goods, particularly in the food, beverage, and personal care sectors, directly translates to a higher requirement for caps and closures. Technological advancements in manufacturing processes, leading to greater efficiency and customization, are also significant drivers. Furthermore, stringent regulatory mandates for product safety and tamper-evidence are fostering the adoption of specialized closure solutions. The growing emphasis on sustainability and the circular economy is spurring innovation in recyclable and bio-based plastic materials, opening new avenues for growth.
Challenges in the Benelux Plastic Caps and Closures Market Sector
Despite the positive growth outlook, the Benelux plastic caps and closures market faces several challenges. Fluctuations in raw material prices, particularly for plastic resins, can impact profit margins and necessitate strategic sourcing. Increasing environmental regulations and public pressure to reduce plastic waste are driving the demand for alternative packaging materials, posing a competitive threat. Supply chain disruptions, exacerbated by geopolitical events and logistical complexities, can affect production and delivery timelines. Intense competition among a fragmented player base also leads to price pressures and requires continuous investment in innovation to maintain market share.
Emerging Opportunities in Benelux Plastic Caps and Closures Market
The Benelux plastic caps and closures market is ripe with emerging opportunities. The increasing adoption of sustainable packaging solutions presents a significant growth area, with demand for closures made from recycled plastics, bioplastics, and biodegradable materials on the rise. The expansion of e-commerce logistics necessitates innovative closure designs that ensure product integrity during transit and offer ease of opening for consumers. The growing demand for personalized and premium products in the personal care and cosmetics sectors is driving the need for aesthetically appealing and functional dispensing closures. Furthermore, advancements in smart packaging technologies, incorporating features like traceability and authentication, offer a new frontier for innovation and market differentiation.
Leading Players in the Benelux Plastic Caps and Closures Market Market
- Amcor Group GmbH
- Bericap Holding GmbH
- Berry Global Inc.
- Protective Industries Inc.
- Eurocap & Eurocork
- Berlin Packaging Netherlands
- Keizer International BV
- Kornelis Caps & Closures
Key Developments in Benelux Plastic Caps and Closures Market Industry
- October 2023: Berry Global Inc. launched its lightweight tube closure, the Slimline range, available in various sizes and manufactured using virgin polyethylene (PE) and polypropylene (PP). This innovation caters to diverse personal care and pharmaceutical applications, emphasizing material efficiency.
- April 2023: Bericap Holding GmbH showcased its extensive range of plastic closures for industrial, food, and beverage applications at Interpack 2023 in Dusseldorf, highlighting its comprehensive product portfolio and commitment to serving key industry segments.
Strategic Outlook for Benelux Plastic Caps and Closures Market Market
The strategic outlook for the Benelux plastic caps and closures market is characterized by a strong emphasis on sustainability, innovation, and market diversification. Manufacturers are expected to continue investing in the development of eco-friendly closures, including those made from recycled and bio-based materials, to align with regulatory demands and consumer preferences. The integration of advanced technologies for enhanced product safety, such as tamper-evident and child-resistant features, will remain a key focus. Expansion into high-growth end-use industries, such as pharmaceuticals and specialized food and beverage applications, will offer significant opportunities. Strategic partnerships and collaborations will be crucial for navigating market complexities and driving innovation, ensuring sustained growth and competitive advantage in the years to come.
Benelux Plastic Caps and Closures Market Segmentation
-
1. Resin
- 1.1. Polyethylene (PE)
- 1.2. Polyethylene Terephthalate (PET)
- 1.3. Polypropylene (PP)
- 1.4. Other Pl
-
2. Product Type
- 2.1. Threaded - Screw Caps, Vacuum, etc.
- 2.2. Dispensing
- 2.3. Unthread
- 2.4. Child-resistant
-
3. End-Use Industries
- 3.1. Food
-
3.2. Beverage
- 3.2.1. Bottled Water
- 3.2.2. Carbonated Soft Drinks
- 3.2.3. Alcoholic Beverages
- 3.2.4. Juices & Energy Drinks
- 3.2.5. Other Beverages
- 3.3. Personal Care & Cosmetics
- 3.4. Household Chemicals
- 3.5. Other End-Use Industries
Benelux Plastic Caps and Closures Market Segmentation By Geography
-
1. North America
- 1.1. United States
- 1.2. Canada
- 1.3. Mexico
-
2. South America
- 2.1. Brazil
- 2.2. Argentina
- 2.3. Rest of South America
-
3. Europe
- 3.1. United Kingdom
- 3.2. Germany
- 3.3. France
- 3.4. Italy
- 3.5. Spain
- 3.6. Russia
- 3.7. Benelux
- 3.8. Nordics
- 3.9. Rest of Europe
-
4. Middle East & Africa
- 4.1. Turkey
- 4.2. Israel
- 4.3. GCC
- 4.4. North Africa
- 4.5. South Africa
- 4.6. Rest of Middle East & Africa
-
5. Asia Pacific
- 5.1. China
- 5.2. India
- 5.3. Japan
- 5.4. South Korea
- 5.5. ASEAN
- 5.6. Oceania
- 5.7. Rest of Asia Pacific
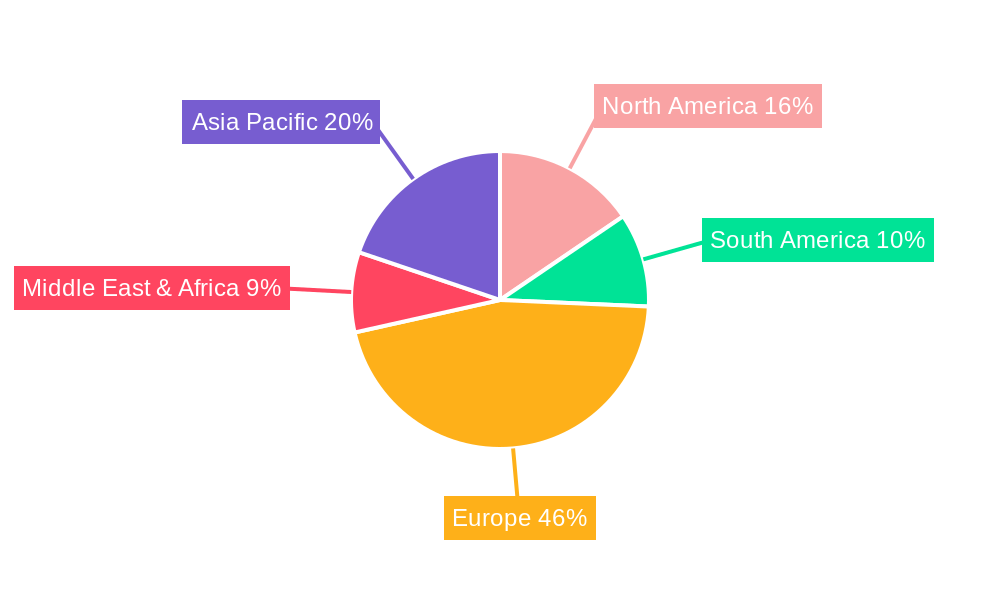
Benelux Plastic Caps and Closures Market Regional Market Share
Geographic Coverage of Benelux Plastic Caps and Closures Market
Benelux Plastic Caps and Closures Market REPORT HIGHLIGHTS
| Aspects | Details |
|---|---|
| Study Period | 2020-2034 |
| Base Year | 2025 |
| Estimated Year | 2026 |
| Forecast Period | 2026-2034 |
| Historical Period | 2020-2025 |
| Growth Rate | CAGR of 3.21% from 2020-2034 |
| Segmentation |
|
Table of Contents
- 1. Introduction
- 1.1. Research Scope
- 1.2. Market Segmentation
- 1.3. Research Objective
- 1.4. Definitions and Assumptions
- 2. Executive Summary
- 2.1. Market Snapshot
- 3. Market Dynamics
- 3.1. Market Drivers
- 3.2. Market Restrains
- 3.3. Market Trends
- 3.4. Market Opportunities
- 4. Market Factor Analysis
- 4.1. Porters Five Forces
- 4.1.1. Bargaining Power of Suppliers
- 4.1.2. Bargaining Power of Buyers
- 4.1.3. Threat of New Entrants
- 4.1.4. Threat of Substitutes
- 4.1.5. Competitive Rivalry
- 4.2. PESTEL analysis
- 4.3. BCG Analysis
- 4.3.1. Stars (High Growth, High Market Share)
- 4.3.2. Cash Cows (Low Growth, High Market Share)
- 4.3.3. Question Mark (High Growth, Low Market Share)
- 4.3.4. Dogs (Low Growth, Low Market Share)
- 4.4. Ansoff Matrix Analysis
- 4.5. Supply Chain Analysis
- 4.6. Regulatory Landscape
- 4.7. Current Market Potential and Opportunity Assessment (TAM–SAM–SOM Framework)
- 4.8. RAX Analyst Note
- 4.1. Porters Five Forces
- 5. Market Analysis, Insights and Forecast 2021-2033
- 5.1. Market Analysis, Insights and Forecast - by Resin
- 5.1.1. Polyethylene (PE)
- 5.1.2. Polyethylene Terephthalate (PET)
- 5.1.3. Polypropylene (PP)
- 5.1.4. Other Pl
- 5.2. Market Analysis, Insights and Forecast - by Product Type
- 5.2.1. Threaded - Screw Caps, Vacuum, etc.
- 5.2.2. Dispensing
- 5.2.3. Unthread
- 5.2.4. Child-resistant
- 5.3. Market Analysis, Insights and Forecast - by End-Use Industries
- 5.3.1. Food
- 5.3.2. Beverage
- 5.3.2.1. Bottled Water
- 5.3.2.2. Carbonated Soft Drinks
- 5.3.2.3. Alcoholic Beverages
- 5.3.2.4. Juices & Energy Drinks
- 5.3.2.5. Other Beverages
- 5.3.3. Personal Care & Cosmetics
- 5.3.4. Household Chemicals
- 5.3.5. Other End-Use Industries
- 5.4. Market Analysis, Insights and Forecast - by Region
- 5.4.1. North America
- 5.4.2. South America
- 5.4.3. Europe
- 5.4.4. Middle East & Africa
- 5.4.5. Asia Pacific
- 5.1. Market Analysis, Insights and Forecast - by Resin
- 6. Global Benelux Plastic Caps and Closures Market Analysis, Insights and Forecast, 2021-2033
- 6.1. Market Analysis, Insights and Forecast - by Resin
- 6.1.1. Polyethylene (PE)
- 6.1.2. Polyethylene Terephthalate (PET)
- 6.1.3. Polypropylene (PP)
- 6.1.4. Other Pl
- 6.2. Market Analysis, Insights and Forecast - by Product Type
- 6.2.1. Threaded - Screw Caps, Vacuum, etc.
- 6.2.2. Dispensing
- 6.2.3. Unthread
- 6.2.4. Child-resistant
- 6.3. Market Analysis, Insights and Forecast - by End-Use Industries
- 6.3.1. Food
- 6.3.2. Beverage
- 6.3.2.1. Bottled Water
- 6.3.2.2. Carbonated Soft Drinks
- 6.3.2.3. Alcoholic Beverages
- 6.3.2.4. Juices & Energy Drinks
- 6.3.2.5. Other Beverages
- 6.3.3. Personal Care & Cosmetics
- 6.3.4. Household Chemicals
- 6.3.5. Other End-Use Industries
- 6.1. Market Analysis, Insights and Forecast - by Resin
- 7. North America Benelux Plastic Caps and Closures Market Analysis, Insights and Forecast, 2020-2032
- 7.1. Market Analysis, Insights and Forecast - by Resin
- 7.1.1. Polyethylene (PE)
- 7.1.2. Polyethylene Terephthalate (PET)
- 7.1.3. Polypropylene (PP)
- 7.1.4. Other Pl
- 7.2. Market Analysis, Insights and Forecast - by Product Type
- 7.2.1. Threaded - Screw Caps, Vacuum, etc.
- 7.2.2. Dispensing
- 7.2.3. Unthread
- 7.2.4. Child-resistant
- 7.3. Market Analysis, Insights and Forecast - by End-Use Industries
- 7.3.1. Food
- 7.3.2. Beverage
- 7.3.2.1. Bottled Water
- 7.3.2.2. Carbonated Soft Drinks
- 7.3.2.3. Alcoholic Beverages
- 7.3.2.4. Juices & Energy Drinks
- 7.3.2.5. Other Beverages
- 7.3.3. Personal Care & Cosmetics
- 7.3.4. Household Chemicals
- 7.3.5. Other End-Use Industries
- 7.1. Market Analysis, Insights and Forecast - by Resin
- 8. South America Benelux Plastic Caps and Closures Market Analysis, Insights and Forecast, 2020-2032
- 8.1. Market Analysis, Insights and Forecast - by Resin
- 8.1.1. Polyethylene (PE)
- 8.1.2. Polyethylene Terephthalate (PET)
- 8.1.3. Polypropylene (PP)
- 8.1.4. Other Pl
- 8.2. Market Analysis, Insights and Forecast - by Product Type
- 8.2.1. Threaded - Screw Caps, Vacuum, etc.
- 8.2.2. Dispensing
- 8.2.3. Unthread
- 8.2.4. Child-resistant
- 8.3. Market Analysis, Insights and Forecast - by End-Use Industries
- 8.3.1. Food
- 8.3.2. Beverage
- 8.3.2.1. Bottled Water
- 8.3.2.2. Carbonated Soft Drinks
- 8.3.2.3. Alcoholic Beverages
- 8.3.2.4. Juices & Energy Drinks
- 8.3.2.5. Other Beverages
- 8.3.3. Personal Care & Cosmetics
- 8.3.4. Household Chemicals
- 8.3.5. Other End-Use Industries
- 8.1. Market Analysis, Insights and Forecast - by Resin
- 9. Europe Benelux Plastic Caps and Closures Market Analysis, Insights and Forecast, 2020-2032
- 9.1. Market Analysis, Insights and Forecast - by Resin
- 9.1.1. Polyethylene (PE)
- 9.1.2. Polyethylene Terephthalate (PET)
- 9.1.3. Polypropylene (PP)
- 9.1.4. Other Pl
- 9.2. Market Analysis, Insights and Forecast - by Product Type
- 9.2.1. Threaded - Screw Caps, Vacuum, etc.
- 9.2.2. Dispensing
- 9.2.3. Unthread
- 9.2.4. Child-resistant
- 9.3. Market Analysis, Insights and Forecast - by End-Use Industries
- 9.3.1. Food
- 9.3.2. Beverage
- 9.3.2.1. Bottled Water
- 9.3.2.2. Carbonated Soft Drinks
- 9.3.2.3. Alcoholic Beverages
- 9.3.2.4. Juices & Energy Drinks
- 9.3.2.5. Other Beverages
- 9.3.3. Personal Care & Cosmetics
- 9.3.4. Household Chemicals
- 9.3.5. Other End-Use Industries
- 9.1. Market Analysis, Insights and Forecast - by Resin
- 10. Middle East & Africa Benelux Plastic Caps and Closures Market Analysis, Insights and Forecast, 2020-2032
- 10.1. Market Analysis, Insights and Forecast - by Resin
- 10.1.1. Polyethylene (PE)
- 10.1.2. Polyethylene Terephthalate (PET)
- 10.1.3. Polypropylene (PP)
- 10.1.4. Other Pl
- 10.2. Market Analysis, Insights and Forecast - by Product Type
- 10.2.1. Threaded - Screw Caps, Vacuum, etc.
- 10.2.2. Dispensing
- 10.2.3. Unthread
- 10.2.4. Child-resistant
- 10.3. Market Analysis, Insights and Forecast - by End-Use Industries
- 10.3.1. Food
- 10.3.2. Beverage
- 10.3.2.1. Bottled Water
- 10.3.2.2. Carbonated Soft Drinks
- 10.3.2.3. Alcoholic Beverages
- 10.3.2.4. Juices & Energy Drinks
- 10.3.2.5. Other Beverages
- 10.3.3. Personal Care & Cosmetics
- 10.3.4. Household Chemicals
- 10.3.5. Other End-Use Industries
- 10.1. Market Analysis, Insights and Forecast - by Resin
- 11. Asia Pacific Benelux Plastic Caps and Closures Market Analysis, Insights and Forecast, 2020-2032
- 11.1. Market Analysis, Insights and Forecast - by Resin
- 11.1.1. Polyethylene (PE)
- 11.1.2. Polyethylene Terephthalate (PET)
- 11.1.3. Polypropylene (PP)
- 11.1.4. Other Pl
- 11.2. Market Analysis, Insights and Forecast - by Product Type
- 11.2.1. Threaded - Screw Caps, Vacuum, etc.
- 11.2.2. Dispensing
- 11.2.3. Unthread
- 11.2.4. Child-resistant
- 11.3. Market Analysis, Insights and Forecast - by End-Use Industries
- 11.3.1. Food
- 11.3.2. Beverage
- 11.3.2.1. Bottled Water
- 11.3.2.2. Carbonated Soft Drinks
- 11.3.2.3. Alcoholic Beverages
- 11.3.2.4. Juices & Energy Drinks
- 11.3.2.5. Other Beverages
- 11.3.3. Personal Care & Cosmetics
- 11.3.4. Household Chemicals
- 11.3.5. Other End-Use Industries
- 11.1. Market Analysis, Insights and Forecast - by Resin
- 12. Competitive Analysis
- 12.1. Company Profiles
- 12.1.1 Amcor Group GmbH
- 12.1.1.1. Company Overview
- 12.1.1.2. Products
- 12.1.1.3. Company Financials
- 12.1.1.4. SWOT Analysis
- 12.1.2 Bericap Holding GmbH
- 12.1.2.1. Company Overview
- 12.1.2.2. Products
- 12.1.2.3. Company Financials
- 12.1.2.4. SWOT Analysis
- 12.1.3 Berry Global Inc
- 12.1.3.1. Company Overview
- 12.1.3.2. Products
- 12.1.3.3. Company Financials
- 12.1.3.4. SWOT Analysis
- 12.1.4 Protective Industries Inc
- 12.1.4.1. Company Overview
- 12.1.4.2. Products
- 12.1.4.3. Company Financials
- 12.1.4.4. SWOT Analysis
- 12.1.5 Eurocap & Eurocork
- 12.1.5.1. Company Overview
- 12.1.5.2. Products
- 12.1.5.3. Company Financials
- 12.1.5.4. SWOT Analysis
- 12.1.6 Berlin Packaging Netherlands
- 12.1.6.1. Company Overview
- 12.1.6.2. Products
- 12.1.6.3. Company Financials
- 12.1.6.4. SWOT Analysis
- 12.1.7 Keizer International BV
- 12.1.7.1. Company Overview
- 12.1.7.2. Products
- 12.1.7.3. Company Financials
- 12.1.7.4. SWOT Analysis
- 12.1.8 Kornelis Caps & Closures8 2 Heat Map Analysis8 3 Competitor Analysis - Emerging vs Established Player
- 12.1.8.1. Company Overview
- 12.1.8.2. Products
- 12.1.8.3. Company Financials
- 12.1.8.4. SWOT Analysis
- 12.1.1 Amcor Group GmbH
- 12.2. Market Entropy
- 12.2.1 Company's Key Areas Served
- 12.2.2 Recent Developments
- 12.3. Company Market Share Analysis 2025
- 12.3.1 Top 5 Companies Market Share Analysis
- 12.3.2 Top 3 Companies Market Share Analysis
- 12.4. List of Potential Customers
- 13. Research Methodology
List of Figures
- Figure 1: Global Benelux Plastic Caps and Closures Market Revenue Breakdown (Million, %) by Region 2025 & 2033
- Figure 2: Global Benelux Plastic Caps and Closures Market Volume Breakdown (Billion, %) by Region 2025 & 2033
- Figure 3: North America Benelux Plastic Caps and Closures Market Revenue (Million), by Resin 2025 & 2033
- Figure 4: North America Benelux Plastic Caps and Closures Market Volume (Billion), by Resin 2025 & 2033
- Figure 5: North America Benelux Plastic Caps and Closures Market Revenue Share (%), by Resin 2025 & 2033
- Figure 6: North America Benelux Plastic Caps and Closures Market Volume Share (%), by Resin 2025 & 2033
- Figure 7: North America Benelux Plastic Caps and Closures Market Revenue (Million), by Product Type 2025 & 2033
- Figure 8: North America Benelux Plastic Caps and Closures Market Volume (Billion), by Product Type 2025 & 2033
- Figure 9: North America Benelux Plastic Caps and Closures Market Revenue Share (%), by Product Type 2025 & 2033
- Figure 10: North America Benelux Plastic Caps and Closures Market Volume Share (%), by Product Type 2025 & 2033
- Figure 11: North America Benelux Plastic Caps and Closures Market Revenue (Million), by End-Use Industries 2025 & 2033
- Figure 12: North America Benelux Plastic Caps and Closures Market Volume (Billion), by End-Use Industries 2025 & 2033
- Figure 13: North America Benelux Plastic Caps and Closures Market Revenue Share (%), by End-Use Industries 2025 & 2033
- Figure 14: North America Benelux Plastic Caps and Closures Market Volume Share (%), by End-Use Industries 2025 & 2033
- Figure 15: North America Benelux Plastic Caps and Closures Market Revenue (Million), by Country 2025 & 2033
- Figure 16: North America Benelux Plastic Caps and Closures Market Volume (Billion), by Country 2025 & 2033
- Figure 17: North America Benelux Plastic Caps and Closures Market Revenue Share (%), by Country 2025 & 2033
- Figure 18: North America Benelux Plastic Caps and Closures Market Volume Share (%), by Country 2025 & 2033
- Figure 19: South America Benelux Plastic Caps and Closures Market Revenue (Million), by Resin 2025 & 2033
- Figure 20: South America Benelux Plastic Caps and Closures Market Volume (Billion), by Resin 2025 & 2033
- Figure 21: South America Benelux Plastic Caps and Closures Market Revenue Share (%), by Resin 2025 & 2033
- Figure 22: South America Benelux Plastic Caps and Closures Market Volume Share (%), by Resin 2025 & 2033
- Figure 23: South America Benelux Plastic Caps and Closures Market Revenue (Million), by Product Type 2025 & 2033
- Figure 24: South America Benelux Plastic Caps and Closures Market Volume (Billion), by Product Type 2025 & 2033
- Figure 25: South America Benelux Plastic Caps and Closures Market Revenue Share (%), by Product Type 2025 & 2033
- Figure 26: South America Benelux Plastic Caps and Closures Market Volume Share (%), by Product Type 2025 & 2033
- Figure 27: South America Benelux Plastic Caps and Closures Market Revenue (Million), by End-Use Industries 2025 & 2033
- Figure 28: South America Benelux Plastic Caps and Closures Market Volume (Billion), by End-Use Industries 2025 & 2033
- Figure 29: South America Benelux Plastic Caps and Closures Market Revenue Share (%), by End-Use Industries 2025 & 2033
- Figure 30: South America Benelux Plastic Caps and Closures Market Volume Share (%), by End-Use Industries 2025 & 2033
- Figure 31: South America Benelux Plastic Caps and Closures Market Revenue (Million), by Country 2025 & 2033
- Figure 32: South America Benelux Plastic Caps and Closures Market Volume (Billion), by Country 2025 & 2033
- Figure 33: South America Benelux Plastic Caps and Closures Market Revenue Share (%), by Country 2025 & 2033
- Figure 34: South America Benelux Plastic Caps and Closures Market Volume Share (%), by Country 2025 & 2033
- Figure 35: Europe Benelux Plastic Caps and Closures Market Revenue (Million), by Resin 2025 & 2033
- Figure 36: Europe Benelux Plastic Caps and Closures Market Volume (Billion), by Resin 2025 & 2033
- Figure 37: Europe Benelux Plastic Caps and Closures Market Revenue Share (%), by Resin 2025 & 2033
- Figure 38: Europe Benelux Plastic Caps and Closures Market Volume Share (%), by Resin 2025 & 2033
- Figure 39: Europe Benelux Plastic Caps and Closures Market Revenue (Million), by Product Type 2025 & 2033
- Figure 40: Europe Benelux Plastic Caps and Closures Market Volume (Billion), by Product Type 2025 & 2033
- Figure 41: Europe Benelux Plastic Caps and Closures Market Revenue Share (%), by Product Type 2025 & 2033
- Figure 42: Europe Benelux Plastic Caps and Closures Market Volume Share (%), by Product Type 2025 & 2033
- Figure 43: Europe Benelux Plastic Caps and Closures Market Revenue (Million), by End-Use Industries 2025 & 2033
- Figure 44: Europe Benelux Plastic Caps and Closures Market Volume (Billion), by End-Use Industries 2025 & 2033
- Figure 45: Europe Benelux Plastic Caps and Closures Market Revenue Share (%), by End-Use Industries 2025 & 2033
- Figure 46: Europe Benelux Plastic Caps and Closures Market Volume Share (%), by End-Use Industries 2025 & 2033
- Figure 47: Europe Benelux Plastic Caps and Closures Market Revenue (Million), by Country 2025 & 2033
- Figure 48: Europe Benelux Plastic Caps and Closures Market Volume (Billion), by Country 2025 & 2033
- Figure 49: Europe Benelux Plastic Caps and Closures Market Revenue Share (%), by Country 2025 & 2033
- Figure 50: Europe Benelux Plastic Caps and Closures Market Volume Share (%), by Country 2025 & 2033
- Figure 51: Middle East & Africa Benelux Plastic Caps and Closures Market Revenue (Million), by Resin 2025 & 2033
- Figure 52: Middle East & Africa Benelux Plastic Caps and Closures Market Volume (Billion), by Resin 2025 & 2033
- Figure 53: Middle East & Africa Benelux Plastic Caps and Closures Market Revenue Share (%), by Resin 2025 & 2033
- Figure 54: Middle East & Africa Benelux Plastic Caps and Closures Market Volume Share (%), by Resin 2025 & 2033
- Figure 55: Middle East & Africa Benelux Plastic Caps and Closures Market Revenue (Million), by Product Type 2025 & 2033
- Figure 56: Middle East & Africa Benelux Plastic Caps and Closures Market Volume (Billion), by Product Type 2025 & 2033
- Figure 57: Middle East & Africa Benelux Plastic Caps and Closures Market Revenue Share (%), by Product Type 2025 & 2033
- Figure 58: Middle East & Africa Benelux Plastic Caps and Closures Market Volume Share (%), by Product Type 2025 & 2033
- Figure 59: Middle East & Africa Benelux Plastic Caps and Closures Market Revenue (Million), by End-Use Industries 2025 & 2033
- Figure 60: Middle East & Africa Benelux Plastic Caps and Closures Market Volume (Billion), by End-Use Industries 2025 & 2033
- Figure 61: Middle East & Africa Benelux Plastic Caps and Closures Market Revenue Share (%), by End-Use Industries 2025 & 2033
- Figure 62: Middle East & Africa Benelux Plastic Caps and Closures Market Volume Share (%), by End-Use Industries 2025 & 2033
- Figure 63: Middle East & Africa Benelux Plastic Caps and Closures Market Revenue (Million), by Country 2025 & 2033
- Figure 64: Middle East & Africa Benelux Plastic Caps and Closures Market Volume (Billion), by Country 2025 & 2033
- Figure 65: Middle East & Africa Benelux Plastic Caps and Closures Market Revenue Share (%), by Country 2025 & 2033
- Figure 66: Middle East & Africa Benelux Plastic Caps and Closures Market Volume Share (%), by Country 2025 & 2033
- Figure 67: Asia Pacific Benelux Plastic Caps and Closures Market Revenue (Million), by Resin 2025 & 2033
- Figure 68: Asia Pacific Benelux Plastic Caps and Closures Market Volume (Billion), by Resin 2025 & 2033
- Figure 69: Asia Pacific Benelux Plastic Caps and Closures Market Revenue Share (%), by Resin 2025 & 2033
- Figure 70: Asia Pacific Benelux Plastic Caps and Closures Market Volume Share (%), by Resin 2025 & 2033
- Figure 71: Asia Pacific Benelux Plastic Caps and Closures Market Revenue (Million), by Product Type 2025 & 2033
- Figure 72: Asia Pacific Benelux Plastic Caps and Closures Market Volume (Billion), by Product Type 2025 & 2033
- Figure 73: Asia Pacific Benelux Plastic Caps and Closures Market Revenue Share (%), by Product Type 2025 & 2033
- Figure 74: Asia Pacific Benelux Plastic Caps and Closures Market Volume Share (%), by Product Type 2025 & 2033
- Figure 75: Asia Pacific Benelux Plastic Caps and Closures Market Revenue (Million), by End-Use Industries 2025 & 2033
- Figure 76: Asia Pacific Benelux Plastic Caps and Closures Market Volume (Billion), by End-Use Industries 2025 & 2033
- Figure 77: Asia Pacific Benelux Plastic Caps and Closures Market Revenue Share (%), by End-Use Industries 2025 & 2033
- Figure 78: Asia Pacific Benelux Plastic Caps and Closures Market Volume Share (%), by End-Use Industries 2025 & 2033
- Figure 79: Asia Pacific Benelux Plastic Caps and Closures Market Revenue (Million), by Country 2025 & 2033
- Figure 80: Asia Pacific Benelux Plastic Caps and Closures Market Volume (Billion), by Country 2025 & 2033
- Figure 81: Asia Pacific Benelux Plastic Caps and Closures Market Revenue Share (%), by Country 2025 & 2033
- Figure 82: Asia Pacific Benelux Plastic Caps and Closures Market Volume Share (%), by Country 2025 & 2033
List of Tables
- Table 1: Global Benelux Plastic Caps and Closures Market Revenue Million Forecast, by Resin 2020 & 2033
- Table 2: Global Benelux Plastic Caps and Closures Market Volume Billion Forecast, by Resin 2020 & 2033
- Table 3: Global Benelux Plastic Caps and Closures Market Revenue Million Forecast, by Product Type 2020 & 2033
- Table 4: Global Benelux Plastic Caps and Closures Market Volume Billion Forecast, by Product Type 2020 & 2033
- Table 5: Global Benelux Plastic Caps and Closures Market Revenue Million Forecast, by End-Use Industries 2020 & 2033
- Table 6: Global Benelux Plastic Caps and Closures Market Volume Billion Forecast, by End-Use Industries 2020 & 2033
- Table 7: Global Benelux Plastic Caps and Closures Market Revenue Million Forecast, by Region 2020 & 2033
- Table 8: Global Benelux Plastic Caps and Closures Market Volume Billion Forecast, by Region 2020 & 2033
- Table 9: Global Benelux Plastic Caps and Closures Market Revenue Million Forecast, by Resin 2020 & 2033
- Table 10: Global Benelux Plastic Caps and Closures Market Volume Billion Forecast, by Resin 2020 & 2033
- Table 11: Global Benelux Plastic Caps and Closures Market Revenue Million Forecast, by Product Type 2020 & 2033
- Table 12: Global Benelux Plastic Caps and Closures Market Volume Billion Forecast, by Product Type 2020 & 2033
- Table 13: Global Benelux Plastic Caps and Closures Market Revenue Million Forecast, by End-Use Industries 2020 & 2033
- Table 14: Global Benelux Plastic Caps and Closures Market Volume Billion Forecast, by End-Use Industries 2020 & 2033
- Table 15: Global Benelux Plastic Caps and Closures Market Revenue Million Forecast, by Country 2020 & 2033
- Table 16: Global Benelux Plastic Caps and Closures Market Volume Billion Forecast, by Country 2020 & 2033
- Table 17: United States Benelux Plastic Caps and Closures Market Revenue (Million) Forecast, by Application 2020 & 2033
- Table 18: United States Benelux Plastic Caps and Closures Market Volume (Billion) Forecast, by Application 2020 & 2033
- Table 19: Canada Benelux Plastic Caps and Closures Market Revenue (Million) Forecast, by Application 2020 & 2033
- Table 20: Canada Benelux Plastic Caps and Closures Market Volume (Billion) Forecast, by Application 2020 & 2033
- Table 21: Mexico Benelux Plastic Caps and Closures Market Revenue (Million) Forecast, by Application 2020 & 2033
- Table 22: Mexico Benelux Plastic Caps and Closures Market Volume (Billion) Forecast, by Application 2020 & 2033
- Table 23: Global Benelux Plastic Caps and Closures Market Revenue Million Forecast, by Resin 2020 & 2033
- Table 24: Global Benelux Plastic Caps and Closures Market Volume Billion Forecast, by Resin 2020 & 2033
- Table 25: Global Benelux Plastic Caps and Closures Market Revenue Million Forecast, by Product Type 2020 & 2033
- Table 26: Global Benelux Plastic Caps and Closures Market Volume Billion Forecast, by Product Type 2020 & 2033
- Table 27: Global Benelux Plastic Caps and Closures Market Revenue Million Forecast, by End-Use Industries 2020 & 2033
- Table 28: Global Benelux Plastic Caps and Closures Market Volume Billion Forecast, by End-Use Industries 2020 & 2033
- Table 29: Global Benelux Plastic Caps and Closures Market Revenue Million Forecast, by Country 2020 & 2033
- Table 30: Global Benelux Plastic Caps and Closures Market Volume Billion Forecast, by Country 2020 & 2033
- Table 31: Brazil Benelux Plastic Caps and Closures Market Revenue (Million) Forecast, by Application 2020 & 2033
- Table 32: Brazil Benelux Plastic Caps and Closures Market Volume (Billion) Forecast, by Application 2020 & 2033
- Table 33: Argentina Benelux Plastic Caps and Closures Market Revenue (Million) Forecast, by Application 2020 & 2033
- Table 34: Argentina Benelux Plastic Caps and Closures Market Volume (Billion) Forecast, by Application 2020 & 2033
- Table 35: Rest of South America Benelux Plastic Caps and Closures Market Revenue (Million) Forecast, by Application 2020 & 2033
- Table 36: Rest of South America Benelux Plastic Caps and Closures Market Volume (Billion) Forecast, by Application 2020 & 2033
- Table 37: Global Benelux Plastic Caps and Closures Market Revenue Million Forecast, by Resin 2020 & 2033
- Table 38: Global Benelux Plastic Caps and Closures Market Volume Billion Forecast, by Resin 2020 & 2033
- Table 39: Global Benelux Plastic Caps and Closures Market Revenue Million Forecast, by Product Type 2020 & 2033
- Table 40: Global Benelux Plastic Caps and Closures Market Volume Billion Forecast, by Product Type 2020 & 2033
- Table 41: Global Benelux Plastic Caps and Closures Market Revenue Million Forecast, by End-Use Industries 2020 & 2033
- Table 42: Global Benelux Plastic Caps and Closures Market Volume Billion Forecast, by End-Use Industries 2020 & 2033
- Table 43: Global Benelux Plastic Caps and Closures Market Revenue Million Forecast, by Country 2020 & 2033
- Table 44: Global Benelux Plastic Caps and Closures Market Volume Billion Forecast, by Country 2020 & 2033
- Table 45: United Kingdom Benelux Plastic Caps and Closures Market Revenue (Million) Forecast, by Application 2020 & 2033
- Table 46: United Kingdom Benelux Plastic Caps and Closures Market Volume (Billion) Forecast, by Application 2020 & 2033
- Table 47: Germany Benelux Plastic Caps and Closures Market Revenue (Million) Forecast, by Application 2020 & 2033
- Table 48: Germany Benelux Plastic Caps and Closures Market Volume (Billion) Forecast, by Application 2020 & 2033
- Table 49: France Benelux Plastic Caps and Closures Market Revenue (Million) Forecast, by Application 2020 & 2033
- Table 50: France Benelux Plastic Caps and Closures Market Volume (Billion) Forecast, by Application 2020 & 2033
- Table 51: Italy Benelux Plastic Caps and Closures Market Revenue (Million) Forecast, by Application 2020 & 2033
- Table 52: Italy Benelux Plastic Caps and Closures Market Volume (Billion) Forecast, by Application 2020 & 2033
- Table 53: Spain Benelux Plastic Caps and Closures Market Revenue (Million) Forecast, by Application 2020 & 2033
- Table 54: Spain Benelux Plastic Caps and Closures Market Volume (Billion) Forecast, by Application 2020 & 2033
- Table 55: Russia Benelux Plastic Caps and Closures Market Revenue (Million) Forecast, by Application 2020 & 2033
- Table 56: Russia Benelux Plastic Caps and Closures Market Volume (Billion) Forecast, by Application 2020 & 2033
- Table 57: Benelux Benelux Plastic Caps and Closures Market Revenue (Million) Forecast, by Application 2020 & 2033
- Table 58: Benelux Benelux Plastic Caps and Closures Market Volume (Billion) Forecast, by Application 2020 & 2033
- Table 59: Nordics Benelux Plastic Caps and Closures Market Revenue (Million) Forecast, by Application 2020 & 2033
- Table 60: Nordics Benelux Plastic Caps and Closures Market Volume (Billion) Forecast, by Application 2020 & 2033
- Table 61: Rest of Europe Benelux Plastic Caps and Closures Market Revenue (Million) Forecast, by Application 2020 & 2033
- Table 62: Rest of Europe Benelux Plastic Caps and Closures Market Volume (Billion) Forecast, by Application 2020 & 2033
- Table 63: Global Benelux Plastic Caps and Closures Market Revenue Million Forecast, by Resin 2020 & 2033
- Table 64: Global Benelux Plastic Caps and Closures Market Volume Billion Forecast, by Resin 2020 & 2033
- Table 65: Global Benelux Plastic Caps and Closures Market Revenue Million Forecast, by Product Type 2020 & 2033
- Table 66: Global Benelux Plastic Caps and Closures Market Volume Billion Forecast, by Product Type 2020 & 2033
- Table 67: Global Benelux Plastic Caps and Closures Market Revenue Million Forecast, by End-Use Industries 2020 & 2033
- Table 68: Global Benelux Plastic Caps and Closures Market Volume Billion Forecast, by End-Use Industries 2020 & 2033
- Table 69: Global Benelux Plastic Caps and Closures Market Revenue Million Forecast, by Country 2020 & 2033
- Table 70: Global Benelux Plastic Caps and Closures Market Volume Billion Forecast, by Country 2020 & 2033
- Table 71: Turkey Benelux Plastic Caps and Closures Market Revenue (Million) Forecast, by Application 2020 & 2033
- Table 72: Turkey Benelux Plastic Caps and Closures Market Volume (Billion) Forecast, by Application 2020 & 2033
- Table 73: Israel Benelux Plastic Caps and Closures Market Revenue (Million) Forecast, by Application 2020 & 2033
- Table 74: Israel Benelux Plastic Caps and Closures Market Volume (Billion) Forecast, by Application 2020 & 2033
- Table 75: GCC Benelux Plastic Caps and Closures Market Revenue (Million) Forecast, by Application 2020 & 2033
- Table 76: GCC Benelux Plastic Caps and Closures Market Volume (Billion) Forecast, by Application 2020 & 2033
- Table 77: North Africa Benelux Plastic Caps and Closures Market Revenue (Million) Forecast, by Application 2020 & 2033
- Table 78: North Africa Benelux Plastic Caps and Closures Market Volume (Billion) Forecast, by Application 2020 & 2033
- Table 79: South Africa Benelux Plastic Caps and Closures Market Revenue (Million) Forecast, by Application 2020 & 2033
- Table 80: South Africa Benelux Plastic Caps and Closures Market Volume (Billion) Forecast, by Application 2020 & 2033
- Table 81: Rest of Middle East & Africa Benelux Plastic Caps and Closures Market Revenue (Million) Forecast, by Application 2020 & 2033
- Table 82: Rest of Middle East & Africa Benelux Plastic Caps and Closures Market Volume (Billion) Forecast, by Application 2020 & 2033
- Table 83: Global Benelux Plastic Caps and Closures Market Revenue Million Forecast, by Resin 2020 & 2033
- Table 84: Global Benelux Plastic Caps and Closures Market Volume Billion Forecast, by Resin 2020 & 2033
- Table 85: Global Benelux Plastic Caps and Closures Market Revenue Million Forecast, by Product Type 2020 & 2033
- Table 86: Global Benelux Plastic Caps and Closures Market Volume Billion Forecast, by Product Type 2020 & 2033
- Table 87: Global Benelux Plastic Caps and Closures Market Revenue Million Forecast, by End-Use Industries 2020 & 2033
- Table 88: Global Benelux Plastic Caps and Closures Market Volume Billion Forecast, by End-Use Industries 2020 & 2033
- Table 89: Global Benelux Plastic Caps and Closures Market Revenue Million Forecast, by Country 2020 & 2033
- Table 90: Global Benelux Plastic Caps and Closures Market Volume Billion Forecast, by Country 2020 & 2033
- Table 91: China Benelux Plastic Caps and Closures Market Revenue (Million) Forecast, by Application 2020 & 2033
- Table 92: China Benelux Plastic Caps and Closures Market Volume (Billion) Forecast, by Application 2020 & 2033
- Table 93: India Benelux Plastic Caps and Closures Market Revenue (Million) Forecast, by Application 2020 & 2033
- Table 94: India Benelux Plastic Caps and Closures Market Volume (Billion) Forecast, by Application 2020 & 2033
- Table 95: Japan Benelux Plastic Caps and Closures Market Revenue (Million) Forecast, by Application 2020 & 2033
- Table 96: Japan Benelux Plastic Caps and Closures Market Volume (Billion) Forecast, by Application 2020 & 2033
- Table 97: South Korea Benelux Plastic Caps and Closures Market Revenue (Million) Forecast, by Application 2020 & 2033
- Table 98: South Korea Benelux Plastic Caps and Closures Market Volume (Billion) Forecast, by Application 2020 & 2033
- Table 99: ASEAN Benelux Plastic Caps and Closures Market Revenue (Million) Forecast, by Application 2020 & 2033
- Table 100: ASEAN Benelux Plastic Caps and Closures Market Volume (Billion) Forecast, by Application 2020 & 2033
- Table 101: Oceania Benelux Plastic Caps and Closures Market Revenue (Million) Forecast, by Application 2020 & 2033
- Table 102: Oceania Benelux Plastic Caps and Closures Market Volume (Billion) Forecast, by Application 2020 & 2033
- Table 103: Rest of Asia Pacific Benelux Plastic Caps and Closures Market Revenue (Million) Forecast, by Application 2020 & 2033
- Table 104: Rest of Asia Pacific Benelux Plastic Caps and Closures Market Volume (Billion) Forecast, by Application 2020 & 2033
Frequently Asked Questions
1. What is the projected Compound Annual Growth Rate (CAGR) of the Benelux Plastic Caps and Closures Market?
The projected CAGR is approximately 3.21%.
2. Which companies are prominent players in the Benelux Plastic Caps and Closures Market?
Key companies in the market include Amcor Group GmbH, Bericap Holding GmbH, Berry Global Inc, Protective Industries Inc, Eurocap & Eurocork, Berlin Packaging Netherlands, Keizer International BV, Kornelis Caps & Closures8 2 Heat Map Analysis8 3 Competitor Analysis - Emerging vs Established Player.
3. What are the main segments of the Benelux Plastic Caps and Closures Market?
The market segments include Resin, Product Type, End-Use Industries.
4. Can you provide details about the market size?
The market size is estimated to be USD 1.39 Million as of 2022.
5. What are some drivers contributing to market growth?
Growth in the Food and Beverage Industry; Increasing Product Innovation in the Market.
6. What are the notable trends driving market growth?
Polyethylene (PE) Segment is Estimated to Have the Largest Market Share.
7. Are there any restraints impacting market growth?
Growth in the Food and Beverage Industry; Increasing Product Innovation in the Market.
8. Can you provide examples of recent developments in the market?
October 2023: Berry Global Inc., a US-based company operating in Belgium and the Netherlands, developed a lightweight tube closure, the Slimline range. The closure is available in different sizes and is manufactured using virgin polyethylene (PE) and polypropylene (PP). It can be used in a wide variety of personal care and pharmaceutical applications.
9. What pricing options are available for accessing the report?
Pricing options include single-user, multi-user, and enterprise licenses priced at USD 3800, USD 4500, and USD 5800 respectively.
10. Is the market size provided in terms of value or volume?
The market size is provided in terms of value, measured in Million and volume, measured in Billion.
11. Are there any specific market keywords associated with the report?
Yes, the market keyword associated with the report is "Benelux Plastic Caps and Closures Market," which aids in identifying and referencing the specific market segment covered.
12. How do I determine which pricing option suits my needs best?
The pricing options vary based on user requirements and access needs. Individual users may opt for single-user licenses, while businesses requiring broader access may choose multi-user or enterprise licenses for cost-effective access to the report.
13. Are there any additional resources or data provided in the Benelux Plastic Caps and Closures Market report?
While the report offers comprehensive insights, it's advisable to review the specific contents or supplementary materials provided to ascertain if additional resources or data are available.
14. How can I stay updated on further developments or reports in the Benelux Plastic Caps and Closures Market?
To stay informed about further developments, trends, and reports in the Benelux Plastic Caps and Closures Market, consider subscribing to industry newsletters, following relevant companies and organizations, or regularly checking reputable industry news sources and publications.
Methodology
Step 1 - Identification of Relevant Samples Size from Population Database


Step 2 - Approaches for Defining Global Market Size (Value, Volume* & Price*)

Note*: In applicable scenarios
Step 3 - Data Sources
Primary Research
- Web Analytics
- Survey Reports
- Research Institute
- Latest Research Reports
- Opinion Leaders
Secondary Research
- Annual Reports
- White Paper
- Latest Press Release
- Industry Association
- Paid Database
- Investor Presentations

Step 4 - Data Triangulation
Involves using different sources of information in order to increase the validity of a study
These sources are likely to be stakeholders in a program - participants, other researchers, program staff, other community members, and so on.
Then we put all data in single framework & apply various statistical tools to find out the dynamic on the market.
During the analysis stage, feedback from the stakeholder groups would be compared to determine areas of agreement as well as areas of divergence