
Key Insights
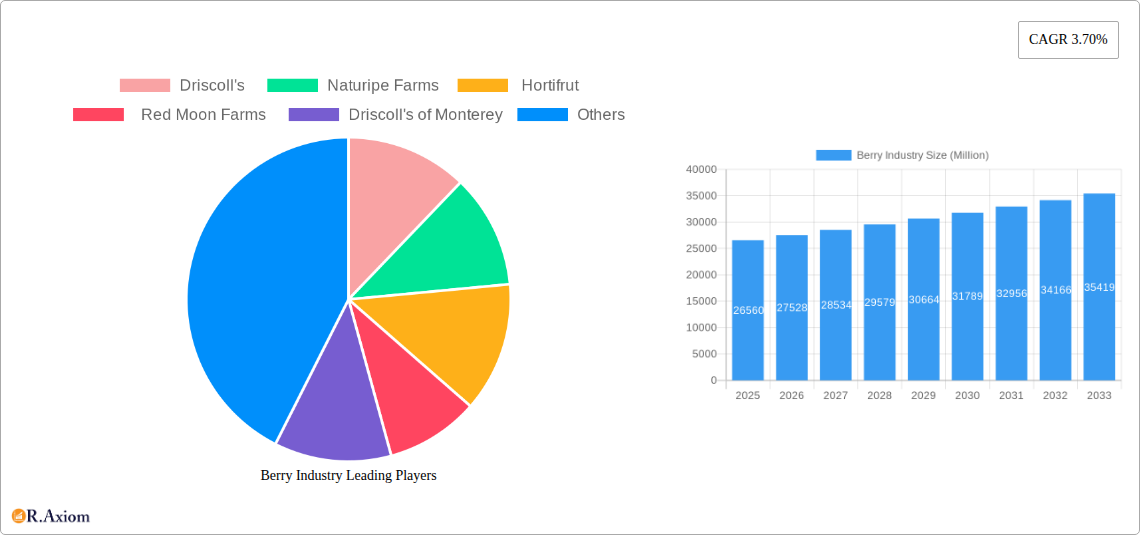
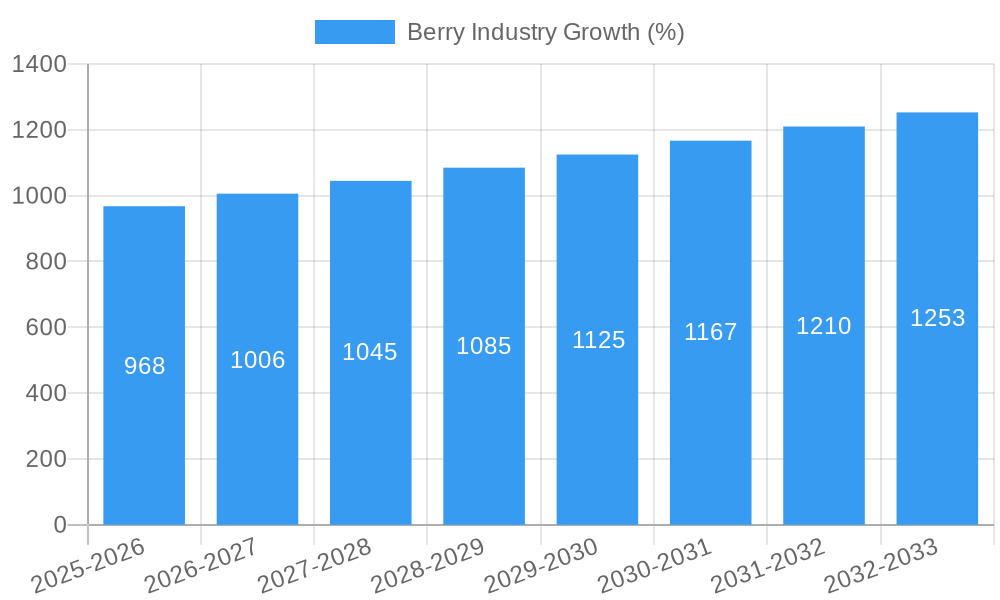
The global berry industry, valued at $26.56 billion in 2025, is projected to experience robust growth, driven by increasing consumer demand for healthy and convenient food options. The rising popularity of berries in various applications, including fresh consumption, frozen products, and processed foods and beverages, fuels market expansion. Health-conscious consumers are increasingly incorporating berries into their diets due to their high antioxidant content and nutritional benefits, bolstering demand across diverse demographics. The food and beverage industry is a major driver, with berries finding their way into juices, jams, yogurt, and other processed products. The retail sector also plays a significant role, with supermarkets and specialized stores offering a wide array of fresh, frozen, and dried berries. While challenges exist, such as seasonal variations in supply and potential price fluctuations, innovative preservation techniques like freezing and drying are mitigating these issues and expanding market reach. The industry is also witnessing a growing trend towards sustainable and ethically sourced berries, aligning with the increasing consumer preference for environmentally friendly products. Geographic expansion, particularly in developing economies with rising disposable incomes, further contributes to the growth trajectory. Market segmentation reveals strong performance across various berry types – fresh, frozen, and processed – with fresh berries maintaining the largest market share due to their superior taste and nutritional profile. Key players are focusing on product diversification, strategic partnerships, and technological advancements to maintain a competitive edge. The forecast period (2025-2033) anticipates consistent expansion, with a Compound Annual Growth Rate (CAGR) of 3.70%, further consolidating the berry industry's position within the global food market.
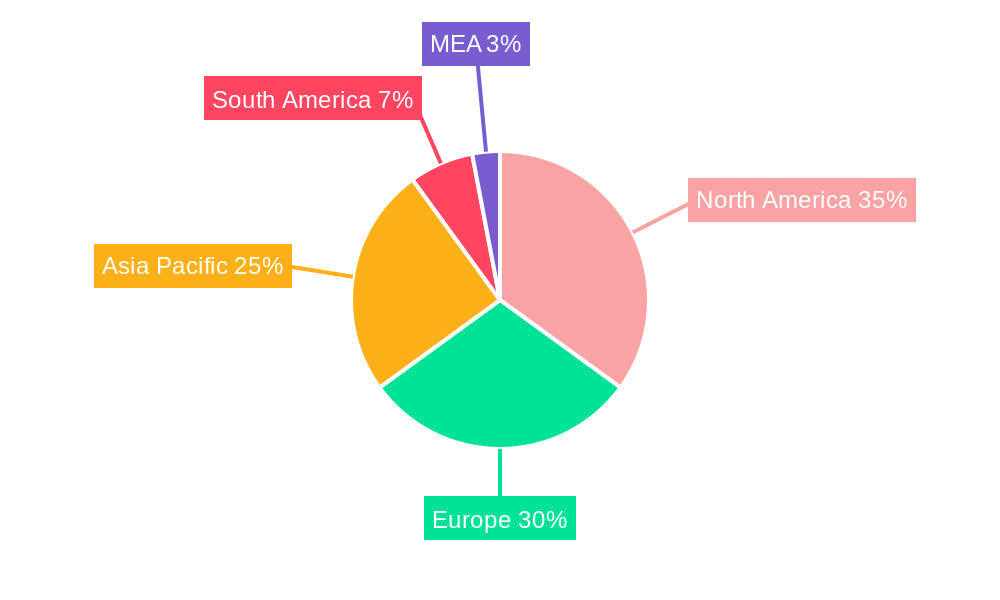
The regional landscape showcases a diverse distribution of market share, with North America and Europe currently holding significant positions. However, the Asia-Pacific region is experiencing rapid growth, driven by increased urbanization, rising middle-class incomes, and changing dietary habits. The South American and Middle Eastern & African regions also offer significant growth potential, particularly as consumer awareness of the health benefits of berries increases and distribution networks improve. Companies are actively investing in expanding their geographical footprint to capitalize on these opportunities. Further segmentation reveals strong growth in the processed berry product segment, driven by the convenience and extended shelf life offered by these products. The Healthcare sector is emerging as a significant application area, with berries utilized in nutritional supplements and functional foods, capitalizing on their health-promoting properties. Ongoing research into the health benefits of berries is further stimulating market expansion and driving innovation within the industry.
Berry Industry Market Report: 2019-2033
This comprehensive report provides a detailed analysis of the global berry industry, covering market trends, competitive dynamics, and future growth prospects from 2019 to 2033. With a focus on key players like Driscoll's, Naturipe Farms, Hortifrut, Red Moon Farms, and Driscoll's of Monterey, this report offers actionable insights for industry stakeholders. The study period is 2019-2033, with 2025 as the base and estimated year. The forecast period is 2025-2033, and the historical period is 2019-2024. Market values are expressed in Millions.
Berry Industry Market Concentration & Innovation
The global berry market is characterized by a moderate level of concentration, with a few large players dominating significant market share. Driscoll's, Naturipe Farms, and Hortifrut are among the leading companies, holding a combined xx% market share in 2024. Market concentration is influenced by factors like economies of scale in production and distribution, strong brand recognition, and access to advanced technologies. Innovation within the sector is driven by consumer demand for premium varieties, functional berries, and convenient packaging formats. This has led to significant investments in research and development, resulting in the introduction of novel berry varieties with enhanced flavor profiles, improved shelf life, and unique nutritional benefits. Regulatory frameworks regarding food safety and sustainability also play a crucial role in shaping industry practices. Product substitution, primarily from other fruits and alternative snacks, is a factor, but the berry industry's versatility and perceived health benefits mitigate this pressure. Mergers and acquisitions (M&A) activity has been moderate, with deal values averaging xx Million annually over the past five years. Key M&A activities include the xx acquisition of xx in 2023 for xx Million. End-user trends reveal a growing preference for organic, sustainably produced berries, pushing the industry towards adopting eco-friendly practices.
Berry Industry Industry Trends & Insights
The global berry market is experiencing robust growth, driven primarily by rising consumer awareness of the health benefits associated with berry consumption. The increasing demand for convenient and ready-to-eat snacks is further fueling market expansion. The CAGR for the global berry market from 2019 to 2024 is estimated to be xx%, reaching a market size of xx Million. Market penetration of organic and sustainably produced berries is also increasing, reaching approximately xx% in 2024. Technological advancements, particularly in precision agriculture and automated harvesting techniques, are enhancing productivity and reducing production costs. Consumer preferences are shifting towards premium and exotic berry varieties, influencing product development strategies. The competitive landscape is dynamic, with existing players focusing on product diversification, brand building, and strategic partnerships to maintain their market positions. Emerging players are leveraging innovation and niche market targeting to capture market share.
Dominant Markets & Segments in Berry Industry
- Leading Region: North America currently holds the largest market share, driven by high consumption rates and established production infrastructure.
- Leading Country: The United States holds the largest market share among individual countries due to its expansive berry farming industry and high demand.
- Leading Type: Fresh berries constitute the largest segment by value, owing to their popularity and widespread consumption.
- Leading Application: The food and beverage industry accounts for the largest share of berry consumption, followed by the retail sector. Healthcare's growing use of berries is a significant emerging segment.
Key Drivers for Dominance:
- North America: Established production infrastructure, high disposable incomes, and strong consumer demand for berries.
- United States: Large-scale farming operations, advanced processing technologies, and robust distribution networks.
- Fresh Berries: Superior taste, convenience, and perceived freshness compared to processed alternatives.
- Food and Beverage Industry: Extensive use of berries as ingredients in a wide range of food products.
The dominance of these segments is projected to continue over the forecast period, though the frozen and processed berry segments are expected to witness strong growth due to their extended shelf-life and convenience.
Berry Industry Product Developments
Recent years have witnessed significant innovations in the berry industry, driven by consumer demand for enhanced taste, convenience, and functional attributes. Companies are introducing new berry varieties with improved flavor profiles and higher nutritional content. Technological advancements in processing and packaging are extending shelf life and preserving berry quality. The trend towards organic and sustainably produced berries is influencing product development, with an increasing number of companies offering certified organic berry products. These developments are enhancing the competitive advantage of innovative players and expanding market access for berry products.
Report Scope & Segmentation Analysis
This report segments the berry market based on Type (Fresh Berries, Frozen Berries, Dried Berries, Processed Berry Products) and Application (Food and Beverage Industry, Retail, Healthcare). Each segment's market size, growth projections, and competitive dynamics are thoroughly examined. For instance, the fresh berries segment is expected to witness steady growth, while the frozen and processed segments are projected to experience higher growth rates due to convenience and extended shelf life. The food and beverage industry segment dominates the application-based segmentation, however, the healthcare sector is emerging as a substantial growth driver. Specific market sizes for each segment are detailed in the full report.
Key Drivers of Berry Industry Growth
The berry industry's growth is propelled by several factors: growing consumer preference for healthy and nutritious snacks, increasing demand for convenient food options, and the continuous development of new and improved berry varieties. Technological advancements in agriculture and processing are boosting productivity and efficiency. Furthermore, favorable government regulations supporting the berry industry are encouraging investment and expansion.
Challenges in the Berry Industry Sector
The berry industry faces several challenges: weather-related risks impacting yields, fluctuating input costs, and intense competition from other fruit and snack alternatives. Supply chain disruptions and labor shortages can affect production and distribution. Strict food safety regulations require substantial investments in compliance. The impact of these factors on profitability and market growth is analyzed within the complete report.
Emerging Opportunities in Berry Industry
Significant opportunities exist for growth within the berry industry: the increasing demand for organic and sustainably produced berries presents a viable market segment. Expansion into new markets, particularly in developing countries with rising incomes, offers substantial potential. The development of innovative berry-based products with added functional benefits can generate substantial growth. These opportunities necessitate strategic investments in research, development, and sustainable production practices.
Leading Players in the Berry Industry Market
- Driscoll's
- Naturipe Farms
- Hortifrut
- Red Moon Farms
- Driscoll's of Monterey
Key Developments in Berry Industry Industry
- October 2023: Naturipe Farms launched the “Sweet Selections” premium berries line, featuring proprietary high-flavor varieties. This launch strengthens Naturipe's position in the premium berry segment and is expected to increase its market share.
- May 2022: Driscoll's launched Tropical Bliss, a new premium strawberry line, expanding its high-flavor offerings. This expands Driscoll's product portfolio and caters to the growing demand for premium berry products.
Strategic Outlook for Berry Industry Market
The berry industry is poised for continued growth, driven by favorable consumer trends, technological advancements, and emerging market opportunities. Strategic investments in sustainable practices, product innovation, and efficient supply chains are crucial for success. Focus on premiumization and functional berry products will be key drivers of future market expansion. The projected growth trajectory suggests a promising outlook for industry players that adapt to evolving consumer preferences and market dynamics.
Berry Industry Segmentation
- 1. Production Analysis
- 2. Consumption Analysis
- 3. Import Market Analysis (Value & Volume)
- 4. Export Market Analysis (Value & Volume)
- 5. Price Trend Analysis
Berry Industry Segmentation By Geography
-
1. North America
- 1.1. United States
- 1.2. Canada
-
2. Europe
- 2.1. Germany
- 2.2. United Kingdom
- 2.3. France
- 2.4. Spain
- 2.5. Netherlands
- 2.6. Poland
-
3. Asia Pacific
- 3.1. China
- 3.2. Australia
- 3.3. India
- 3.4. Japan
-
4. South America
- 4.1. Brazil
- 4.2. Argentina
-
5. Africa
- 5.1. South Africa
- 5.2. Egypt
Berry Industry REPORT HIGHLIGHTS
| Aspects | Details |
|---|---|
| Study Period | 2019-2033 |
| Base Year | 2024 |
| Estimated Year | 2025 |
| Forecast Period | 2025-2033 |
| Historical Period | 2019-2024 |
| Growth Rate | CAGR of 3.70% from 2019-2033 |
| Segmentation |
|
Table of Contents
- 1. Introduction
- 1.1. Research Scope
- 1.2. Market Segmentation
- 1.3. Research Methodology
- 1.4. Definitions and Assumptions
- 2. Executive Summary
- 2.1. Introduction
- 3. Market Dynamics
- 3.1. Introduction
- 3.2. Market Drivers
- 3.2.1. Increasing Berry Consumption for Health Benefits; Increasing Adoption of High-Technology Farm Practices; Growing Usage of Berries in the Food and Beverage Industries
- 3.3. Market Restrains
- 3.3.1. High Production Cost Involved in Berry Production; Increasing Disease and Pest Infestations
- 3.4. Market Trends
- 3.4.1. Increasing Export of Berries from United States is Driving the Market
- 4. Market Factor Analysis
- 4.1. Porters Five Forces
- 4.2. Supply/Value Chain
- 4.3. PESTEL analysis
- 4.4. Market Entropy
- 4.5. Patent/Trademark Analysis
- 5. Global Berry Industry Analysis, Insights and Forecast, 2019-2031
- 5.1. Market Analysis, Insights and Forecast - by Production Analysis
- 5.2. Market Analysis, Insights and Forecast - by Consumption Analysis
- 5.3. Market Analysis, Insights and Forecast - by Import Market Analysis (Value & Volume)
- 5.4. Market Analysis, Insights and Forecast - by Export Market Analysis (Value & Volume)
- 5.5. Market Analysis, Insights and Forecast - by Price Trend Analysis
- 5.6. Market Analysis, Insights and Forecast - by Region
- 5.6.1. North America
- 5.6.2. Europe
- 5.6.3. Asia Pacific
- 5.6.4. South America
- 5.6.5. Africa
- 5.1. Market Analysis, Insights and Forecast - by Production Analysis
- 6. North America Berry Industry Analysis, Insights and Forecast, 2019-2031
- 6.1. Market Analysis, Insights and Forecast - by Production Analysis
- 6.2. Market Analysis, Insights and Forecast - by Consumption Analysis
- 6.3. Market Analysis, Insights and Forecast - by Import Market Analysis (Value & Volume)
- 6.4. Market Analysis, Insights and Forecast - by Export Market Analysis (Value & Volume)
- 6.5. Market Analysis, Insights and Forecast - by Price Trend Analysis
- 6.1. Market Analysis, Insights and Forecast - by Production Analysis
- 7. Europe Berry Industry Analysis, Insights and Forecast, 2019-2031
- 7.1. Market Analysis, Insights and Forecast - by Production Analysis
- 7.2. Market Analysis, Insights and Forecast - by Consumption Analysis
- 7.3. Market Analysis, Insights and Forecast - by Import Market Analysis (Value & Volume)
- 7.4. Market Analysis, Insights and Forecast - by Export Market Analysis (Value & Volume)
- 7.5. Market Analysis, Insights and Forecast - by Price Trend Analysis
- 7.1. Market Analysis, Insights and Forecast - by Production Analysis
- 8. Asia Pacific Berry Industry Analysis, Insights and Forecast, 2019-2031
- 8.1. Market Analysis, Insights and Forecast - by Production Analysis
- 8.2. Market Analysis, Insights and Forecast - by Consumption Analysis
- 8.3. Market Analysis, Insights and Forecast - by Import Market Analysis (Value & Volume)
- 8.4. Market Analysis, Insights and Forecast - by Export Market Analysis (Value & Volume)
- 8.5. Market Analysis, Insights and Forecast - by Price Trend Analysis
- 8.1. Market Analysis, Insights and Forecast - by Production Analysis
- 9. South America Berry Industry Analysis, Insights and Forecast, 2019-2031
- 9.1. Market Analysis, Insights and Forecast - by Production Analysis
- 9.2. Market Analysis, Insights and Forecast - by Consumption Analysis
- 9.3. Market Analysis, Insights and Forecast - by Import Market Analysis (Value & Volume)
- 9.4. Market Analysis, Insights and Forecast - by Export Market Analysis (Value & Volume)
- 9.5. Market Analysis, Insights and Forecast - by Price Trend Analysis
- 9.1. Market Analysis, Insights and Forecast - by Production Analysis
- 10. Africa Berry Industry Analysis, Insights and Forecast, 2019-2031
- 10.1. Market Analysis, Insights and Forecast - by Production Analysis
- 10.2. Market Analysis, Insights and Forecast - by Consumption Analysis
- 10.3. Market Analysis, Insights and Forecast - by Import Market Analysis (Value & Volume)
- 10.4. Market Analysis, Insights and Forecast - by Export Market Analysis (Value & Volume)
- 10.5. Market Analysis, Insights and Forecast - by Price Trend Analysis
- 10.1. Market Analysis, Insights and Forecast - by Production Analysis
- 11. North America Berry Industry Analysis, Insights and Forecast, 2019-2031
- 11.1. Market Analysis, Insights and Forecast - By Country/Sub-region
- 11.1.1 United States
- 11.1.2 Canada
- 11.1.3 Mexico
- 12. Europe Berry Industry Analysis, Insights and Forecast, 2019-2031
- 12.1. Market Analysis, Insights and Forecast - By Country/Sub-region
- 12.1.1 Germany
- 12.1.2 United Kingdom
- 12.1.3 France
- 12.1.4 Spain
- 12.1.5 Italy
- 12.1.6 Spain
- 12.1.7 Belgium
- 12.1.8 Netherland
- 12.1.9 Nordics
- 12.1.10 Rest of Europe
- 13. Asia Pacific Berry Industry Analysis, Insights and Forecast, 2019-2031
- 13.1. Market Analysis, Insights and Forecast - By Country/Sub-region
- 13.1.1 China
- 13.1.2 Japan
- 13.1.3 India
- 13.1.4 South Korea
- 13.1.5 Southeast Asia
- 13.1.6 Australia
- 13.1.7 Indonesia
- 13.1.8 Phillipes
- 13.1.9 Singapore
- 13.1.10 Thailandc
- 13.1.11 Rest of Asia Pacific
- 14. South America Berry Industry Analysis, Insights and Forecast, 2019-2031
- 14.1. Market Analysis, Insights and Forecast - By Country/Sub-region
- 14.1.1 Brazil
- 14.1.2 Argentina
- 14.1.3 Peru
- 14.1.4 Chile
- 14.1.5 Colombia
- 14.1.6 Ecuador
- 14.1.7 Venezuela
- 14.1.8 Rest of South America
- 15. MEA Berry Industry Analysis, Insights and Forecast, 2019-2031
- 15.1. Market Analysis, Insights and Forecast - By Country/Sub-region
- 15.1.1 United Arab Emirates
- 15.1.2 Saudi Arabia
- 15.1.3 South Africa
- 15.1.4 Rest of Middle East and Africa
- 16. Competitive Analysis
- 16.1. Global Market Share Analysis 2024
- 16.2. Company Profiles
- 16.2.1 Driscoll's
- 16.2.1.1. Overview
- 16.2.1.2. Products
- 16.2.1.3. SWOT Analysis
- 16.2.1.4. Recent Developments
- 16.2.1.5. Financials (Based on Availability)
- 16.2.2 Naturipe Farms
- 16.2.2.1. Overview
- 16.2.2.2. Products
- 16.2.2.3. SWOT Analysis
- 16.2.2.4. Recent Developments
- 16.2.2.5. Financials (Based on Availability)
- 16.2.3 Hortifrut
- 16.2.3.1. Overview
- 16.2.3.2. Products
- 16.2.3.3. SWOT Analysis
- 16.2.3.4. Recent Developments
- 16.2.3.5. Financials (Based on Availability)
- 16.2.4 Red Moon Farms
- 16.2.4.1. Overview
- 16.2.4.2. Products
- 16.2.4.3. SWOT Analysis
- 16.2.4.4. Recent Developments
- 16.2.4.5. Financials (Based on Availability)
- 16.2.5 Driscoll's of Monterey
- 16.2.5.1. Overview
- 16.2.5.2. Products
- 16.2.5.3. SWOT Analysis
- 16.2.5.4. Recent Developments
- 16.2.5.5. Financials (Based on Availability)
- 16.2.1 Driscoll's
List of Figures
- Figure 1: Global Berry Industry Revenue Breakdown (Million, %) by Region 2024 & 2032
- Figure 2: North America Berry Industry Revenue (Million), by Country 2024 & 2032
- Figure 3: North America Berry Industry Revenue Share (%), by Country 2024 & 2032
- Figure 4: Europe Berry Industry Revenue (Million), by Country 2024 & 2032
- Figure 5: Europe Berry Industry Revenue Share (%), by Country 2024 & 2032
- Figure 6: Asia Pacific Berry Industry Revenue (Million), by Country 2024 & 2032
- Figure 7: Asia Pacific Berry Industry Revenue Share (%), by Country 2024 & 2032
- Figure 8: South America Berry Industry Revenue (Million), by Country 2024 & 2032
- Figure 9: South America Berry Industry Revenue Share (%), by Country 2024 & 2032
- Figure 10: MEA Berry Industry Revenue (Million), by Country 2024 & 2032
- Figure 11: MEA Berry Industry Revenue Share (%), by Country 2024 & 2032
- Figure 12: North America Berry Industry Revenue (Million), by Production Analysis 2024 & 2032
- Figure 13: North America Berry Industry Revenue Share (%), by Production Analysis 2024 & 2032
- Figure 14: North America Berry Industry Revenue (Million), by Consumption Analysis 2024 & 2032
- Figure 15: North America Berry Industry Revenue Share (%), by Consumption Analysis 2024 & 2032
- Figure 16: North America Berry Industry Revenue (Million), by Import Market Analysis (Value & Volume) 2024 & 2032
- Figure 17: North America Berry Industry Revenue Share (%), by Import Market Analysis (Value & Volume) 2024 & 2032
- Figure 18: North America Berry Industry Revenue (Million), by Export Market Analysis (Value & Volume) 2024 & 2032
- Figure 19: North America Berry Industry Revenue Share (%), by Export Market Analysis (Value & Volume) 2024 & 2032
- Figure 20: North America Berry Industry Revenue (Million), by Price Trend Analysis 2024 & 2032
- Figure 21: North America Berry Industry Revenue Share (%), by Price Trend Analysis 2024 & 2032
- Figure 22: North America Berry Industry Revenue (Million), by Country 2024 & 2032
- Figure 23: North America Berry Industry Revenue Share (%), by Country 2024 & 2032
- Figure 24: Europe Berry Industry Revenue (Million), by Production Analysis 2024 & 2032
- Figure 25: Europe Berry Industry Revenue Share (%), by Production Analysis 2024 & 2032
- Figure 26: Europe Berry Industry Revenue (Million), by Consumption Analysis 2024 & 2032
- Figure 27: Europe Berry Industry Revenue Share (%), by Consumption Analysis 2024 & 2032
- Figure 28: Europe Berry Industry Revenue (Million), by Import Market Analysis (Value & Volume) 2024 & 2032
- Figure 29: Europe Berry Industry Revenue Share (%), by Import Market Analysis (Value & Volume) 2024 & 2032
- Figure 30: Europe Berry Industry Revenue (Million), by Export Market Analysis (Value & Volume) 2024 & 2032
- Figure 31: Europe Berry Industry Revenue Share (%), by Export Market Analysis (Value & Volume) 2024 & 2032
- Figure 32: Europe Berry Industry Revenue (Million), by Price Trend Analysis 2024 & 2032
- Figure 33: Europe Berry Industry Revenue Share (%), by Price Trend Analysis 2024 & 2032
- Figure 34: Europe Berry Industry Revenue (Million), by Country 2024 & 2032
- Figure 35: Europe Berry Industry Revenue Share (%), by Country 2024 & 2032
- Figure 36: Asia Pacific Berry Industry Revenue (Million), by Production Analysis 2024 & 2032
- Figure 37: Asia Pacific Berry Industry Revenue Share (%), by Production Analysis 2024 & 2032
- Figure 38: Asia Pacific Berry Industry Revenue (Million), by Consumption Analysis 2024 & 2032
- Figure 39: Asia Pacific Berry Industry Revenue Share (%), by Consumption Analysis 2024 & 2032
- Figure 40: Asia Pacific Berry Industry Revenue (Million), by Import Market Analysis (Value & Volume) 2024 & 2032
- Figure 41: Asia Pacific Berry Industry Revenue Share (%), by Import Market Analysis (Value & Volume) 2024 & 2032
- Figure 42: Asia Pacific Berry Industry Revenue (Million), by Export Market Analysis (Value & Volume) 2024 & 2032
- Figure 43: Asia Pacific Berry Industry Revenue Share (%), by Export Market Analysis (Value & Volume) 2024 & 2032
- Figure 44: Asia Pacific Berry Industry Revenue (Million), by Price Trend Analysis 2024 & 2032
- Figure 45: Asia Pacific Berry Industry Revenue Share (%), by Price Trend Analysis 2024 & 2032
- Figure 46: Asia Pacific Berry Industry Revenue (Million), by Country 2024 & 2032
- Figure 47: Asia Pacific Berry Industry Revenue Share (%), by Country 2024 & 2032
- Figure 48: South America Berry Industry Revenue (Million), by Production Analysis 2024 & 2032
- Figure 49: South America Berry Industry Revenue Share (%), by Production Analysis 2024 & 2032
- Figure 50: South America Berry Industry Revenue (Million), by Consumption Analysis 2024 & 2032
- Figure 51: South America Berry Industry Revenue Share (%), by Consumption Analysis 2024 & 2032
- Figure 52: South America Berry Industry Revenue (Million), by Import Market Analysis (Value & Volume) 2024 & 2032
- Figure 53: South America Berry Industry Revenue Share (%), by Import Market Analysis (Value & Volume) 2024 & 2032
- Figure 54: South America Berry Industry Revenue (Million), by Export Market Analysis (Value & Volume) 2024 & 2032
- Figure 55: South America Berry Industry Revenue Share (%), by Export Market Analysis (Value & Volume) 2024 & 2032
- Figure 56: South America Berry Industry Revenue (Million), by Price Trend Analysis 2024 & 2032
- Figure 57: South America Berry Industry Revenue Share (%), by Price Trend Analysis 2024 & 2032
- Figure 58: South America Berry Industry Revenue (Million), by Country 2024 & 2032
- Figure 59: South America Berry Industry Revenue Share (%), by Country 2024 & 2032
- Figure 60: Africa Berry Industry Revenue (Million), by Production Analysis 2024 & 2032
- Figure 61: Africa Berry Industry Revenue Share (%), by Production Analysis 2024 & 2032
- Figure 62: Africa Berry Industry Revenue (Million), by Consumption Analysis 2024 & 2032
- Figure 63: Africa Berry Industry Revenue Share (%), by Consumption Analysis 2024 & 2032
- Figure 64: Africa Berry Industry Revenue (Million), by Import Market Analysis (Value & Volume) 2024 & 2032
- Figure 65: Africa Berry Industry Revenue Share (%), by Import Market Analysis (Value & Volume) 2024 & 2032
- Figure 66: Africa Berry Industry Revenue (Million), by Export Market Analysis (Value & Volume) 2024 & 2032
- Figure 67: Africa Berry Industry Revenue Share (%), by Export Market Analysis (Value & Volume) 2024 & 2032
- Figure 68: Africa Berry Industry Revenue (Million), by Price Trend Analysis 2024 & 2032
- Figure 69: Africa Berry Industry Revenue Share (%), by Price Trend Analysis 2024 & 2032
- Figure 70: Africa Berry Industry Revenue (Million), by Country 2024 & 2032
- Figure 71: Africa Berry Industry Revenue Share (%), by Country 2024 & 2032
List of Tables
- Table 1: Global Berry Industry Revenue Million Forecast, by Region 2019 & 2032
- Table 2: Global Berry Industry Revenue Million Forecast, by Production Analysis 2019 & 2032
- Table 3: Global Berry Industry Revenue Million Forecast, by Consumption Analysis 2019 & 2032
- Table 4: Global Berry Industry Revenue Million Forecast, by Import Market Analysis (Value & Volume) 2019 & 2032
- Table 5: Global Berry Industry Revenue Million Forecast, by Export Market Analysis (Value & Volume) 2019 & 2032
- Table 6: Global Berry Industry Revenue Million Forecast, by Price Trend Analysis 2019 & 2032
- Table 7: Global Berry Industry Revenue Million Forecast, by Region 2019 & 2032
- Table 8: Global Berry Industry Revenue Million Forecast, by Country 2019 & 2032
- Table 9: United States Berry Industry Revenue (Million) Forecast, by Application 2019 & 2032
- Table 10: Canada Berry Industry Revenue (Million) Forecast, by Application 2019 & 2032
- Table 11: Mexico Berry Industry Revenue (Million) Forecast, by Application 2019 & 2032
- Table 12: Global Berry Industry Revenue Million Forecast, by Country 2019 & 2032
- Table 13: Germany Berry Industry Revenue (Million) Forecast, by Application 2019 & 2032
- Table 14: United Kingdom Berry Industry Revenue (Million) Forecast, by Application 2019 & 2032
- Table 15: France Berry Industry Revenue (Million) Forecast, by Application 2019 & 2032
- Table 16: Spain Berry Industry Revenue (Million) Forecast, by Application 2019 & 2032
- Table 17: Italy Berry Industry Revenue (Million) Forecast, by Application 2019 & 2032
- Table 18: Spain Berry Industry Revenue (Million) Forecast, by Application 2019 & 2032
- Table 19: Belgium Berry Industry Revenue (Million) Forecast, by Application 2019 & 2032
- Table 20: Netherland Berry Industry Revenue (Million) Forecast, by Application 2019 & 2032
- Table 21: Nordics Berry Industry Revenue (Million) Forecast, by Application 2019 & 2032
- Table 22: Rest of Europe Berry Industry Revenue (Million) Forecast, by Application 2019 & 2032
- Table 23: Global Berry Industry Revenue Million Forecast, by Country 2019 & 2032
- Table 24: China Berry Industry Revenue (Million) Forecast, by Application 2019 & 2032
- Table 25: Japan Berry Industry Revenue (Million) Forecast, by Application 2019 & 2032
- Table 26: India Berry Industry Revenue (Million) Forecast, by Application 2019 & 2032
- Table 27: South Korea Berry Industry Revenue (Million) Forecast, by Application 2019 & 2032
- Table 28: Southeast Asia Berry Industry Revenue (Million) Forecast, by Application 2019 & 2032
- Table 29: Australia Berry Industry Revenue (Million) Forecast, by Application 2019 & 2032
- Table 30: Indonesia Berry Industry Revenue (Million) Forecast, by Application 2019 & 2032
- Table 31: Phillipes Berry Industry Revenue (Million) Forecast, by Application 2019 & 2032
- Table 32: Singapore Berry Industry Revenue (Million) Forecast, by Application 2019 & 2032
- Table 33: Thailandc Berry Industry Revenue (Million) Forecast, by Application 2019 & 2032
- Table 34: Rest of Asia Pacific Berry Industry Revenue (Million) Forecast, by Application 2019 & 2032
- Table 35: Global Berry Industry Revenue Million Forecast, by Country 2019 & 2032
- Table 36: Brazil Berry Industry Revenue (Million) Forecast, by Application 2019 & 2032
- Table 37: Argentina Berry Industry Revenue (Million) Forecast, by Application 2019 & 2032
- Table 38: Peru Berry Industry Revenue (Million) Forecast, by Application 2019 & 2032
- Table 39: Chile Berry Industry Revenue (Million) Forecast, by Application 2019 & 2032
- Table 40: Colombia Berry Industry Revenue (Million) Forecast, by Application 2019 & 2032
- Table 41: Ecuador Berry Industry Revenue (Million) Forecast, by Application 2019 & 2032
- Table 42: Venezuela Berry Industry Revenue (Million) Forecast, by Application 2019 & 2032
- Table 43: Rest of South America Berry Industry Revenue (Million) Forecast, by Application 2019 & 2032
- Table 44: Global Berry Industry Revenue Million Forecast, by Country 2019 & 2032
- Table 45: United Arab Emirates Berry Industry Revenue (Million) Forecast, by Application 2019 & 2032
- Table 46: Saudi Arabia Berry Industry Revenue (Million) Forecast, by Application 2019 & 2032
- Table 47: South Africa Berry Industry Revenue (Million) Forecast, by Application 2019 & 2032
- Table 48: Rest of Middle East and Africa Berry Industry Revenue (Million) Forecast, by Application 2019 & 2032
- Table 49: Global Berry Industry Revenue Million Forecast, by Production Analysis 2019 & 2032
- Table 50: Global Berry Industry Revenue Million Forecast, by Consumption Analysis 2019 & 2032
- Table 51: Global Berry Industry Revenue Million Forecast, by Import Market Analysis (Value & Volume) 2019 & 2032
- Table 52: Global Berry Industry Revenue Million Forecast, by Export Market Analysis (Value & Volume) 2019 & 2032
- Table 53: Global Berry Industry Revenue Million Forecast, by Price Trend Analysis 2019 & 2032
- Table 54: Global Berry Industry Revenue Million Forecast, by Country 2019 & 2032
- Table 55: United States Berry Industry Revenue (Million) Forecast, by Application 2019 & 2032
- Table 56: Canada Berry Industry Revenue (Million) Forecast, by Application 2019 & 2032
- Table 57: Global Berry Industry Revenue Million Forecast, by Production Analysis 2019 & 2032
- Table 58: Global Berry Industry Revenue Million Forecast, by Consumption Analysis 2019 & 2032
- Table 59: Global Berry Industry Revenue Million Forecast, by Import Market Analysis (Value & Volume) 2019 & 2032
- Table 60: Global Berry Industry Revenue Million Forecast, by Export Market Analysis (Value & Volume) 2019 & 2032
- Table 61: Global Berry Industry Revenue Million Forecast, by Price Trend Analysis 2019 & 2032
- Table 62: Global Berry Industry Revenue Million Forecast, by Country 2019 & 2032
- Table 63: Germany Berry Industry Revenue (Million) Forecast, by Application 2019 & 2032
- Table 64: United Kingdom Berry Industry Revenue (Million) Forecast, by Application 2019 & 2032
- Table 65: France Berry Industry Revenue (Million) Forecast, by Application 2019 & 2032
- Table 66: Spain Berry Industry Revenue (Million) Forecast, by Application 2019 & 2032
- Table 67: Netherlands Berry Industry Revenue (Million) Forecast, by Application 2019 & 2032
- Table 68: Poland Berry Industry Revenue (Million) Forecast, by Application 2019 & 2032
- Table 69: Global Berry Industry Revenue Million Forecast, by Production Analysis 2019 & 2032
- Table 70: Global Berry Industry Revenue Million Forecast, by Consumption Analysis 2019 & 2032
- Table 71: Global Berry Industry Revenue Million Forecast, by Import Market Analysis (Value & Volume) 2019 & 2032
- Table 72: Global Berry Industry Revenue Million Forecast, by Export Market Analysis (Value & Volume) 2019 & 2032
- Table 73: Global Berry Industry Revenue Million Forecast, by Price Trend Analysis 2019 & 2032
- Table 74: Global Berry Industry Revenue Million Forecast, by Country 2019 & 2032
- Table 75: China Berry Industry Revenue (Million) Forecast, by Application 2019 & 2032
- Table 76: Australia Berry Industry Revenue (Million) Forecast, by Application 2019 & 2032
- Table 77: India Berry Industry Revenue (Million) Forecast, by Application 2019 & 2032
- Table 78: Japan Berry Industry Revenue (Million) Forecast, by Application 2019 & 2032
- Table 79: Global Berry Industry Revenue Million Forecast, by Production Analysis 2019 & 2032
- Table 80: Global Berry Industry Revenue Million Forecast, by Consumption Analysis 2019 & 2032
- Table 81: Global Berry Industry Revenue Million Forecast, by Import Market Analysis (Value & Volume) 2019 & 2032
- Table 82: Global Berry Industry Revenue Million Forecast, by Export Market Analysis (Value & Volume) 2019 & 2032
- Table 83: Global Berry Industry Revenue Million Forecast, by Price Trend Analysis 2019 & 2032
- Table 84: Global Berry Industry Revenue Million Forecast, by Country 2019 & 2032
- Table 85: Brazil Berry Industry Revenue (Million) Forecast, by Application 2019 & 2032
- Table 86: Argentina Berry Industry Revenue (Million) Forecast, by Application 2019 & 2032
- Table 87: Global Berry Industry Revenue Million Forecast, by Production Analysis 2019 & 2032
- Table 88: Global Berry Industry Revenue Million Forecast, by Consumption Analysis 2019 & 2032
- Table 89: Global Berry Industry Revenue Million Forecast, by Import Market Analysis (Value & Volume) 2019 & 2032
- Table 90: Global Berry Industry Revenue Million Forecast, by Export Market Analysis (Value & Volume) 2019 & 2032
- Table 91: Global Berry Industry Revenue Million Forecast, by Price Trend Analysis 2019 & 2032
- Table 92: Global Berry Industry Revenue Million Forecast, by Country 2019 & 2032
- Table 93: South Africa Berry Industry Revenue (Million) Forecast, by Application 2019 & 2032
- Table 94: Egypt Berry Industry Revenue (Million) Forecast, by Application 2019 & 2032
Frequently Asked Questions
1. What is the projected Compound Annual Growth Rate (CAGR) of the Berry Industry?
The projected CAGR is approximately 3.70%.
2. Which companies are prominent players in the Berry Industry?
Key companies in the market include Driscoll's , Naturipe Farms , Hortifrut, Red Moon Farms , Driscoll's of Monterey.
3. What are the main segments of the Berry Industry?
The market segments include Production Analysis, Consumption Analysis, Import Market Analysis (Value & Volume), Export Market Analysis (Value & Volume), Price Trend Analysis.
4. Can you provide details about the market size?
The market size is estimated to be USD 26.56 Million as of 2022.
5. What are some drivers contributing to market growth?
Increasing Berry Consumption for Health Benefits; Increasing Adoption of High-Technology Farm Practices; Growing Usage of Berries in the Food and Beverage Industries.
6. What are the notable trends driving market growth?
Increasing Export of Berries from United States is Driving the Market.
7. Are there any restraints impacting market growth?
High Production Cost Involved in Berry Production; Increasing Disease and Pest Infestations.
8. Can you provide examples of recent developments in the market?
October 2023: Naturipe Farms has launched the “Sweet Selections” premium berries line. The Sweet Selections line featured Naturipe’s proprietary berry varieties that were meticulously bred and selected for high flavor and overall eating experience.
9. What pricing options are available for accessing the report?
Pricing options include single-user, multi-user, and enterprise licenses priced at USD 4750, USD 5250, and USD 8750 respectively.
10. Is the market size provided in terms of value or volume?
The market size is provided in terms of value, measured in Million.
11. Are there any specific market keywords associated with the report?
Yes, the market keyword associated with the report is "Berry Industry," which aids in identifying and referencing the specific market segment covered.
12. How do I determine which pricing option suits my needs best?
The pricing options vary based on user requirements and access needs. Individual users may opt for single-user licenses, while businesses requiring broader access may choose multi-user or enterprise licenses for cost-effective access to the report.
13. Are there any additional resources or data provided in the Berry Industry report?
While the report offers comprehensive insights, it's advisable to review the specific contents or supplementary materials provided to ascertain if additional resources or data are available.
14. How can I stay updated on further developments or reports in the Berry Industry?
To stay informed about further developments, trends, and reports in the Berry Industry, consider subscribing to industry newsletters, following relevant companies and organizations, or regularly checking reputable industry news sources and publications.
Methodology
Step 1 - Identification of Relevant Samples Size from Population Database


Step 2 - Approaches for Defining Global Market Size (Value, Volume* & Price*)

Note*: In applicable scenarios
Step 3 - Data Sources
Primary Research
- Web Analytics
- Survey Reports
- Research Institute
- Latest Research Reports
- Opinion Leaders
Secondary Research
- Annual Reports
- White Paper
- Latest Press Release
- Industry Association
- Paid Database
- Investor Presentations

Step 4 - Data Triangulation
Involves using different sources of information in order to increase the validity of a study
These sources are likely to be stakeholders in a program - participants, other researchers, program staff, other community members, and so on.
Then we put all data in single framework & apply various statistical tools to find out the dynamic on the market.
During the analysis stage, feedback from the stakeholder groups would be compared to determine areas of agreement as well as areas of divergence


