

Key Insights
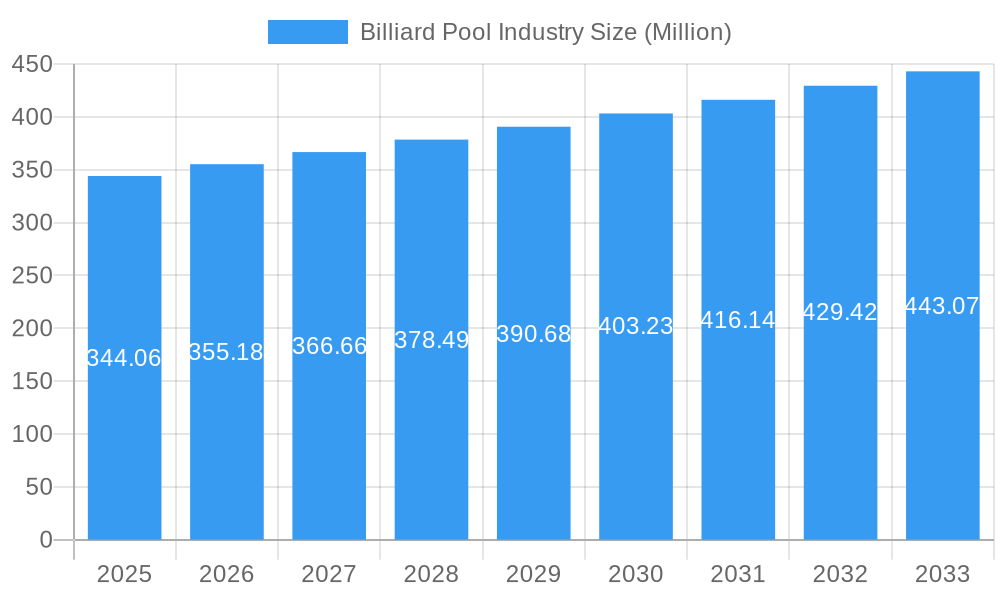
The global billiard and pool industry, currently valued at $344.06 million in 2025, is projected to experience steady growth, with a Compound Annual Growth Rate (CAGR) of 2.93% from 2025 to 2033. This growth is driven by several factors. Rising disposable incomes in emerging economies are fueling increased participation in recreational activities like billiards and pool. The industry is also benefiting from a renewed interest in classic games, particularly among younger demographics, who are drawn to the social aspect and competitive nature of the sport. Technological advancements, such as improved table designs and cue technology, are enhancing the playing experience, further driving market expansion. The increasing popularity of professional billiard tournaments and online gaming platforms is also contributing to the overall growth of the industry. However, the market faces certain challenges, including the high initial investment cost associated with purchasing equipment, which can act as a barrier to entry for some consumers. Competition from other recreational activities and the fluctuating costs of raw materials also pose constraints to market expansion.
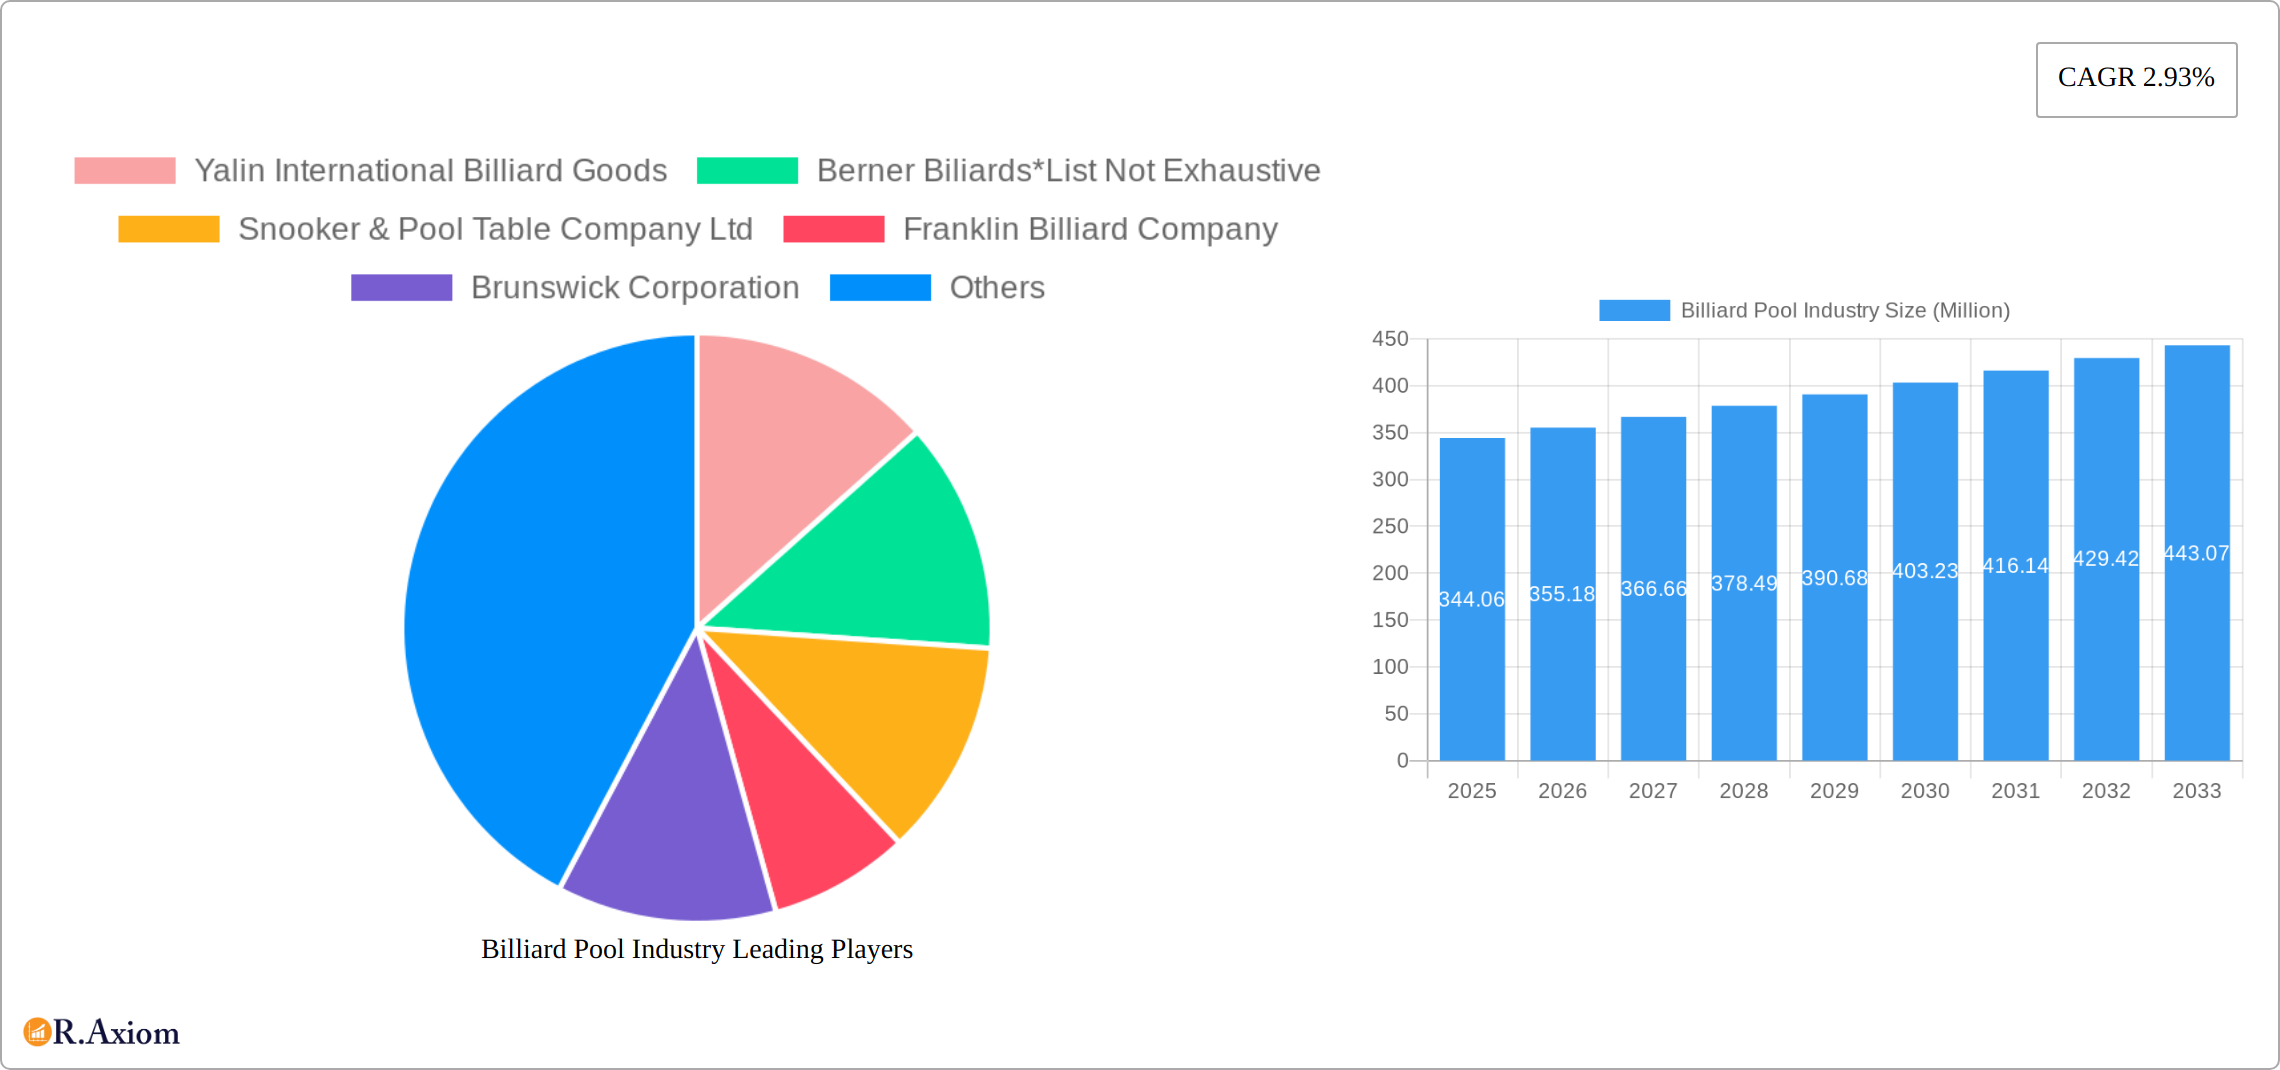
Billiard Pool Industry Market Size (In Million)
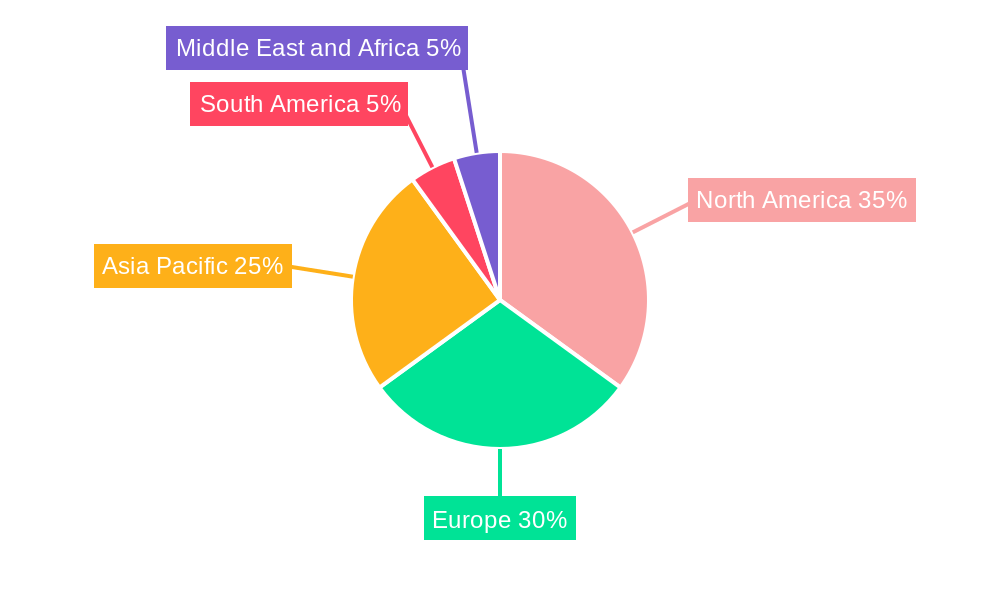
The industry is segmented by game type (carom, pool, snooker), equipment (tables, balls, cues, other equipment), and distribution channel (offline and online retail stores). The online retail segment is experiencing significant growth due to the convenience and wider reach it offers. Geographically, North America and Europe currently hold the largest market share, driven by established player bases and high disposable incomes. However, the Asia-Pacific region is poised for substantial growth in the coming years, fueled by increasing participation and investment in the sport. Key players in the market, including Yalin International Billiard Goods, Berner Billiards, Snooker & Pool Table Company Ltd, and Brunswick Corporation, are constantly innovating and expanding their product lines to cater to diverse consumer preferences and market demands. Strategic partnerships, product diversification, and targeted marketing campaigns are crucial for companies seeking to succeed in this competitive landscape.
Billiard Pool Industry Company Market Share
Billiard Pool Industry Market Report: 2019-2033
This comprehensive report provides a detailed analysis of the Billiard Pool industry, covering market size, segmentation, competitive landscape, and future growth prospects from 2019 to 2033. The study period spans 2019-2033, with 2025 as the base and estimated year. The forecast period is 2025-2033, and the historical period is 2019-2024. The report offers actionable insights for industry stakeholders, including manufacturers, distributors, and investors. The global market is projected to reach xx Million by 2033, exhibiting a CAGR of xx% during the forecast period.
Billiard Pool Industry Market Concentration & Innovation
The Billiard Pool industry exhibits a moderately concentrated market structure, with a few major players holding significant market share. Yalin International Billiard Goods, Berner Billiards, Snooker & Pool Table Company Ltd, Franklin Billiard Company, Brunswick Corporation, H Betti Industries Inc, Imperial International, Diamond Billiard Products Inc, Kaldera Billiards, and Birmingham Billiards Ltd are some of the key players. However, a large number of smaller regional and niche players also exist. Market share data for these key players is currently unavailable, so specific metrics are not provided (xx).
Innovation in the industry is driven by the introduction of technologically advanced tables, improved cue designs, and the development of high-quality accessories. Regulatory frameworks concerning product safety and materials are in place globally, though specifics can vary by region. The major product substitutes include other leisure activities and games (e.g., video games, bowling). End-user trends indicate a rising interest in high-quality, bespoke tables and an increasing demand for online retail options.
M&A activity in the industry has been relatively modest in recent years, with deal values averaging xx Million annually. However, strategic partnerships and collaborations are becoming increasingly common.
Billiard Pool Industry Industry Trends & Insights
The billiard pool industry is experiencing moderate but steady growth, fueled by several key factors. Rising disposable incomes in developing nations are expanding the market's potential customer base. Simultaneously, the sport's increasing popularity, particularly among younger demographics, is driving demand. The introduction of exciting new game formats and competitive leagues adds further dynamism. Technological advancements are also reshaping the industry, with the integration of smart technology into pool tables offering enhanced gameplay and data analysis capabilities. This includes features like automated scoring, online connectivity for global play, and even personalized coaching features. However, the industry faces challenges such as increasing raw material costs and competition from other leisure activities. Consumer preferences are evolving toward high-quality, durable, and stylish products, leading to a trend of premiumization. This means manufacturers are focusing on premium materials, sophisticated designs, and superior craftsmanship to appeal to discerning consumers. Competitive dynamics are a complex interplay of price competition and successful product differentiation, where brands must showcase unique features or superior quality to stand out. Market penetration of technologically advanced pool tables is currently at xx%, with projections reaching xx% by 2033, indicating substantial growth potential in this segment.
Dominant Markets & Segments in Billiard Pool Industry
The North American market currently holds the largest share of the global Billiard Pool industry, primarily driven by strong consumer demand and established distribution networks. Within the segments:
- Type: Pool tables dominate the market, followed by snooker and carom.
- Equipment: Tables constitute the largest segment, followed by cues and balls.
- Distribution Channel: Offline retail stores continue to be the primary distribution channel but online retail is growing rapidly.
Key Drivers for North American Dominance:
- Strong consumer spending on recreational activities.
- Well-established distribution infrastructure.
- Presence of major manufacturers and distributors.
Other regions, such as Europe and Asia, are also showing promising growth potential due to increasing disposable incomes and growing popularity of Billiards. However, challenges remain in specific regions with regards to affordability, lack of infrastructural development, and limited access to specialized equipment.
Billiard Pool Industry Product Developments
Recent product innovations focus on incorporating technology into pool tables, resulting in smart features such as score tracking, interactive gameplay, and self-leveling mechanisms. This has enhanced the overall gaming experience and consumer appeal. Companies are also focusing on creating more aesthetically pleasing and customizable pool tables to cater to different tastes and preferences. These advancements offer competitive advantages by enhancing product appeal and functionality.
Report Scope & Segmentation Analysis
This report provides a comprehensive segmentation of the billiard pool industry, analyzing key market aspects across various categories:
- Type: Carom billiards, eight-ball pool, nine-ball pool, snooker, and other specialized game variations. (Growth projections and detailed market sizes for each type are available in the full report - xx Million).
- Equipment: Pool tables (including variations in size, material, and features), balls (various sizes and materials), cues (ranging from entry-level to professional-grade), and other accessories such as racks, bridges, and protective covers. (Growth projections and detailed market sizes for each equipment category are available in the full report - xx Million).
- Distribution Channel: Offline retail stores (including specialized billiard shops and sporting goods retailers), online retail platforms (e-commerce websites and marketplaces), and direct-to-consumer sales. (Growth projections and detailed market sizes for each distribution channel are available in the full report - xx Million).
Each segment's analysis includes a thorough examination of its market size, growth trajectory, competitive landscape, and profiles of key players with specific market share data.
Key Drivers of Billiard Pool Industry Growth
Several factors drive the growth of the Billiard Pool industry, including:
- Rising disposable incomes in developing economies, leading to increased spending on leisure activities.
- Technological advancements, such as smart tables and improved cue designs.
- Growing popularity of the sport, fueled by the emergence of new leagues and tournaments.
- Increasing demand for home entertainment options, particularly among younger demographics.
Challenges in the Billiard Pool Industry Sector
The Billiard Pool industry faces several challenges, including:
- High manufacturing and distribution costs, leading to higher product prices.
- Competition from other leisure activities and entertainment options.
- Fluctuations in raw material prices, impacting profitability.
- Supply chain disruptions, potentially impacting product availability. The impact of these disruptions is estimated to be a xx% reduction in market growth in 2024.
Emerging Opportunities in Billiard Pool Industry
Several compelling opportunities are emerging within the billiard pool industry, promising significant growth potential:
- Market Expansion: Targeting new and developing markets with a burgeoning middle class presents a significant growth opportunity, especially in regions where the sport is gaining popularity.
- Product Innovation: Introducing innovative designs, enhanced features (such as smart technology integration), and customizable options can attract a wider range of consumers and create new market segments.
- Technological Integration: Leveraging technology not only enhances the gaming experience but also opens avenues for new revenue streams, such as virtual tournaments, online coaching, and data-driven personalized recommendations.
- E-commerce Growth: Expanding online distribution channels and improving the digital customer experience provides access to a larger customer base and offers opportunities for targeted marketing campaigns.
- Experiential Venues: Investing in creating high-quality billiard halls and entertainment venues that offer more than just tables can increase engagement and revenue.
Leading Players in the Billiard Pool Industry Market
- Yalin International Billiard Goods
- Berner Billiards
- Snooker & Pool Table Company Ltd
- Franklin Billiard Company
- Brunswick Corporation
- H Betti Industries Inc
- Imperial International
- Diamond Billiard Products Inc
- Kaldera Billiards
- Birmingham Billiards Ltd
Key Developments in Billiard Pool Industry Industry
- October 2022: Sawyer Twain launched a new line of Nixon Billiards in the North American market, including the Desyn, Kai, and Birdy tables. This broadened the product offerings in a key market and introduced innovative designs.
- May 2022: FCI Billiards opened a new showroom in Joplin, expanding its retail presence and brand visibility within a local community.
- May 2021: Bugatti launched a USD 300,000 pool table with gyroscopic self-leveling, highlighting the premiumization trend and technological innovation within the industry.
Strategic Outlook for Billiard Pool Industry Market
The billiard pool industry is well-positioned for continued growth, fueled by a confluence of favorable factors. Technological innovation, evolving consumer preferences, and strategic expansion into new markets will all contribute to significant market expansion in the coming years. Strategic partnerships, such as collaborations with technology companies or entertainment venues, will be crucial for sustained growth. The adoption of innovative marketing strategies, including targeted digital campaigns and influencer marketing, will play a vital role in reaching new customers. A core focus on product differentiation and diversification, offering a range of products and services catering to diverse customer segments, will be essential for long-term success in this dynamic market.
Billiard Pool Industry Segmentation
-
1. Type
- 1.1. Carom
- 1.2. Pool
- 1.3. Snooker
-
2. Equipment
- 2.1. Table
- 2.2. Ball
- 2.3. Cue
- 2.4. Other Equipment
-
3. Distribution Channel
- 3.1. Offline Retail Stores
- 3.2. Online Retail Stores
Billiard Pool Industry Segmentation By Geography
-
1. North America
- 1.1. United States
- 1.2. Canada
- 1.3. Mexico
- 1.4. Rest of North America
-
2. Europe
- 2.1. Spain
- 2.2. United Kingdom
- 2.3. Germany
- 2.4. France
- 2.5. Italy
- 2.6. Belgium
- 2.7. Rest of Europe
-
3. Asia Pacific
- 3.1. China
- 3.2. Japan
- 3.3. India
- 3.4. Australia
- 3.5. Rest of Asia Pacific
-
4. South America
- 4.1. Brazil
- 4.2. Argentina
- 4.3. Rest of South America
-
5. Middle East and Africa
- 5.1. South Africa
- 5.2. United Arab Emirates
- 5.3. Rest of Middle East and Africa
Billiard Pool Industry Regional Market Share
Geographic Coverage of Billiard Pool Industry
Billiard Pool Industry REPORT HIGHLIGHTS
| Aspects | Details |
|---|---|
| Study Period | 2020-2034 |
| Base Year | 2025 |
| Estimated Year | 2026 |
| Forecast Period | 2026-2034 |
| Historical Period | 2020-2025 |
| Growth Rate | CAGR of 2.93% from 2020-2034 |
| Segmentation |
|
Table of Contents
- 1. Introduction
- 1.1. Research Scope
- 1.2. Market Segmentation
- 1.3. Research Objective
- 1.4. Definitions and Assumptions
- 2. Executive Summary
- 2.1. Market Snapshot
- 3. Market Dynamics
- 3.1. Market Drivers
- 3.2. Market Restrains
- 3.3. Market Trends
- 3.4. Market Opportunities
- 4. Market Factor Analysis
- 4.1. Porters Five Forces
- 4.1.1. Bargaining Power of Suppliers
- 4.1.2. Bargaining Power of Buyers
- 4.1.3. Threat of New Entrants
- 4.1.4. Threat of Substitutes
- 4.1.5. Competitive Rivalry
- 4.2. PESTEL analysis
- 4.3. BCG Analysis
- 4.3.1. Stars (High Growth, High Market Share)
- 4.3.2. Cash Cows (Low Growth, High Market Share)
- 4.3.3. Question Mark (High Growth, Low Market Share)
- 4.3.4. Dogs (Low Growth, Low Market Share)
- 4.4. Ansoff Matrix Analysis
- 4.5. Supply Chain Analysis
- 4.6. Regulatory Landscape
- 4.7. Current Market Potential and Opportunity Assessment (TAM–SAM–SOM Framework)
- 4.8. RAX Analyst Note
- 4.1. Porters Five Forces
- 5. Market Analysis, Insights and Forecast 2021-2033
- 5.1. Market Analysis, Insights and Forecast - by Type
- 5.1.1. Carom
- 5.1.2. Pool
- 5.1.3. Snooker
- 5.2. Market Analysis, Insights and Forecast - by Equipment
- 5.2.1. Table
- 5.2.2. Ball
- 5.2.3. Cue
- 5.2.4. Other Equipment
- 5.3. Market Analysis, Insights and Forecast - by Distribution Channel
- 5.3.1. Offline Retail Stores
- 5.3.2. Online Retail Stores
- 5.4. Market Analysis, Insights and Forecast - by Region
- 5.4.1. North America
- 5.4.2. Europe
- 5.4.3. Asia Pacific
- 5.4.4. South America
- 5.4.5. Middle East and Africa
- 5.1. Market Analysis, Insights and Forecast - by Type
- 6. Global Billiard Pool Industry Analysis, Insights and Forecast, 2021-2033
- 6.1. Market Analysis, Insights and Forecast - by Type
- 6.1.1. Carom
- 6.1.2. Pool
- 6.1.3. Snooker
- 6.2. Market Analysis, Insights and Forecast - by Equipment
- 6.2.1. Table
- 6.2.2. Ball
- 6.2.3. Cue
- 6.2.4. Other Equipment
- 6.3. Market Analysis, Insights and Forecast - by Distribution Channel
- 6.3.1. Offline Retail Stores
- 6.3.2. Online Retail Stores
- 6.1. Market Analysis, Insights and Forecast - by Type
- 7. North America Billiard Pool Industry Analysis, Insights and Forecast, 2020-2032
- 7.1. Market Analysis, Insights and Forecast - by Type
- 7.1.1. Carom
- 7.1.2. Pool
- 7.1.3. Snooker
- 7.2. Market Analysis, Insights and Forecast - by Equipment
- 7.2.1. Table
- 7.2.2. Ball
- 7.2.3. Cue
- 7.2.4. Other Equipment
- 7.3. Market Analysis, Insights and Forecast - by Distribution Channel
- 7.3.1. Offline Retail Stores
- 7.3.2. Online Retail Stores
- 7.1. Market Analysis, Insights and Forecast - by Type
- 8. Europe Billiard Pool Industry Analysis, Insights and Forecast, 2020-2032
- 8.1. Market Analysis, Insights and Forecast - by Type
- 8.1.1. Carom
- 8.1.2. Pool
- 8.1.3. Snooker
- 8.2. Market Analysis, Insights and Forecast - by Equipment
- 8.2.1. Table
- 8.2.2. Ball
- 8.2.3. Cue
- 8.2.4. Other Equipment
- 8.3. Market Analysis, Insights and Forecast - by Distribution Channel
- 8.3.1. Offline Retail Stores
- 8.3.2. Online Retail Stores
- 8.1. Market Analysis, Insights and Forecast - by Type
- 9. Asia Pacific Billiard Pool Industry Analysis, Insights and Forecast, 2020-2032
- 9.1. Market Analysis, Insights and Forecast - by Type
- 9.1.1. Carom
- 9.1.2. Pool
- 9.1.3. Snooker
- 9.2. Market Analysis, Insights and Forecast - by Equipment
- 9.2.1. Table
- 9.2.2. Ball
- 9.2.3. Cue
- 9.2.4. Other Equipment
- 9.3. Market Analysis, Insights and Forecast - by Distribution Channel
- 9.3.1. Offline Retail Stores
- 9.3.2. Online Retail Stores
- 9.1. Market Analysis, Insights and Forecast - by Type
- 10. South America Billiard Pool Industry Analysis, Insights and Forecast, 2020-2032
- 10.1. Market Analysis, Insights and Forecast - by Type
- 10.1.1. Carom
- 10.1.2. Pool
- 10.1.3. Snooker
- 10.2. Market Analysis, Insights and Forecast - by Equipment
- 10.2.1. Table
- 10.2.2. Ball
- 10.2.3. Cue
- 10.2.4. Other Equipment
- 10.3. Market Analysis, Insights and Forecast - by Distribution Channel
- 10.3.1. Offline Retail Stores
- 10.3.2. Online Retail Stores
- 10.1. Market Analysis, Insights and Forecast - by Type
- 11. Middle East and Africa Billiard Pool Industry Analysis, Insights and Forecast, 2020-2032
- 11.1. Market Analysis, Insights and Forecast - by Type
- 11.1.1. Carom
- 11.1.2. Pool
- 11.1.3. Snooker
- 11.2. Market Analysis, Insights and Forecast - by Equipment
- 11.2.1. Table
- 11.2.2. Ball
- 11.2.3. Cue
- 11.2.4. Other Equipment
- 11.3. Market Analysis, Insights and Forecast - by Distribution Channel
- 11.3.1. Offline Retail Stores
- 11.3.2. Online Retail Stores
- 11.1. Market Analysis, Insights and Forecast - by Type
- 12. Competitive Analysis
- 12.1. Company Profiles
- 12.1.1 Yalin International Billiard Goods
- 12.1.1.1. Company Overview
- 12.1.1.2. Products
- 12.1.1.3. Company Financials
- 12.1.1.4. SWOT Analysis
- 12.1.2 Berner Biliards*List Not Exhaustive
- 12.1.2.1. Company Overview
- 12.1.2.2. Products
- 12.1.2.3. Company Financials
- 12.1.2.4. SWOT Analysis
- 12.1.3 Snooker & Pool Table Company Ltd
- 12.1.3.1. Company Overview
- 12.1.3.2. Products
- 12.1.3.3. Company Financials
- 12.1.3.4. SWOT Analysis
- 12.1.4 Franklin Billiard Company
- 12.1.4.1. Company Overview
- 12.1.4.2. Products
- 12.1.4.3. Company Financials
- 12.1.4.4. SWOT Analysis
- 12.1.5 Brunswick Corporation
- 12.1.5.1. Company Overview
- 12.1.5.2. Products
- 12.1.5.3. Company Financials
- 12.1.5.4. SWOT Analysis
- 12.1.6 H Betti Industries Inc
- 12.1.6.1. Company Overview
- 12.1.6.2. Products
- 12.1.6.3. Company Financials
- 12.1.6.4. SWOT Analysis
- 12.1.7 Imperial International
- 12.1.7.1. Company Overview
- 12.1.7.2. Products
- 12.1.7.3. Company Financials
- 12.1.7.4. SWOT Analysis
- 12.1.8 Diamond Billiard Products Inc
- 12.1.8.1. Company Overview
- 12.1.8.2. Products
- 12.1.8.3. Company Financials
- 12.1.8.4. SWOT Analysis
- 12.1.9 Kaldera Billiards
- 12.1.9.1. Company Overview
- 12.1.9.2. Products
- 12.1.9.3. Company Financials
- 12.1.9.4. SWOT Analysis
- 12.1.10 Birmingham Billiards Ltd
- 12.1.10.1. Company Overview
- 12.1.10.2. Products
- 12.1.10.3. Company Financials
- 12.1.10.4. SWOT Analysis
- 12.1.1 Yalin International Billiard Goods
- 12.2. Market Entropy
- 12.2.1 Company's Key Areas Served
- 12.2.2 Recent Developments
- 12.3. Company Market Share Analysis 2025
- 12.3.1 Top 5 Companies Market Share Analysis
- 12.3.2 Top 3 Companies Market Share Analysis
- 12.4. List of Potential Customers
- 13. Research Methodology
List of Figures
- Figure 1: Global Billiard Pool Industry Revenue Breakdown (Million, %) by Region 2025 & 2033
- Figure 2: North America Billiard Pool Industry Revenue (Million), by Type 2025 & 2033
- Figure 3: North America Billiard Pool Industry Revenue Share (%), by Type 2025 & 2033
- Figure 4: North America Billiard Pool Industry Revenue (Million), by Equipment 2025 & 2033
- Figure 5: North America Billiard Pool Industry Revenue Share (%), by Equipment 2025 & 2033
- Figure 6: North America Billiard Pool Industry Revenue (Million), by Distribution Channel 2025 & 2033
- Figure 7: North America Billiard Pool Industry Revenue Share (%), by Distribution Channel 2025 & 2033
- Figure 8: North America Billiard Pool Industry Revenue (Million), by Country 2025 & 2033
- Figure 9: North America Billiard Pool Industry Revenue Share (%), by Country 2025 & 2033
- Figure 10: Europe Billiard Pool Industry Revenue (Million), by Type 2025 & 2033
- Figure 11: Europe Billiard Pool Industry Revenue Share (%), by Type 2025 & 2033
- Figure 12: Europe Billiard Pool Industry Revenue (Million), by Equipment 2025 & 2033
- Figure 13: Europe Billiard Pool Industry Revenue Share (%), by Equipment 2025 & 2033
- Figure 14: Europe Billiard Pool Industry Revenue (Million), by Distribution Channel 2025 & 2033
- Figure 15: Europe Billiard Pool Industry Revenue Share (%), by Distribution Channel 2025 & 2033
- Figure 16: Europe Billiard Pool Industry Revenue (Million), by Country 2025 & 2033
- Figure 17: Europe Billiard Pool Industry Revenue Share (%), by Country 2025 & 2033
- Figure 18: Asia Pacific Billiard Pool Industry Revenue (Million), by Type 2025 & 2033
- Figure 19: Asia Pacific Billiard Pool Industry Revenue Share (%), by Type 2025 & 2033
- Figure 20: Asia Pacific Billiard Pool Industry Revenue (Million), by Equipment 2025 & 2033
- Figure 21: Asia Pacific Billiard Pool Industry Revenue Share (%), by Equipment 2025 & 2033
- Figure 22: Asia Pacific Billiard Pool Industry Revenue (Million), by Distribution Channel 2025 & 2033
- Figure 23: Asia Pacific Billiard Pool Industry Revenue Share (%), by Distribution Channel 2025 & 2033
- Figure 24: Asia Pacific Billiard Pool Industry Revenue (Million), by Country 2025 & 2033
- Figure 25: Asia Pacific Billiard Pool Industry Revenue Share (%), by Country 2025 & 2033
- Figure 26: South America Billiard Pool Industry Revenue (Million), by Type 2025 & 2033
- Figure 27: South America Billiard Pool Industry Revenue Share (%), by Type 2025 & 2033
- Figure 28: South America Billiard Pool Industry Revenue (Million), by Equipment 2025 & 2033
- Figure 29: South America Billiard Pool Industry Revenue Share (%), by Equipment 2025 & 2033
- Figure 30: South America Billiard Pool Industry Revenue (Million), by Distribution Channel 2025 & 2033
- Figure 31: South America Billiard Pool Industry Revenue Share (%), by Distribution Channel 2025 & 2033
- Figure 32: South America Billiard Pool Industry Revenue (Million), by Country 2025 & 2033
- Figure 33: South America Billiard Pool Industry Revenue Share (%), by Country 2025 & 2033
- Figure 34: Middle East and Africa Billiard Pool Industry Revenue (Million), by Type 2025 & 2033
- Figure 35: Middle East and Africa Billiard Pool Industry Revenue Share (%), by Type 2025 & 2033
- Figure 36: Middle East and Africa Billiard Pool Industry Revenue (Million), by Equipment 2025 & 2033
- Figure 37: Middle East and Africa Billiard Pool Industry Revenue Share (%), by Equipment 2025 & 2033
- Figure 38: Middle East and Africa Billiard Pool Industry Revenue (Million), by Distribution Channel 2025 & 2033
- Figure 39: Middle East and Africa Billiard Pool Industry Revenue Share (%), by Distribution Channel 2025 & 2033
- Figure 40: Middle East and Africa Billiard Pool Industry Revenue (Million), by Country 2025 & 2033
- Figure 41: Middle East and Africa Billiard Pool Industry Revenue Share (%), by Country 2025 & 2033
List of Tables
- Table 1: Global Billiard Pool Industry Revenue Million Forecast, by Type 2020 & 2033
- Table 2: Global Billiard Pool Industry Revenue Million Forecast, by Equipment 2020 & 2033
- Table 3: Global Billiard Pool Industry Revenue Million Forecast, by Distribution Channel 2020 & 2033
- Table 4: Global Billiard Pool Industry Revenue Million Forecast, by Region 2020 & 2033
- Table 5: Global Billiard Pool Industry Revenue Million Forecast, by Type 2020 & 2033
- Table 6: Global Billiard Pool Industry Revenue Million Forecast, by Equipment 2020 & 2033
- Table 7: Global Billiard Pool Industry Revenue Million Forecast, by Distribution Channel 2020 & 2033
- Table 8: Global Billiard Pool Industry Revenue Million Forecast, by Country 2020 & 2033
- Table 9: United States Billiard Pool Industry Revenue (Million) Forecast, by Application 2020 & 2033
- Table 10: Canada Billiard Pool Industry Revenue (Million) Forecast, by Application 2020 & 2033
- Table 11: Mexico Billiard Pool Industry Revenue (Million) Forecast, by Application 2020 & 2033
- Table 12: Rest of North America Billiard Pool Industry Revenue (Million) Forecast, by Application 2020 & 2033
- Table 13: Global Billiard Pool Industry Revenue Million Forecast, by Type 2020 & 2033
- Table 14: Global Billiard Pool Industry Revenue Million Forecast, by Equipment 2020 & 2033
- Table 15: Global Billiard Pool Industry Revenue Million Forecast, by Distribution Channel 2020 & 2033
- Table 16: Global Billiard Pool Industry Revenue Million Forecast, by Country 2020 & 2033
- Table 17: Spain Billiard Pool Industry Revenue (Million) Forecast, by Application 2020 & 2033
- Table 18: United Kingdom Billiard Pool Industry Revenue (Million) Forecast, by Application 2020 & 2033
- Table 19: Germany Billiard Pool Industry Revenue (Million) Forecast, by Application 2020 & 2033
- Table 20: France Billiard Pool Industry Revenue (Million) Forecast, by Application 2020 & 2033
- Table 21: Italy Billiard Pool Industry Revenue (Million) Forecast, by Application 2020 & 2033
- Table 22: Belgium Billiard Pool Industry Revenue (Million) Forecast, by Application 2020 & 2033
- Table 23: Rest of Europe Billiard Pool Industry Revenue (Million) Forecast, by Application 2020 & 2033
- Table 24: Global Billiard Pool Industry Revenue Million Forecast, by Type 2020 & 2033
- Table 25: Global Billiard Pool Industry Revenue Million Forecast, by Equipment 2020 & 2033
- Table 26: Global Billiard Pool Industry Revenue Million Forecast, by Distribution Channel 2020 & 2033
- Table 27: Global Billiard Pool Industry Revenue Million Forecast, by Country 2020 & 2033
- Table 28: China Billiard Pool Industry Revenue (Million) Forecast, by Application 2020 & 2033
- Table 29: Japan Billiard Pool Industry Revenue (Million) Forecast, by Application 2020 & 2033
- Table 30: India Billiard Pool Industry Revenue (Million) Forecast, by Application 2020 & 2033
- Table 31: Australia Billiard Pool Industry Revenue (Million) Forecast, by Application 2020 & 2033
- Table 32: Rest of Asia Pacific Billiard Pool Industry Revenue (Million) Forecast, by Application 2020 & 2033
- Table 33: Global Billiard Pool Industry Revenue Million Forecast, by Type 2020 & 2033
- Table 34: Global Billiard Pool Industry Revenue Million Forecast, by Equipment 2020 & 2033
- Table 35: Global Billiard Pool Industry Revenue Million Forecast, by Distribution Channel 2020 & 2033
- Table 36: Global Billiard Pool Industry Revenue Million Forecast, by Country 2020 & 2033
- Table 37: Brazil Billiard Pool Industry Revenue (Million) Forecast, by Application 2020 & 2033
- Table 38: Argentina Billiard Pool Industry Revenue (Million) Forecast, by Application 2020 & 2033
- Table 39: Rest of South America Billiard Pool Industry Revenue (Million) Forecast, by Application 2020 & 2033
- Table 40: Global Billiard Pool Industry Revenue Million Forecast, by Type 2020 & 2033
- Table 41: Global Billiard Pool Industry Revenue Million Forecast, by Equipment 2020 & 2033
- Table 42: Global Billiard Pool Industry Revenue Million Forecast, by Distribution Channel 2020 & 2033
- Table 43: Global Billiard Pool Industry Revenue Million Forecast, by Country 2020 & 2033
- Table 44: South Africa Billiard Pool Industry Revenue (Million) Forecast, by Application 2020 & 2033
- Table 45: United Arab Emirates Billiard Pool Industry Revenue (Million) Forecast, by Application 2020 & 2033
- Table 46: Rest of Middle East and Africa Billiard Pool Industry Revenue (Million) Forecast, by Application 2020 & 2033
Frequently Asked Questions
1. What is the projected Compound Annual Growth Rate (CAGR) of the Billiard Pool Industry?
The projected CAGR is approximately 2.93%.
2. Which companies are prominent players in the Billiard Pool Industry?
Key companies in the market include Yalin International Billiard Goods, Berner Biliards*List Not Exhaustive, Snooker & Pool Table Company Ltd, Franklin Billiard Company, Brunswick Corporation, H Betti Industries Inc, Imperial International, Diamond Billiard Products Inc, Kaldera Billiards, Birmingham Billiards Ltd.
3. What are the main segments of the Billiard Pool Industry?
The market segments include Type, Equipment, Distribution Channel.
4. Can you provide details about the market size?
The market size is estimated to be USD 344.06 Million as of 2022.
5. What are some drivers contributing to market growth?
Aggressive Social Media Marketing; Lower-risk Factor Associated with the Use of E-Cigarettes Compared to Conventional/Combustible Cigarettes.
6. What are the notable trends driving market growth?
Increased Sports Participation Propelling the Billiards and Pools Equipment Sales.
7. Are there any restraints impacting market growth?
Government Initiatives to Ban Disposable E-Cigarettes.
8. Can you provide examples of recent developments in the market?
In October 2022, Sawyer Twain launched a new line of Nixon Billiards to the North American market. Featured in the Nixon Billiards line are the Desyn, a mid-century modern table; the prominent Kai table; and the Birdy, a contemporary chic billiards table with a carefully crafted refectory design that stands alone in being the first of its kind with modern tapered rails.
9. What pricing options are available for accessing the report?
Pricing options include single-user, multi-user, and enterprise licenses priced at USD 4750, USD 5250, and USD 8750 respectively.
10. Is the market size provided in terms of value or volume?
The market size is provided in terms of value, measured in Million.
11. Are there any specific market keywords associated with the report?
Yes, the market keyword associated with the report is "Billiard Pool Industry," which aids in identifying and referencing the specific market segment covered.
12. How do I determine which pricing option suits my needs best?
The pricing options vary based on user requirements and access needs. Individual users may opt for single-user licenses, while businesses requiring broader access may choose multi-user or enterprise licenses for cost-effective access to the report.
13. Are there any additional resources or data provided in the Billiard Pool Industry report?
While the report offers comprehensive insights, it's advisable to review the specific contents or supplementary materials provided to ascertain if additional resources or data are available.
14. How can I stay updated on further developments or reports in the Billiard Pool Industry?
To stay informed about further developments, trends, and reports in the Billiard Pool Industry, consider subscribing to industry newsletters, following relevant companies and organizations, or regularly checking reputable industry news sources and publications.
Methodology
Step 1 - Identification of Relevant Samples Size from Population Database


Step 2 - Approaches for Defining Global Market Size (Value, Volume* & Price*)

Note*: In applicable scenarios
Step 3 - Data Sources
Primary Research
- Web Analytics
- Survey Reports
- Research Institute
- Latest Research Reports
- Opinion Leaders
Secondary Research
- Annual Reports
- White Paper
- Latest Press Release
- Industry Association
- Paid Database
- Investor Presentations

Step 4 - Data Triangulation
Involves using different sources of information in order to increase the validity of a study
These sources are likely to be stakeholders in a program - participants, other researchers, program staff, other community members, and so on.
Then we put all data in single framework & apply various statistical tools to find out the dynamic on the market.
During the analysis stage, feedback from the stakeholder groups would be compared to determine areas of agreement as well as areas of divergence