

Key Insights
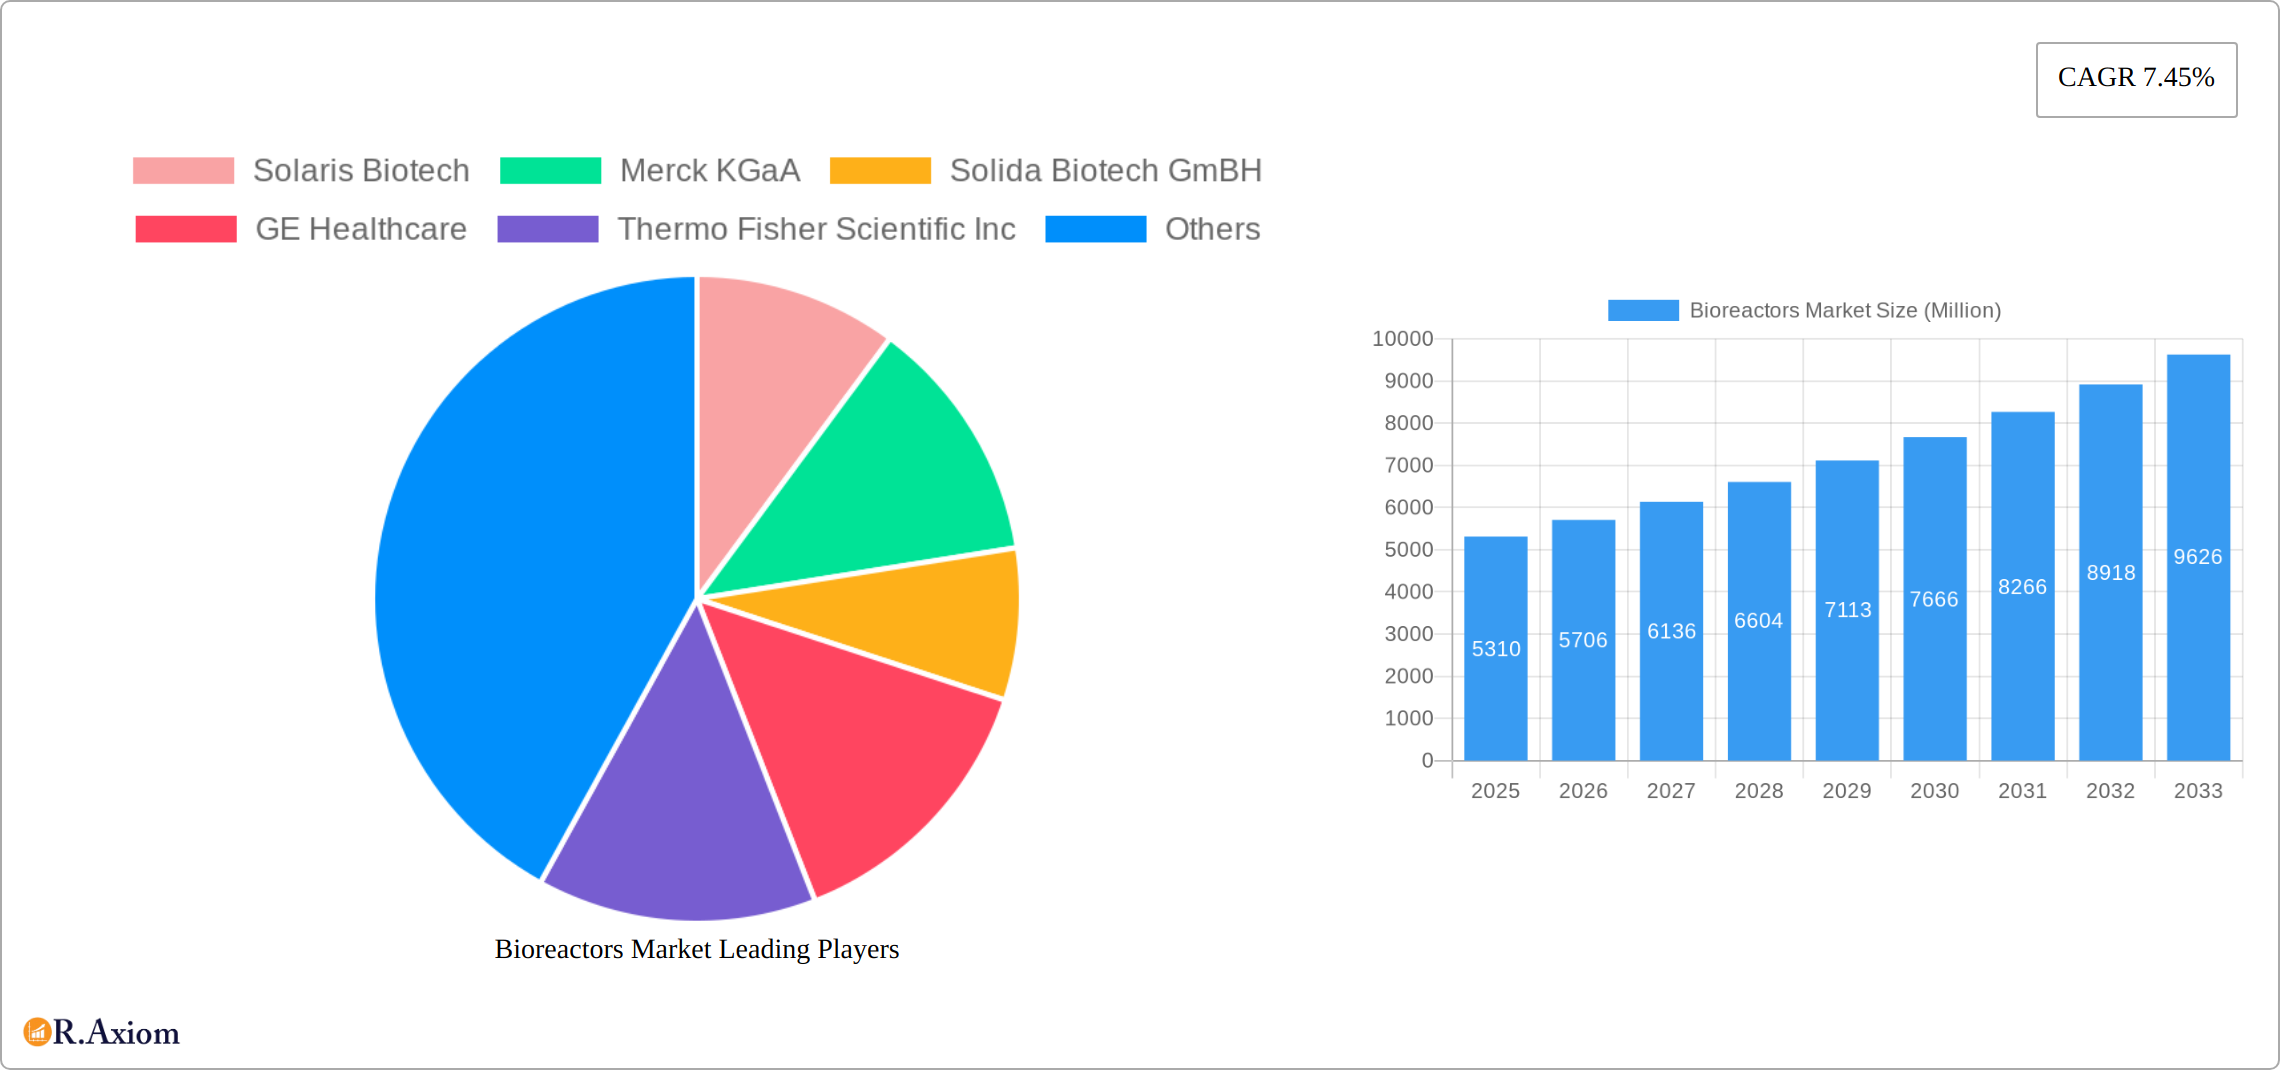
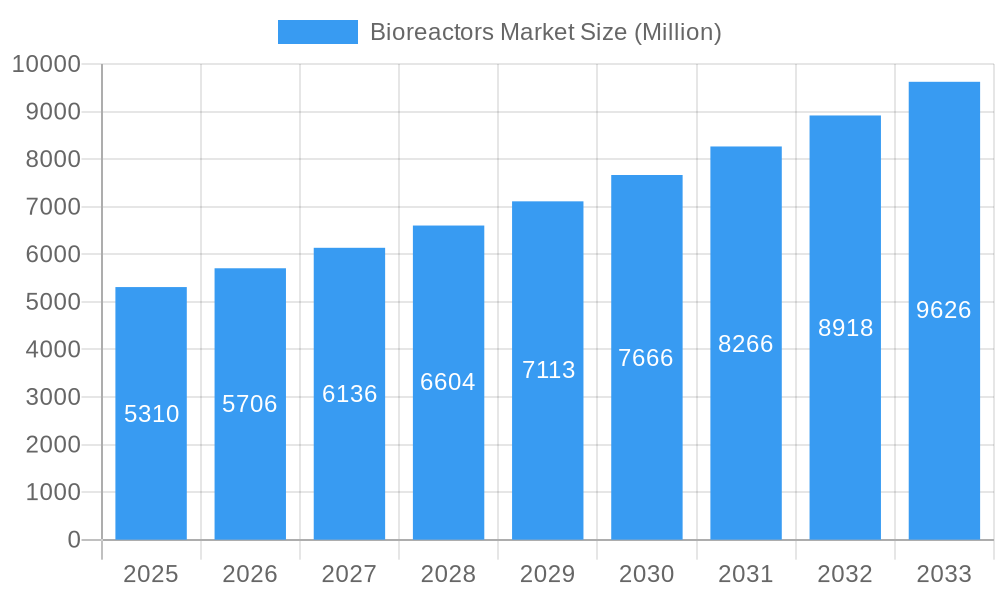
The global bioreactors market, valued at $5.31 billion in 2025, is projected to experience robust growth, exhibiting a compound annual growth rate (CAGR) of 7.45% from 2025 to 2033. This expansion is driven by several key factors. Firstly, the burgeoning pharmaceutical and biotechnology industries are significantly increasing demand for bioreactors in the production of biopharmaceuticals, vaccines, and therapeutic proteins. Advancements in cell culture technology, particularly in single-use bioreactor systems, are contributing to higher efficiency and reduced contamination risks, further fueling market growth. Growing investments in research and development, coupled with increasing government initiatives promoting biopharmaceutical manufacturing, are also contributing to this positive trajectory. The market is segmented by control type (manual, automated), material (glass, stainless steel, single-use), usage (lab-scale, pilot-scale, full-scale production), and scale (5L-20L, 20L-200L, 200L-1,500L, above 1,500L). The automated (MFCs) and single-use segments are anticipated to witness faster growth due to their enhanced process control and reduced cleaning validation requirements. Geographically, North America and Europe currently dominate the market, benefiting from established biopharmaceutical sectors and extensive research infrastructure. However, rapidly developing economies in Asia Pacific, particularly China and India, are poised to witness significant growth in the coming years, driven by increasing investments in biotechnology and pharmaceutical manufacturing capabilities.
Bioreactors Market Market Size (In Billion)
The competitive landscape of the bioreactors market is characterized by the presence of both established players and emerging companies. Key market participants include Solaris Biotech, Merck KGaA, Solida Biotech GmBH, GE Healthcare, Thermo Fisher Scientific Inc, Eppendorf AG, Bioengineering AG, Pall Corporation (Danaher Corporation), Sartorius AG, Getinge AB, Esco Lifesciences Group Ltd, and Infors HT. These companies are strategically focusing on product innovation, mergers and acquisitions, and geographic expansion to maintain their market share and capitalize on emerging opportunities. The increasing demand for customized bioreactors, tailored to specific applications and process requirements, presents a significant opportunity for manufacturers to develop innovative solutions and cater to the evolving needs of the biopharmaceutical industry. Continued technological advancements, regulatory approvals, and collaborations between bioreactor manufacturers and end-users are expected to shape the future trajectory of the market.
Bioreactors Market Company Market Share
This comprehensive report provides a detailed analysis of the global bioreactors market, offering invaluable insights for industry stakeholders, investors, and researchers. Covering the period from 2019 to 2033, with 2025 as the base year, this report meticulously examines market trends, segmentation, key players, and future growth prospects. The report uses Million as the unit for all values.
Bioreactors Market Concentration & Innovation
The bioreactors market exhibits a moderately concentrated landscape, with several multinational corporations holding significant market share. Key players such as Sartorius AG, GE Healthcare, and Thermo Fisher Scientific Inc dominate the market, leveraging their extensive R&D capabilities and global distribution networks. However, smaller specialized companies like Solaris Biotech and Solida Biotech GmBH are also making inroads, focusing on niche applications and innovative technologies. The market share of the top 5 players is estimated at xx%.
Innovation is a crucial driver in this market, fueled by advancements in single-use technologies, automation (MFCs), and process optimization. Stringent regulatory frameworks, particularly concerning biopharmaceutical manufacturing, influence product development and adoption. The market also witnesses continuous development of product substitutes, primarily focusing on improving efficiency, scalability, and cost-effectiveness. End-user trends, such as the growing demand for personalized medicine and cell-based therapies, are shaping the market's trajectory. M&A activities, though not overly frequent, play a role in shaping the competitive landscape, with deal values averaging xx Million in recent years. Several smaller acquisitions have focused on integrating innovative technologies or expanding into new geographical markets.
Bioreactors Market Industry Trends & Insights
The global bioreactors market is experiencing robust growth, fueled by the surging demand for biopharmaceuticals, the rapid advancement of cell and gene therapies, and substantial investments in research and development. Market projections indicate a significant compound annual growth rate (CAGR) of xx% throughout the forecast period (2025-2033). This expansion is significantly driven by technological innovations, most notably the rise of single-use bioreactors. These systems offer compelling advantages, including reduced contamination risks, simplified operation, and enhanced cost-effectiveness. A clear trend shows a preference shift towards automated systems (MFCs), providing superior process control and increased productivity. The competitive landscape is fiercely contested, with key players vying for market dominance through strategic innovation, collaborations, and acquisitions. Market penetration of single-use bioreactors is poised to reach xx% by 2033, reflecting the widespread adoption of this transformative technology. Furthermore, the increasing focus on personalized medicine and continuous bioprocessing is further stimulating market growth.
Dominant Markets & Segments in Bioreactors Market
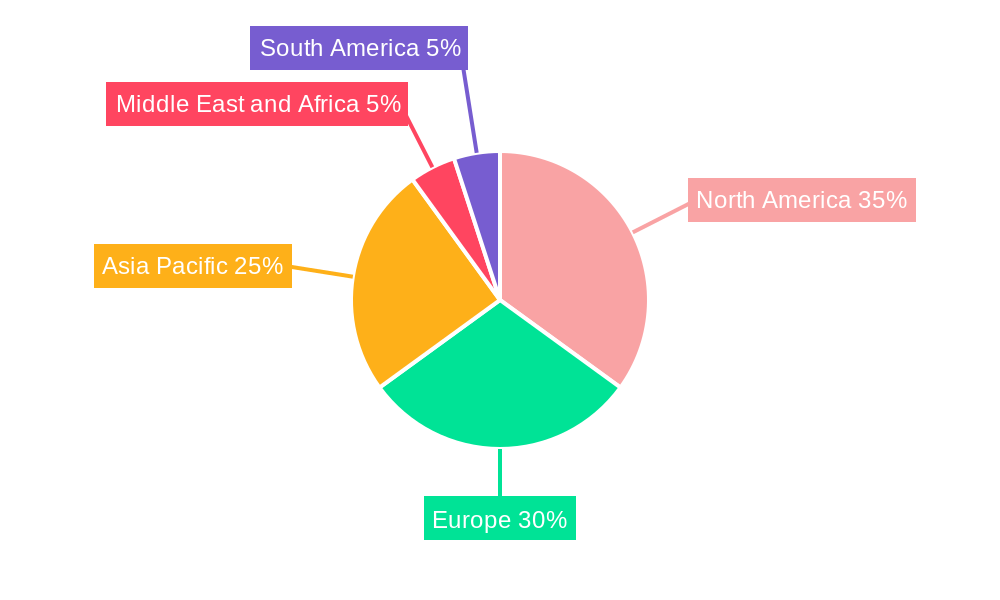
The North American region currently dominates the bioreactors market, driven by strong research infrastructure, high healthcare expenditure, and a large biopharmaceutical industry. Within this region, the United States holds the largest market share. However, the Asia-Pacific region is expected to exhibit the fastest growth rate during the forecast period, fueled by growing investments in healthcare infrastructure and an expanding biopharmaceutical sector.
Key Drivers of Regional Dominance:
- North America: Strong R&D infrastructure, high healthcare spending, established biopharmaceutical industry.
- Europe: Significant presence of pharmaceutical companies, stringent regulatory frameworks driving technological advancements.
- Asia-Pacific: Rapid economic growth, increasing healthcare investments, growing demand for biopharmaceuticals.
Dominant Segments:
- Control Type: Automated (MFCs) is gaining traction due to improved process control and efficiency, exceeding the market share of manual control systems.
- Type: Single-use bioreactors are experiencing high growth due to their advantages in terms of cost-effectiveness, scalability and reduced contamination risks. Stainless steel bioreactors still maintain a significant market share due to their robustness and suitability for various applications.
- Usage: The demand for bioreactors across all scales (Lab-scale, Pilot-scale, Full-scale) is robust, with full-scale production dominating the market in terms of revenue.
- Scale: The 200L-1,500L scale currently dominates the market, representing a balance between production capacity and cost-effectiveness. However, the demand for larger scale bioreactors (above 1,500L) is increasing due to growing requirements from the biopharmaceutical industry.
Bioreactors Market Product Developments
Recent advancements in bioreactor technology are centered on enhancing process control, scalability, and single-use capabilities. The integration of cutting-edge sensors, automated functionalities, and sophisticated data analytics is revolutionizing bioreactor operations, resulting in improved efficiency and reduced operational expenditures. These improvements directly address the needs of biopharmaceutical manufacturers striving to optimize production processes and expedite drug development timelines. The market is witnessing a substantial transition towards single-use bioreactors, effectively mitigating concerns related to cleaning validation, cross-contamination, and overall cost-efficiency. Miniaturization of bioreactors for high-throughput screening and process development is also gaining traction.
Report Scope & Segmentation Analysis
This report offers a comprehensive segmentation analysis of the bioreactors market, categorized by control type (Manual, Automated (MFCs)), type (Glass, Stainless Steel, Single-use), usage (Lab-scale Production, Pilot-scale Production, Full-scale Production), and scale (5L-20L, 20L-200L, 200L-1,500L, Above 1,500L). The report meticulously analyzes each segment's growth projections, market size, and competitive landscape. For example, the single-use segment is projected to experience substantial growth due to its inherent cost-effectiveness, flexibility, and reduced contamination risk. Concurrently, the automated (MFCs) segment is witnessing increased adoption driven by its superior process control and reduced reliance on manual intervention. The report also explores niche applications within specific therapeutic areas and their influence on market segmentation.
Key Drivers of Bioreactors Market Growth
The bioreactors market's growth is driven by several factors. The rising demand for biopharmaceuticals, particularly biologics, is a major catalyst. Advances in cell and gene therapies necessitate sophisticated bioreactor systems. Government regulations and initiatives supporting biomanufacturing further stimulate market growth. Technological advancements, such as the development of single-use bioreactors and automated systems, are key drivers of market expansion.
Challenges in the Bioreactors Market Sector
The bioreactors market faces challenges including the high initial investment costs associated with advanced bioreactor systems. Stringent regulatory requirements for biopharmaceutical manufacturing increase compliance costs. Supply chain disruptions can impact the availability of raw materials and components. Intense competition among established players and new entrants creates pricing pressures. The overall impact of these factors is estimated to reduce market growth by xx% annually.
Emerging Opportunities in Bioreactors Market
Significant emerging opportunities include the escalating demand for personalized medicine, necessitating more sophisticated bioreactor systems. The rise of continuous bioprocessing presents considerable potential for enhancing efficiency and scalability. The development of innovative bioreactor designs tailored to specific applications in areas such as cell and gene therapy is expected to unlock substantial market potential. Furthermore, expansion into emerging markets with rapidly developing healthcare infrastructures offers promising avenues for growth. The increasing adoption of advanced analytics and AI for process optimization also represents a key growth driver.
Leading Players in the Bioreactors Market Market
- Solaris Biotech
- Merck KGaA
- Solida Biotech GmBH
- GE Healthcare
- Thermo Fisher Scientific Inc
- Eppendorf AG
- Bioengineering AG
- Pall Corporation (Danaher Corporation)
- Sartorius AG
- Getinge AB
- Esco Lifesciences Group Ltd
- Infors HT
Key Developments in Bioreactors Market Industry
- October 2022: Getinge AB announced that their bioreactors will support the Dutch government's initiative to produce animal products such as meat and milk proteins directly from animal and microbial cells. This underscores the expanding applications of bioreactors beyond traditional pharmaceutical production, highlighting their potential in the burgeoning field of cellular agriculture.
- May 2022: Pall Corporation announced that its ICELL nano bioreactor assisted the Institute of Biomedicine of Seville (IBIS) in developing viral vectors for CAR-T therapy. This exemplifies the crucial role of advanced bioreactor technology in propelling advancements in cell and gene therapy.
- [Add more recent key developments here with dates and concise descriptions]
Strategic Outlook for Bioreactors Market Market
The bioreactors market is poised for continued growth, driven by technological advancements, expanding applications, and increasing demand from various sectors. Strategic investments in R&D, coupled with collaborations and partnerships, are crucial for success in this competitive market. Focus on developing innovative, cost-effective, and scalable bioreactor solutions will be vital for capturing market share and meeting the growing demands of the biopharmaceutical industry. The increasing adoption of single-use technologies and automation will further shape the market's future trajectory.
Bioreactors Market Segmentation
-
1. Type
- 1.1. Glass
- 1.2. Stainless Steel
- 1.3. Single-use
-
2. Usage
- 2.1. Lab-scale Production
- 2.2. Pilot-scale Production
- 2.3. Full-scale Production
-
3. Scale
- 3.1. 5L-20L
- 3.2. 20L-200L
- 3.3. 200L-1,500L
- 3.4. Above 1,500L
-
4. Control Type
- 4.1. Manual
- 4.2. Automated (MFCs)
Bioreactors Market Segmentation By Geography
-
1. North America
- 1.1. United States
- 1.2. Canada
- 1.3. Mexico
-
2. Europe
- 2.1. Germany
- 2.2. United Kingdom
- 2.3. France
- 2.4. Italy
- 2.5. Spain
- 2.6. Rest of Europe
-
3. Asia Pacific
- 3.1. China
- 3.2. Japan
- 3.3. India
- 3.4. Australia
- 3.5. South Korea
- 3.6. Rest of Asia Pacific
-
4. Middle East and Africa
- 4.1. GCC
- 4.2. South Africa
- 4.3. Rest of Middle East and Africa
-
5. South America
- 5.1. Brazil
- 5.2. Argentina
- 5.3. Rest of South America
Bioreactors Market Regional Market Share
Geographic Coverage of Bioreactors Market
Bioreactors Market REPORT HIGHLIGHTS
| Aspects | Details |
|---|---|
| Study Period | 2020-2034 |
| Base Year | 2025 |
| Estimated Year | 2026 |
| Forecast Period | 2026-2034 |
| Historical Period | 2020-2025 |
| Growth Rate | CAGR of 7.45% from 2020-2034 |
| Segmentation |
|
Table of Contents
- 1. Introduction
- 1.1. Research Scope
- 1.2. Market Segmentation
- 1.3. Research Methodology
- 1.4. Definitions and Assumptions
- 2. Executive Summary
- 2.1. Introduction
- 3. Market Dynamics
- 3.1. Introduction
- 3.2. Market Drivers
- 3.2.1. Growth of Bioreactors in Pharmaceuticals; Technological Advancements in Bioreactors; Adoption of Single-use bioreactors (SUBs) and Hybrid Bioreactors
- 3.3. Market Restrains
- 3.3.1. Concerns Regarding the Use of Single-use Bioreactors (SUBs); Limited Storage Capacity
- 3.4. Market Trends
- 3.4.1. The Single-use Bioreactors Segment is Expected to Have A High Growth Rate During the Forecast Period
- 4. Market Factor Analysis
- 4.1. Porters Five Forces
- 4.2. Supply/Value Chain
- 4.3. PESTEL analysis
- 4.4. Market Entropy
- 4.5. Patent/Trademark Analysis
- 5. Global Bioreactors Market Analysis, Insights and Forecast, 2020-2032
- 5.1. Market Analysis, Insights and Forecast - by Type
- 5.1.1. Glass
- 5.1.2. Stainless Steel
- 5.1.3. Single-use
- 5.2. Market Analysis, Insights and Forecast - by Usage
- 5.2.1. Lab-scale Production
- 5.2.2. Pilot-scale Production
- 5.2.3. Full-scale Production
- 5.3. Market Analysis, Insights and Forecast - by Scale
- 5.3.1. 5L-20L
- 5.3.2. 20L-200L
- 5.3.3. 200L-1,500L
- 5.3.4. Above 1,500L
- 5.4. Market Analysis, Insights and Forecast - by Control Type
- 5.4.1. Manual
- 5.4.2. Automated (MFCs)
- 5.5. Market Analysis, Insights and Forecast - by Region
- 5.5.1. North America
- 5.5.2. Europe
- 5.5.3. Asia Pacific
- 5.5.4. Middle East and Africa
- 5.5.5. South America
- 5.1. Market Analysis, Insights and Forecast - by Type
- 6. North America Bioreactors Market Analysis, Insights and Forecast, 2020-2032
- 6.1. Market Analysis, Insights and Forecast - by Type
- 6.1.1. Glass
- 6.1.2. Stainless Steel
- 6.1.3. Single-use
- 6.2. Market Analysis, Insights and Forecast - by Usage
- 6.2.1. Lab-scale Production
- 6.2.2. Pilot-scale Production
- 6.2.3. Full-scale Production
- 6.3. Market Analysis, Insights and Forecast - by Scale
- 6.3.1. 5L-20L
- 6.3.2. 20L-200L
- 6.3.3. 200L-1,500L
- 6.3.4. Above 1,500L
- 6.4. Market Analysis, Insights and Forecast - by Control Type
- 6.4.1. Manual
- 6.4.2. Automated (MFCs)
- 6.1. Market Analysis, Insights and Forecast - by Type
- 7. Europe Bioreactors Market Analysis, Insights and Forecast, 2020-2032
- 7.1. Market Analysis, Insights and Forecast - by Type
- 7.1.1. Glass
- 7.1.2. Stainless Steel
- 7.1.3. Single-use
- 7.2. Market Analysis, Insights and Forecast - by Usage
- 7.2.1. Lab-scale Production
- 7.2.2. Pilot-scale Production
- 7.2.3. Full-scale Production
- 7.3. Market Analysis, Insights and Forecast - by Scale
- 7.3.1. 5L-20L
- 7.3.2. 20L-200L
- 7.3.3. 200L-1,500L
- 7.3.4. Above 1,500L
- 7.4. Market Analysis, Insights and Forecast - by Control Type
- 7.4.1. Manual
- 7.4.2. Automated (MFCs)
- 7.1. Market Analysis, Insights and Forecast - by Type
- 8. Asia Pacific Bioreactors Market Analysis, Insights and Forecast, 2020-2032
- 8.1. Market Analysis, Insights and Forecast - by Type
- 8.1.1. Glass
- 8.1.2. Stainless Steel
- 8.1.3. Single-use
- 8.2. Market Analysis, Insights and Forecast - by Usage
- 8.2.1. Lab-scale Production
- 8.2.2. Pilot-scale Production
- 8.2.3. Full-scale Production
- 8.3. Market Analysis, Insights and Forecast - by Scale
- 8.3.1. 5L-20L
- 8.3.2. 20L-200L
- 8.3.3. 200L-1,500L
- 8.3.4. Above 1,500L
- 8.4. Market Analysis, Insights and Forecast - by Control Type
- 8.4.1. Manual
- 8.4.2. Automated (MFCs)
- 8.1. Market Analysis, Insights and Forecast - by Type
- 9. Middle East and Africa Bioreactors Market Analysis, Insights and Forecast, 2020-2032
- 9.1. Market Analysis, Insights and Forecast - by Type
- 9.1.1. Glass
- 9.1.2. Stainless Steel
- 9.1.3. Single-use
- 9.2. Market Analysis, Insights and Forecast - by Usage
- 9.2.1. Lab-scale Production
- 9.2.2. Pilot-scale Production
- 9.2.3. Full-scale Production
- 9.3. Market Analysis, Insights and Forecast - by Scale
- 9.3.1. 5L-20L
- 9.3.2. 20L-200L
- 9.3.3. 200L-1,500L
- 9.3.4. Above 1,500L
- 9.4. Market Analysis, Insights and Forecast - by Control Type
- 9.4.1. Manual
- 9.4.2. Automated (MFCs)
- 9.1. Market Analysis, Insights and Forecast - by Type
- 10. South America Bioreactors Market Analysis, Insights and Forecast, 2020-2032
- 10.1. Market Analysis, Insights and Forecast - by Type
- 10.1.1. Glass
- 10.1.2. Stainless Steel
- 10.1.3. Single-use
- 10.2. Market Analysis, Insights and Forecast - by Usage
- 10.2.1. Lab-scale Production
- 10.2.2. Pilot-scale Production
- 10.2.3. Full-scale Production
- 10.3. Market Analysis, Insights and Forecast - by Scale
- 10.3.1. 5L-20L
- 10.3.2. 20L-200L
- 10.3.3. 200L-1,500L
- 10.3.4. Above 1,500L
- 10.4. Market Analysis, Insights and Forecast - by Control Type
- 10.4.1. Manual
- 10.4.2. Automated (MFCs)
- 10.1. Market Analysis, Insights and Forecast - by Type
- 11. Competitive Analysis
- 11.1. Global Market Share Analysis 2025
- 11.2. Company Profiles
- 11.2.1 Solaris Biotech
- 11.2.1.1. Overview
- 11.2.1.2. Products
- 11.2.1.3. SWOT Analysis
- 11.2.1.4. Recent Developments
- 11.2.1.5. Financials (Based on Availability)
- 11.2.2 Merck KGaA
- 11.2.2.1. Overview
- 11.2.2.2. Products
- 11.2.2.3. SWOT Analysis
- 11.2.2.4. Recent Developments
- 11.2.2.5. Financials (Based on Availability)
- 11.2.3 Solida Biotech GmBH
- 11.2.3.1. Overview
- 11.2.3.2. Products
- 11.2.3.3. SWOT Analysis
- 11.2.3.4. Recent Developments
- 11.2.3.5. Financials (Based on Availability)
- 11.2.4 GE Healthcare
- 11.2.4.1. Overview
- 11.2.4.2. Products
- 11.2.4.3. SWOT Analysis
- 11.2.4.4. Recent Developments
- 11.2.4.5. Financials (Based on Availability)
- 11.2.5 Thermo Fisher Scientific Inc
- 11.2.5.1. Overview
- 11.2.5.2. Products
- 11.2.5.3. SWOT Analysis
- 11.2.5.4. Recent Developments
- 11.2.5.5. Financials (Based on Availability)
- 11.2.6 Eppendorf AG
- 11.2.6.1. Overview
- 11.2.6.2. Products
- 11.2.6.3. SWOT Analysis
- 11.2.6.4. Recent Developments
- 11.2.6.5. Financials (Based on Availability)
- 11.2.7 Bioengineering AG
- 11.2.7.1. Overview
- 11.2.7.2. Products
- 11.2.7.3. SWOT Analysis
- 11.2.7.4. Recent Developments
- 11.2.7.5. Financials (Based on Availability)
- 11.2.8 Pall Corporation (Danaher Corporation)
- 11.2.8.1. Overview
- 11.2.8.2. Products
- 11.2.8.3. SWOT Analysis
- 11.2.8.4. Recent Developments
- 11.2.8.5. Financials (Based on Availability)
- 11.2.9 Sartorius AG
- 11.2.9.1. Overview
- 11.2.9.2. Products
- 11.2.9.3. SWOT Analysis
- 11.2.9.4. Recent Developments
- 11.2.9.5. Financials (Based on Availability)
- 11.2.10 Getinge AB
- 11.2.10.1. Overview
- 11.2.10.2. Products
- 11.2.10.3. SWOT Analysis
- 11.2.10.4. Recent Developments
- 11.2.10.5. Financials (Based on Availability)
- 11.2.11 Esco Lifesciences Group Ltd
- 11.2.11.1. Overview
- 11.2.11.2. Products
- 11.2.11.3. SWOT Analysis
- 11.2.11.4. Recent Developments
- 11.2.11.5. Financials (Based on Availability)
- 11.2.12 Infors HT
- 11.2.12.1. Overview
- 11.2.12.2. Products
- 11.2.12.3. SWOT Analysis
- 11.2.12.4. Recent Developments
- 11.2.12.5. Financials (Based on Availability)
- 11.2.1 Solaris Biotech
List of Figures
- Figure 1: Global Bioreactors Market Revenue Breakdown (Million, %) by Region 2025 & 2033
- Figure 2: North America Bioreactors Market Revenue (Million), by Type 2025 & 2033
- Figure 3: North America Bioreactors Market Revenue Share (%), by Type 2025 & 2033
- Figure 4: North America Bioreactors Market Revenue (Million), by Usage 2025 & 2033
- Figure 5: North America Bioreactors Market Revenue Share (%), by Usage 2025 & 2033
- Figure 6: North America Bioreactors Market Revenue (Million), by Scale 2025 & 2033
- Figure 7: North America Bioreactors Market Revenue Share (%), by Scale 2025 & 2033
- Figure 8: North America Bioreactors Market Revenue (Million), by Control Type 2025 & 2033
- Figure 9: North America Bioreactors Market Revenue Share (%), by Control Type 2025 & 2033
- Figure 10: North America Bioreactors Market Revenue (Million), by Country 2025 & 2033
- Figure 11: North America Bioreactors Market Revenue Share (%), by Country 2025 & 2033
- Figure 12: Europe Bioreactors Market Revenue (Million), by Type 2025 & 2033
- Figure 13: Europe Bioreactors Market Revenue Share (%), by Type 2025 & 2033
- Figure 14: Europe Bioreactors Market Revenue (Million), by Usage 2025 & 2033
- Figure 15: Europe Bioreactors Market Revenue Share (%), by Usage 2025 & 2033
- Figure 16: Europe Bioreactors Market Revenue (Million), by Scale 2025 & 2033
- Figure 17: Europe Bioreactors Market Revenue Share (%), by Scale 2025 & 2033
- Figure 18: Europe Bioreactors Market Revenue (Million), by Control Type 2025 & 2033
- Figure 19: Europe Bioreactors Market Revenue Share (%), by Control Type 2025 & 2033
- Figure 20: Europe Bioreactors Market Revenue (Million), by Country 2025 & 2033
- Figure 21: Europe Bioreactors Market Revenue Share (%), by Country 2025 & 2033
- Figure 22: Asia Pacific Bioreactors Market Revenue (Million), by Type 2025 & 2033
- Figure 23: Asia Pacific Bioreactors Market Revenue Share (%), by Type 2025 & 2033
- Figure 24: Asia Pacific Bioreactors Market Revenue (Million), by Usage 2025 & 2033
- Figure 25: Asia Pacific Bioreactors Market Revenue Share (%), by Usage 2025 & 2033
- Figure 26: Asia Pacific Bioreactors Market Revenue (Million), by Scale 2025 & 2033
- Figure 27: Asia Pacific Bioreactors Market Revenue Share (%), by Scale 2025 & 2033
- Figure 28: Asia Pacific Bioreactors Market Revenue (Million), by Control Type 2025 & 2033
- Figure 29: Asia Pacific Bioreactors Market Revenue Share (%), by Control Type 2025 & 2033
- Figure 30: Asia Pacific Bioreactors Market Revenue (Million), by Country 2025 & 2033
- Figure 31: Asia Pacific Bioreactors Market Revenue Share (%), by Country 2025 & 2033
- Figure 32: Middle East and Africa Bioreactors Market Revenue (Million), by Type 2025 & 2033
- Figure 33: Middle East and Africa Bioreactors Market Revenue Share (%), by Type 2025 & 2033
- Figure 34: Middle East and Africa Bioreactors Market Revenue (Million), by Usage 2025 & 2033
- Figure 35: Middle East and Africa Bioreactors Market Revenue Share (%), by Usage 2025 & 2033
- Figure 36: Middle East and Africa Bioreactors Market Revenue (Million), by Scale 2025 & 2033
- Figure 37: Middle East and Africa Bioreactors Market Revenue Share (%), by Scale 2025 & 2033
- Figure 38: Middle East and Africa Bioreactors Market Revenue (Million), by Control Type 2025 & 2033
- Figure 39: Middle East and Africa Bioreactors Market Revenue Share (%), by Control Type 2025 & 2033
- Figure 40: Middle East and Africa Bioreactors Market Revenue (Million), by Country 2025 & 2033
- Figure 41: Middle East and Africa Bioreactors Market Revenue Share (%), by Country 2025 & 2033
- Figure 42: South America Bioreactors Market Revenue (Million), by Type 2025 & 2033
- Figure 43: South America Bioreactors Market Revenue Share (%), by Type 2025 & 2033
- Figure 44: South America Bioreactors Market Revenue (Million), by Usage 2025 & 2033
- Figure 45: South America Bioreactors Market Revenue Share (%), by Usage 2025 & 2033
- Figure 46: South America Bioreactors Market Revenue (Million), by Scale 2025 & 2033
- Figure 47: South America Bioreactors Market Revenue Share (%), by Scale 2025 & 2033
- Figure 48: South America Bioreactors Market Revenue (Million), by Control Type 2025 & 2033
- Figure 49: South America Bioreactors Market Revenue Share (%), by Control Type 2025 & 2033
- Figure 50: South America Bioreactors Market Revenue (Million), by Country 2025 & 2033
- Figure 51: South America Bioreactors Market Revenue Share (%), by Country 2025 & 2033
List of Tables
- Table 1: Global Bioreactors Market Revenue Million Forecast, by Type 2020 & 2033
- Table 2: Global Bioreactors Market Revenue Million Forecast, by Usage 2020 & 2033
- Table 3: Global Bioreactors Market Revenue Million Forecast, by Scale 2020 & 2033
- Table 4: Global Bioreactors Market Revenue Million Forecast, by Control Type 2020 & 2033
- Table 5: Global Bioreactors Market Revenue Million Forecast, by Region 2020 & 2033
- Table 6: Global Bioreactors Market Revenue Million Forecast, by Type 2020 & 2033
- Table 7: Global Bioreactors Market Revenue Million Forecast, by Usage 2020 & 2033
- Table 8: Global Bioreactors Market Revenue Million Forecast, by Scale 2020 & 2033
- Table 9: Global Bioreactors Market Revenue Million Forecast, by Control Type 2020 & 2033
- Table 10: Global Bioreactors Market Revenue Million Forecast, by Country 2020 & 2033
- Table 11: United States Bioreactors Market Revenue (Million) Forecast, by Application 2020 & 2033
- Table 12: Canada Bioreactors Market Revenue (Million) Forecast, by Application 2020 & 2033
- Table 13: Mexico Bioreactors Market Revenue (Million) Forecast, by Application 2020 & 2033
- Table 14: Global Bioreactors Market Revenue Million Forecast, by Type 2020 & 2033
- Table 15: Global Bioreactors Market Revenue Million Forecast, by Usage 2020 & 2033
- Table 16: Global Bioreactors Market Revenue Million Forecast, by Scale 2020 & 2033
- Table 17: Global Bioreactors Market Revenue Million Forecast, by Control Type 2020 & 2033
- Table 18: Global Bioreactors Market Revenue Million Forecast, by Country 2020 & 2033
- Table 19: Germany Bioreactors Market Revenue (Million) Forecast, by Application 2020 & 2033
- Table 20: United Kingdom Bioreactors Market Revenue (Million) Forecast, by Application 2020 & 2033
- Table 21: France Bioreactors Market Revenue (Million) Forecast, by Application 2020 & 2033
- Table 22: Italy Bioreactors Market Revenue (Million) Forecast, by Application 2020 & 2033
- Table 23: Spain Bioreactors Market Revenue (Million) Forecast, by Application 2020 & 2033
- Table 24: Rest of Europe Bioreactors Market Revenue (Million) Forecast, by Application 2020 & 2033
- Table 25: Global Bioreactors Market Revenue Million Forecast, by Type 2020 & 2033
- Table 26: Global Bioreactors Market Revenue Million Forecast, by Usage 2020 & 2033
- Table 27: Global Bioreactors Market Revenue Million Forecast, by Scale 2020 & 2033
- Table 28: Global Bioreactors Market Revenue Million Forecast, by Control Type 2020 & 2033
- Table 29: Global Bioreactors Market Revenue Million Forecast, by Country 2020 & 2033
- Table 30: China Bioreactors Market Revenue (Million) Forecast, by Application 2020 & 2033
- Table 31: Japan Bioreactors Market Revenue (Million) Forecast, by Application 2020 & 2033
- Table 32: India Bioreactors Market Revenue (Million) Forecast, by Application 2020 & 2033
- Table 33: Australia Bioreactors Market Revenue (Million) Forecast, by Application 2020 & 2033
- Table 34: South Korea Bioreactors Market Revenue (Million) Forecast, by Application 2020 & 2033
- Table 35: Rest of Asia Pacific Bioreactors Market Revenue (Million) Forecast, by Application 2020 & 2033
- Table 36: Global Bioreactors Market Revenue Million Forecast, by Type 2020 & 2033
- Table 37: Global Bioreactors Market Revenue Million Forecast, by Usage 2020 & 2033
- Table 38: Global Bioreactors Market Revenue Million Forecast, by Scale 2020 & 2033
- Table 39: Global Bioreactors Market Revenue Million Forecast, by Control Type 2020 & 2033
- Table 40: Global Bioreactors Market Revenue Million Forecast, by Country 2020 & 2033
- Table 41: GCC Bioreactors Market Revenue (Million) Forecast, by Application 2020 & 2033
- Table 42: South Africa Bioreactors Market Revenue (Million) Forecast, by Application 2020 & 2033
- Table 43: Rest of Middle East and Africa Bioreactors Market Revenue (Million) Forecast, by Application 2020 & 2033
- Table 44: Global Bioreactors Market Revenue Million Forecast, by Type 2020 & 2033
- Table 45: Global Bioreactors Market Revenue Million Forecast, by Usage 2020 & 2033
- Table 46: Global Bioreactors Market Revenue Million Forecast, by Scale 2020 & 2033
- Table 47: Global Bioreactors Market Revenue Million Forecast, by Control Type 2020 & 2033
- Table 48: Global Bioreactors Market Revenue Million Forecast, by Country 2020 & 2033
- Table 49: Brazil Bioreactors Market Revenue (Million) Forecast, by Application 2020 & 2033
- Table 50: Argentina Bioreactors Market Revenue (Million) Forecast, by Application 2020 & 2033
- Table 51: Rest of South America Bioreactors Market Revenue (Million) Forecast, by Application 2020 & 2033
Frequently Asked Questions
1. What is the projected Compound Annual Growth Rate (CAGR) of the Bioreactors Market?
The projected CAGR is approximately 7.45%.
2. Which companies are prominent players in the Bioreactors Market?
Key companies in the market include Solaris Biotech, Merck KGaA, Solida Biotech GmBH, GE Healthcare, Thermo Fisher Scientific Inc, Eppendorf AG, Bioengineering AG, Pall Corporation (Danaher Corporation), Sartorius AG, Getinge AB, Esco Lifesciences Group Ltd, Infors HT.
3. What are the main segments of the Bioreactors Market?
The market segments include Type, Usage, Scale, Control Type.
4. Can you provide details about the market size?
The market size is estimated to be USD 5.31 Million as of 2022.
5. What are some drivers contributing to market growth?
Growth of Bioreactors in Pharmaceuticals; Technological Advancements in Bioreactors; Adoption of Single-use bioreactors (SUBs) and Hybrid Bioreactors.
6. What are the notable trends driving market growth?
The Single-use Bioreactors Segment is Expected to Have A High Growth Rate During the Forecast Period.
7. Are there any restraints impacting market growth?
Concerns Regarding the Use of Single-use Bioreactors (SUBs); Limited Storage Capacity.
8. Can you provide examples of recent developments in the market?
October 2022: Getinge AB announced that their bioreactors will support the Dutch government's initiative to produce animal products such as meat and milk proteins directly from animal and microbial cells.
9. What pricing options are available for accessing the report?
Pricing options include single-user, multi-user, and enterprise licenses priced at USD 4750, USD 5250, and USD 8750 respectively.
10. Is the market size provided in terms of value or volume?
The market size is provided in terms of value, measured in Million.
11. Are there any specific market keywords associated with the report?
Yes, the market keyword associated with the report is "Bioreactors Market," which aids in identifying and referencing the specific market segment covered.
12. How do I determine which pricing option suits my needs best?
The pricing options vary based on user requirements and access needs. Individual users may opt for single-user licenses, while businesses requiring broader access may choose multi-user or enterprise licenses for cost-effective access to the report.
13. Are there any additional resources or data provided in the Bioreactors Market report?
While the report offers comprehensive insights, it's advisable to review the specific contents or supplementary materials provided to ascertain if additional resources or data are available.
14. How can I stay updated on further developments or reports in the Bioreactors Market?
To stay informed about further developments, trends, and reports in the Bioreactors Market, consider subscribing to industry newsletters, following relevant companies and organizations, or regularly checking reputable industry news sources and publications.
Methodology
Step 1 - Identification of Relevant Samples Size from Population Database


Step 2 - Approaches for Defining Global Market Size (Value, Volume* & Price*)

Note*: In applicable scenarios
Step 3 - Data Sources
Primary Research
- Web Analytics
- Survey Reports
- Research Institute
- Latest Research Reports
- Opinion Leaders
Secondary Research
- Annual Reports
- White Paper
- Latest Press Release
- Industry Association
- Paid Database
- Investor Presentations

Step 4 - Data Triangulation
Involves using different sources of information in order to increase the validity of a study
These sources are likely to be stakeholders in a program - participants, other researchers, program staff, other community members, and so on.
Then we put all data in single framework & apply various statistical tools to find out the dynamic on the market.
During the analysis stage, feedback from the stakeholder groups would be compared to determine areas of agreement as well as areas of divergence