Key Insights
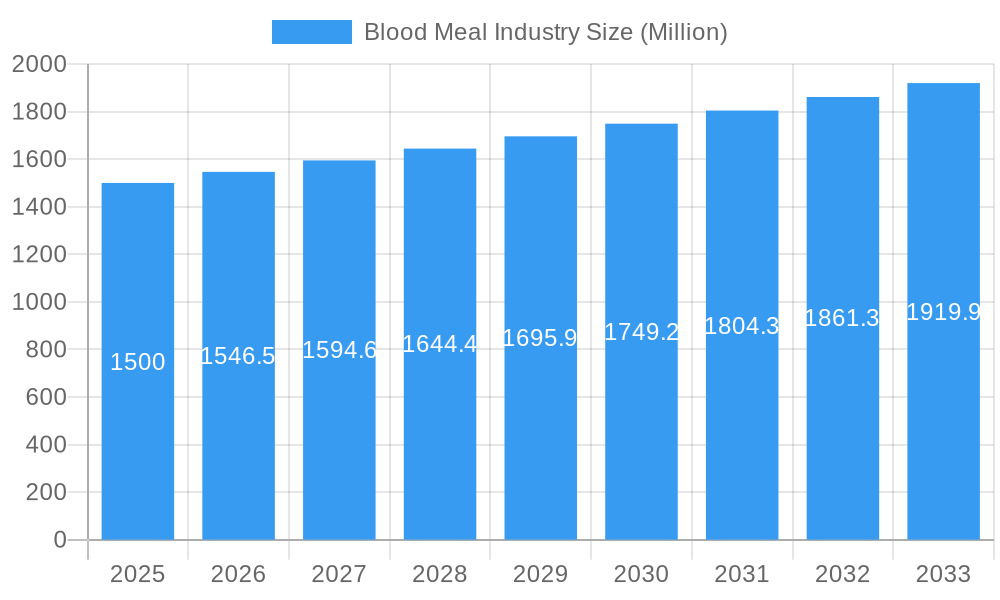
The global blood meal market, valued at approximately $1.29 billion in 2025, is projected for robust expansion. Driven by escalating demand for sustainable and cost-effective animal feed, the market is anticipated to achieve a compound annual growth rate (CAGR) of 3.63% from 2025 to 2033. Key growth catalysts include a rising global population necessitating increased protein-rich animal feed and growing adoption of sustainable agricultural practices. Blood meal's utility as a natural fertilizer and pest deterrent further fuels market growth. Challenges include stringent regulations for safety and disease prevention, alongside price volatility influenced by livestock populations and raw material availability. The market is segmented by blood source (porcine, poultry, ruminant) and application (poultry feed, porcine feed, ruminant feed, aqua feed, natural pest deterrent, organic fertilizer). North America and Europe currently dominate, with the Asia-Pacific region poised for significant expansion due to burgeoning livestock farming and aquaculture industries. Moderate competition exists among key players like Allanasons Pvt Ltd, Valley Proteins Inc., and Darling Ingredients.
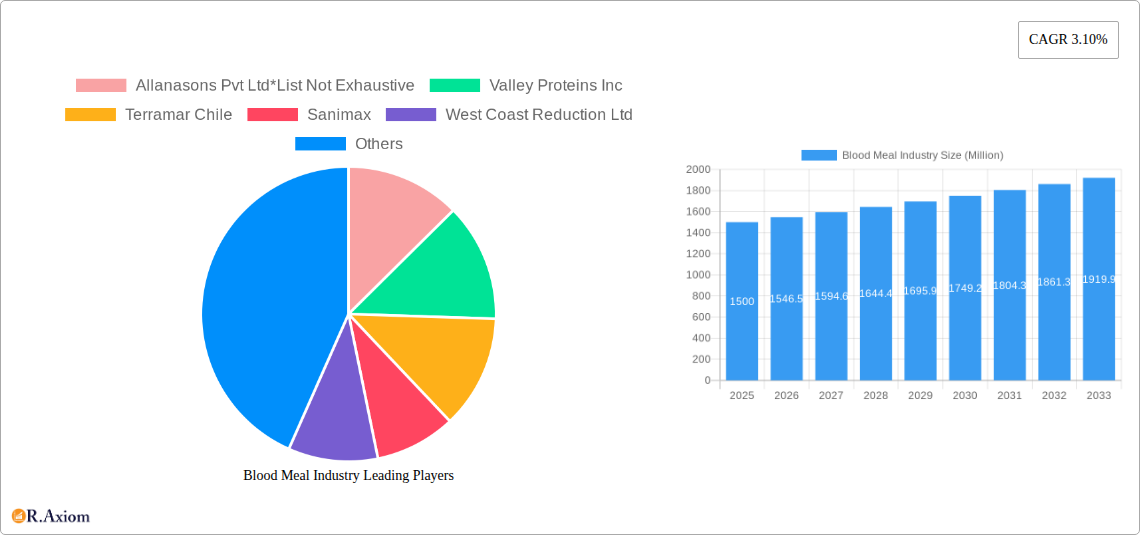
Blood Meal Industry Market Size (In Billion)
The diverse applications of blood meal across agricultural sectors present substantial growth prospects. Ongoing research to optimize nutritional value and develop innovative uses will enhance market appeal. Prioritizing standardization, quality control, and traceability is crucial for sustained consumer confidence. Industry players are investing in efficient production technologies and minimizing environmental impact. The future trajectory of the blood meal market depends on adaptation to evolving consumer preferences, regulatory landscapes, and alternative protein advancements, while preserving its cost-effectiveness and sustainability advantages.
Blood Meal Industry Company Market Share
Global Blood Meal Market Analysis: 2025-2033 Outlook
This comprehensive report offers in-depth analysis of the global blood meal industry, providing critical insights for stakeholders, investors, and researchers. Covering the forecast period from 2025 to 2033, with a base year of 2025, this report details market dynamics, growth drivers, challenges, and future opportunities. Extensive primary and secondary research underpins this robust market overview. The estimated market size for 2025 is projected at $1.29 billion. Granular segmentation includes analysis by source materials (porcine, poultry, ruminant blood) and applications (poultry feed, porcine feed, ruminant feed, aqua feed, natural pest deterrent, organic fertilizer).
Blood Meal Industry Market Concentration & Innovation
The blood meal industry exhibits a moderately concentrated market structure, with several large players controlling a significant share of the global market. While exact market share data for each company is not publicly available for all players, key players like Darling Ingredients and Valley Proteins Inc hold substantial market positions. Market concentration is influenced by factors including economies of scale in production and processing, access to raw materials, and global distribution networks. Innovation in the industry is driven by the increasing demand for sustainable and efficient protein sources. This demand stimulates research and development focused on enhancing blood meal quality, improving its nutritional profile, and expanding its applications. The regulatory landscape plays a significant role; adherence to food safety regulations and environmental standards necessitates continuous improvement in processing techniques and product quality. Product substitutes, such as other protein sources, represent competitive pressure. This pressure requires producers to constantly innovate, and enhance the competitiveness of blood meal. Mergers and acquisitions (M&A) activities reflect the industry's consolidation trend. Major deals, such as Darling Ingredients' acquisitions of Fasa Group (USD 560 Million in 2022) and EnviroFlight (2020), signify a strategic push towards market expansion and technological advancement. These M&A events demonstrate an increasing focus on incorporating newer, more sustainable processes.
- Market Share: Darling Ingredients and Valley Proteins Inc hold significant market shares, with xx% and xx%, respectively (estimated).
- M&A Deal Value (2019-2024): Estimated at xx Million USD.
Blood Meal Industry Industry Trends & Insights
The blood meal market is experiencing steady growth, driven by several key factors. The rising global population and growing demand for animal protein are major contributors to this growth. The increasing focus on sustainable and cost-effective animal feed solutions is driving the demand for blood meal as a protein source. Technological advancements in blood meal processing, leading to improved product quality and consistency, are also shaping the market landscape. Consumer preferences for environmentally friendly and naturally sourced animal feed products are influencing the industry, favoring blood meal as a sustainable alternative. The competitive landscape is characterized by both large multinational corporations and smaller regional players. Competition centers on price, quality, and product differentiation. The Compound Annual Growth Rate (CAGR) during the historical period (2019-2024) was approximately xx%, and it's projected to be xx% during the forecast period (2025-2033). Market penetration is highest in regions with significant livestock populations and established animal feed industries.
Dominant Markets & Segments in Blood Meal Industry
The blood meal market displays regional variations in dominance, with regions such as North America and Europe currently leading in terms of consumption and production. This leadership is primarily attributed to the presence of large-scale livestock operations, well-established animal feed industries, and robust regulatory frameworks. However, regions in Asia and South America are expected to experience significant growth in the coming years due to increasing livestock populations, growing demand for animal protein, and supportive government policies. Within segmentations:
- Source: Poultry blood currently holds the largest market share due to high poultry production volumes, followed by porcine and ruminant blood.
- Application: Poultry feed constitutes the largest application segment due to its wide usage in poultry farming.
Key Drivers:
- North America: Strong livestock industry, established infrastructure, and advanced processing technologies.
- Europe: High animal welfare standards, focus on sustainable feed solutions, and strong regulatory frameworks.
- Asia: Rapidly growing livestock sector, increasing demand for protein-rich feed, and supportive government policies to promote sustainable agriculture.
Blood Meal Industry Product Developments
Recent innovations focus on enhancing the nutritional profile of blood meal through advanced processing technologies, improving its digestibility and palatability for animal feed. This includes methods to reduce undesirable odors and improve handling properties. New applications are being explored, such as utilizing blood meal in organic fertilizers, expanding its market potential beyond animal feed. The competitive advantage lies in offering high-quality blood meal with consistent composition, enhanced nutritional value, and cost-effectiveness. Technological trends include automation in processing to improve efficiency and reduce environmental impact.
Report Scope & Segmentation Analysis
This report provides a comprehensive segmentation analysis of the blood meal industry, covering the following:
Source:
- Porcine Blood: This segment is characterized by xx Million USD in 2025, showcasing xx% CAGR during 2025-2033. Competition is moderate.
- Poultry Blood: This segment is the largest, expected to be valued at xx Million USD in 2025, with xx% CAGR over the forecast period. Competition is high.
- Ruminant Blood: This segment holds a smaller share, projected at xx Million USD in 2025, with a xx% CAGR during 2025-2033. Competition is moderate.
Application:
- Poultry Feed: The largest segment, exhibiting high growth potential.
- Porcine Feed: A significant segment, with steady growth projections.
- Ruminant Feed: A growing segment, driven by increasing ruminant livestock populations.
- Aqua Feed: A niche segment with moderate growth potential.
- Natural Pest Deterrent & Organic Fertilizer: Emerging segments with high growth potential.
Key Drivers of Blood Meal Industry Growth
The blood meal industry's growth is fueled by several key factors: the rising global demand for animal protein, which necessitates cost-effective and sustainable feed solutions. The increasing focus on environmentally friendly agricultural practices promotes blood meal as a byproduct utilization strategy, reducing waste and enhancing sustainability. Government regulations promoting sustainable agriculture and responsible waste management create favorable conditions for the industry's expansion. Furthermore, technological advancements in processing and improved product quality contribute to the market's growth.
Challenges in the Blood Meal Industry Sector
Challenges faced by the blood meal industry include fluctuating raw material availability due to variations in livestock production. Strict regulations concerning food safety and environmental standards require continuous investment in processing technologies and quality control measures. Competition from other protein sources and substitute products necessitates continuous innovation to maintain market share. These factors together place downward pressure on margins and necessitate constant optimization.
Emerging Opportunities in Blood Meal Industry
Emerging opportunities include expansion into new geographical markets with growing livestock populations and developing economies. The development of new applications for blood meal, such as in organic fertilizers and biomaterials, presents lucrative growth prospects. The industry can also leverage technological advancements for more efficient processing and improved product quality to stay ahead of the competition.
Leading Players in the Blood Meal Industry Market
- Allanasons Pvt Ltd
- Valley Proteins Inc
- Terramar Chile
- Sanimax
- West Coast Reduction Ltd
- Darling Ingredients
- Boyer Valley Company LLC
- Agro-industrial Complex Backa Topola LTD
- The Fetrell Company
Key Developments in Blood Meal Industry Industry
- May 2022: Darling Ingredients acquired Fasa Group for USD 560 million, significantly expanding its geographical reach and product offerings. This acquisition solidified Darling Ingredient's position as a leading player, influencing market consolidation and competition.
- January 2020: Darling Ingredients acquired 100% equity in EnviroFlight, boosting its investment in sustainable and innovative protein solutions. This strategic move showcased Darling Ingredient's commitment to innovation and sustainability within the blood meal market.
Strategic Outlook for Blood Meal Industry Market
The blood meal industry's future outlook is positive, driven by continued global demand for animal protein and the increasing emphasis on sustainable agriculture. Strategic opportunities lie in expanding into new markets, developing innovative applications, and leveraging technological advancements to enhance product quality and processing efficiency. Companies focusing on sustainable practices and product innovation will be well-positioned for future growth.
Blood Meal Industry Segmentation
- 1. Production Analysis
- 2. Consumption Analysis
- 3. Import Market Analysis (Value & Volume)
- 4. Export Market Analysis (Value & Volume)
- 5. Price Trend Analysis
Blood Meal Industry Segmentation By Geography
-
1. North America
- 1.1. United States
- 1.2. Canada
- 1.3. Mexico
-
2. South America
- 2.1. Brazil
- 2.2. Argentina
- 2.3. Rest of South America
-
3. Europe
- 3.1. United Kingdom
- 3.2. Germany
- 3.3. France
- 3.4. Italy
- 3.5. Spain
- 3.6. Russia
- 3.7. Benelux
- 3.8. Nordics
- 3.9. Rest of Europe
-
4. Middle East & Africa
- 4.1. Turkey
- 4.2. Israel
- 4.3. GCC
- 4.4. North Africa
- 4.5. South Africa
- 4.6. Rest of Middle East & Africa
-
5. Asia Pacific
- 5.1. China
- 5.2. India
- 5.3. Japan
- 5.4. South Korea
- 5.5. ASEAN
- 5.6. Oceania
- 5.7. Rest of Asia Pacific
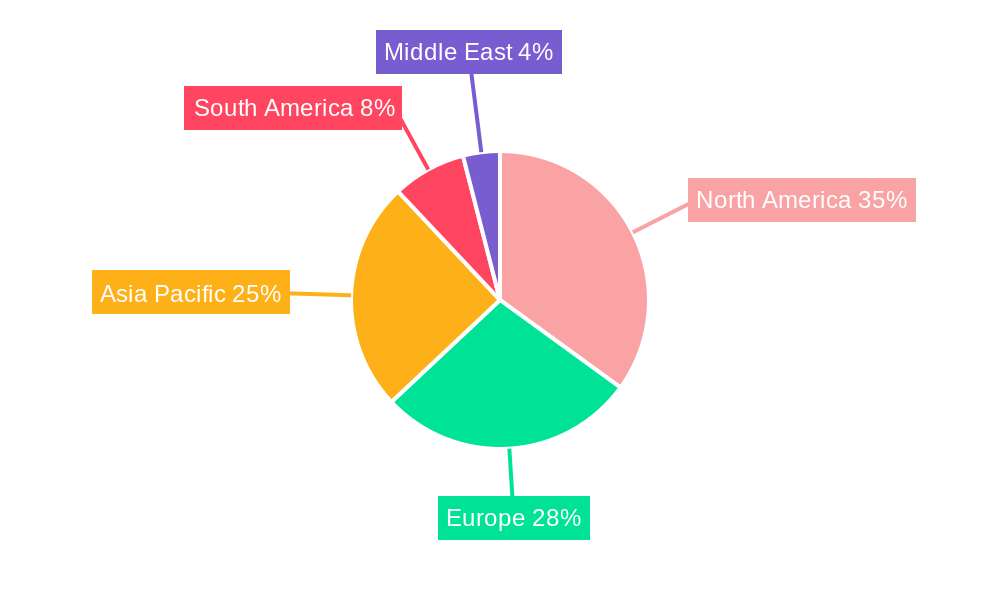
Blood Meal Industry Regional Market Share
Geographic Coverage of Blood Meal Industry
Blood Meal Industry REPORT HIGHLIGHTS
| Aspects | Details |
|---|---|
| Study Period | 2020-2034 |
| Base Year | 2025 |
| Estimated Year | 2026 |
| Forecast Period | 2026-2034 |
| Historical Period | 2020-2025 |
| Growth Rate | CAGR of 3.63% from 2020-2034 |
| Segmentation |
|
Table of Contents
- 1. Introduction
- 1.1. Research Scope
- 1.2. Market Segmentation
- 1.3. Research Objective
- 1.4. Definitions and Assumptions
- 2. Executive Summary
- 2.1. Market Snapshot
- 3. Market Dynamics
- 3.1. Market Drivers
- 3.2. Market Restrains
- 3.3. Market Trends
- 3.4. Market Opportunities
- 4. Market Factor Analysis
- 4.1. Porters Five Forces
- 4.1.1. Bargaining Power of Suppliers
- 4.1.2. Bargaining Power of Buyers
- 4.1.3. Threat of New Entrants
- 4.1.4. Threat of Substitutes
- 4.1.5. Competitive Rivalry
- 4.2. PESTEL analysis
- 4.3. BCG Analysis
- 4.3.1. Stars (High Growth, High Market Share)
- 4.3.2. Cash Cows (Low Growth, High Market Share)
- 4.3.3. Question Mark (High Growth, Low Market Share)
- 4.3.4. Dogs (Low Growth, Low Market Share)
- 4.4. Ansoff Matrix Analysis
- 4.5. Supply Chain Analysis
- 4.6. Regulatory Landscape
- 4.7. Current Market Potential and Opportunity Assessment (TAM–SAM–SOM Framework)
- 4.8. RAX Analyst Note
- 4.1. Porters Five Forces
- 5. Market Analysis, Insights and Forecast 2021-2033
- 5.1. Market Analysis, Insights and Forecast - by Production Analysis
- 5.2. Market Analysis, Insights and Forecast - by Consumption Analysis
- 5.3. Market Analysis, Insights and Forecast - by Import Market Analysis (Value & Volume)
- 5.4. Market Analysis, Insights and Forecast - by Export Market Analysis (Value & Volume)
- 5.5. Market Analysis, Insights and Forecast - by Price Trend Analysis
- 5.6. Market Analysis, Insights and Forecast - by Region
- 5.6.1. North America
- 5.6.2. South America
- 5.6.3. Europe
- 5.6.4. Middle East & Africa
- 5.6.5. Asia Pacific
- 6. Global Blood Meal Industry Analysis, Insights and Forecast, 2021-2033
- 6.1. Market Analysis, Insights and Forecast - by Production Analysis
- 6.2. Market Analysis, Insights and Forecast - by Consumption Analysis
- 6.3. Market Analysis, Insights and Forecast - by Import Market Analysis (Value & Volume)
- 6.4. Market Analysis, Insights and Forecast - by Export Market Analysis (Value & Volume)
- 6.5. Market Analysis, Insights and Forecast - by Price Trend Analysis
- 7. North America Blood Meal Industry Analysis, Insights and Forecast, 2020-2032
- 7.1. Market Analysis, Insights and Forecast - by Production Analysis
- 7.2. Market Analysis, Insights and Forecast - by Consumption Analysis
- 7.3. Market Analysis, Insights and Forecast - by Import Market Analysis (Value & Volume)
- 7.4. Market Analysis, Insights and Forecast - by Export Market Analysis (Value & Volume)
- 7.5. Market Analysis, Insights and Forecast - by Price Trend Analysis
- 8. South America Blood Meal Industry Analysis, Insights and Forecast, 2020-2032
- 8.1. Market Analysis, Insights and Forecast - by Production Analysis
- 8.2. Market Analysis, Insights and Forecast - by Consumption Analysis
- 8.3. Market Analysis, Insights and Forecast - by Import Market Analysis (Value & Volume)
- 8.4. Market Analysis, Insights and Forecast - by Export Market Analysis (Value & Volume)
- 8.5. Market Analysis, Insights and Forecast - by Price Trend Analysis
- 9. Europe Blood Meal Industry Analysis, Insights and Forecast, 2020-2032
- 9.1. Market Analysis, Insights and Forecast - by Production Analysis
- 9.2. Market Analysis, Insights and Forecast - by Consumption Analysis
- 9.3. Market Analysis, Insights and Forecast - by Import Market Analysis (Value & Volume)
- 9.4. Market Analysis, Insights and Forecast - by Export Market Analysis (Value & Volume)
- 9.5. Market Analysis, Insights and Forecast - by Price Trend Analysis
- 10. Middle East & Africa Blood Meal Industry Analysis, Insights and Forecast, 2020-2032
- 10.1. Market Analysis, Insights and Forecast - by Production Analysis
- 10.2. Market Analysis, Insights and Forecast - by Consumption Analysis
- 10.3. Market Analysis, Insights and Forecast - by Import Market Analysis (Value & Volume)
- 10.4. Market Analysis, Insights and Forecast - by Export Market Analysis (Value & Volume)
- 10.5. Market Analysis, Insights and Forecast - by Price Trend Analysis
- 11. Asia Pacific Blood Meal Industry Analysis, Insights and Forecast, 2020-2032
- 11.1. Market Analysis, Insights and Forecast - by Production Analysis
- 11.2. Market Analysis, Insights and Forecast - by Consumption Analysis
- 11.3. Market Analysis, Insights and Forecast - by Import Market Analysis (Value & Volume)
- 11.4. Market Analysis, Insights and Forecast - by Export Market Analysis (Value & Volume)
- 11.5. Market Analysis, Insights and Forecast - by Price Trend Analysis
- 12. Competitive Analysis
- 12.1. Company Profiles
- 12.1.1 Allanasons Pvt Ltd*List Not Exhaustive
- 12.1.1.1. Company Overview
- 12.1.1.2. Products
- 12.1.1.3. Company Financials
- 12.1.1.4. SWOT Analysis
- 12.1.2 Valley Proteins Inc
- 12.1.2.1. Company Overview
- 12.1.2.2. Products
- 12.1.2.3. Company Financials
- 12.1.2.4. SWOT Analysis
- 12.1.3 Terramar Chile
- 12.1.3.1. Company Overview
- 12.1.3.2. Products
- 12.1.3.3. Company Financials
- 12.1.3.4. SWOT Analysis
- 12.1.4 Sanimax
- 12.1.4.1. Company Overview
- 12.1.4.2. Products
- 12.1.4.3. Company Financials
- 12.1.4.4. SWOT Analysis
- 12.1.5 West Coast Reduction Ltd
- 12.1.5.1. Company Overview
- 12.1.5.2. Products
- 12.1.5.3. Company Financials
- 12.1.5.4. SWOT Analysis
- 12.1.6 Darling Ingredients
- 12.1.6.1. Company Overview
- 12.1.6.2. Products
- 12.1.6.3. Company Financials
- 12.1.6.4. SWOT Analysis
- 12.1.7 Boyer Valley Company LLC
- 12.1.7.1. Company Overview
- 12.1.7.2. Products
- 12.1.7.3. Company Financials
- 12.1.7.4. SWOT Analysis
- 12.1.8 Agro-industrial Complex Backa Topola LTD
- 12.1.8.1. Company Overview
- 12.1.8.2. Products
- 12.1.8.3. Company Financials
- 12.1.8.4. SWOT Analysis
- 12.1.9 The Fetrell Company
- 12.1.9.1. Company Overview
- 12.1.9.2. Products
- 12.1.9.3. Company Financials
- 12.1.9.4. SWOT Analysis
- 12.1.1 Allanasons Pvt Ltd*List Not Exhaustive
- 12.2. Market Entropy
- 12.2.1 Company's Key Areas Served
- 12.2.2 Recent Developments
- 12.3. Company Market Share Analysis 2025
- 12.3.1 Top 5 Companies Market Share Analysis
- 12.3.2 Top 3 Companies Market Share Analysis
- 12.4. List of Potential Customers
- 13. Research Methodology
List of Figures
- Figure 1: Global Blood Meal Industry Revenue Breakdown (billion, %) by Region 2025 & 2033
- Figure 2: North America Blood Meal Industry Revenue (billion), by Production Analysis 2025 & 2033
- Figure 3: North America Blood Meal Industry Revenue Share (%), by Production Analysis 2025 & 2033
- Figure 4: North America Blood Meal Industry Revenue (billion), by Consumption Analysis 2025 & 2033
- Figure 5: North America Blood Meal Industry Revenue Share (%), by Consumption Analysis 2025 & 2033
- Figure 6: North America Blood Meal Industry Revenue (billion), by Import Market Analysis (Value & Volume) 2025 & 2033
- Figure 7: North America Blood Meal Industry Revenue Share (%), by Import Market Analysis (Value & Volume) 2025 & 2033
- Figure 8: North America Blood Meal Industry Revenue (billion), by Export Market Analysis (Value & Volume) 2025 & 2033
- Figure 9: North America Blood Meal Industry Revenue Share (%), by Export Market Analysis (Value & Volume) 2025 & 2033
- Figure 10: North America Blood Meal Industry Revenue (billion), by Price Trend Analysis 2025 & 2033
- Figure 11: North America Blood Meal Industry Revenue Share (%), by Price Trend Analysis 2025 & 2033
- Figure 12: North America Blood Meal Industry Revenue (billion), by Country 2025 & 2033
- Figure 13: North America Blood Meal Industry Revenue Share (%), by Country 2025 & 2033
- Figure 14: South America Blood Meal Industry Revenue (billion), by Production Analysis 2025 & 2033
- Figure 15: South America Blood Meal Industry Revenue Share (%), by Production Analysis 2025 & 2033
- Figure 16: South America Blood Meal Industry Revenue (billion), by Consumption Analysis 2025 & 2033
- Figure 17: South America Blood Meal Industry Revenue Share (%), by Consumption Analysis 2025 & 2033
- Figure 18: South America Blood Meal Industry Revenue (billion), by Import Market Analysis (Value & Volume) 2025 & 2033
- Figure 19: South America Blood Meal Industry Revenue Share (%), by Import Market Analysis (Value & Volume) 2025 & 2033
- Figure 20: South America Blood Meal Industry Revenue (billion), by Export Market Analysis (Value & Volume) 2025 & 2033
- Figure 21: South America Blood Meal Industry Revenue Share (%), by Export Market Analysis (Value & Volume) 2025 & 2033
- Figure 22: South America Blood Meal Industry Revenue (billion), by Price Trend Analysis 2025 & 2033
- Figure 23: South America Blood Meal Industry Revenue Share (%), by Price Trend Analysis 2025 & 2033
- Figure 24: South America Blood Meal Industry Revenue (billion), by Country 2025 & 2033
- Figure 25: South America Blood Meal Industry Revenue Share (%), by Country 2025 & 2033
- Figure 26: Europe Blood Meal Industry Revenue (billion), by Production Analysis 2025 & 2033
- Figure 27: Europe Blood Meal Industry Revenue Share (%), by Production Analysis 2025 & 2033
- Figure 28: Europe Blood Meal Industry Revenue (billion), by Consumption Analysis 2025 & 2033
- Figure 29: Europe Blood Meal Industry Revenue Share (%), by Consumption Analysis 2025 & 2033
- Figure 30: Europe Blood Meal Industry Revenue (billion), by Import Market Analysis (Value & Volume) 2025 & 2033
- Figure 31: Europe Blood Meal Industry Revenue Share (%), by Import Market Analysis (Value & Volume) 2025 & 2033
- Figure 32: Europe Blood Meal Industry Revenue (billion), by Export Market Analysis (Value & Volume) 2025 & 2033
- Figure 33: Europe Blood Meal Industry Revenue Share (%), by Export Market Analysis (Value & Volume) 2025 & 2033
- Figure 34: Europe Blood Meal Industry Revenue (billion), by Price Trend Analysis 2025 & 2033
- Figure 35: Europe Blood Meal Industry Revenue Share (%), by Price Trend Analysis 2025 & 2033
- Figure 36: Europe Blood Meal Industry Revenue (billion), by Country 2025 & 2033
- Figure 37: Europe Blood Meal Industry Revenue Share (%), by Country 2025 & 2033
- Figure 38: Middle East & Africa Blood Meal Industry Revenue (billion), by Production Analysis 2025 & 2033
- Figure 39: Middle East & Africa Blood Meal Industry Revenue Share (%), by Production Analysis 2025 & 2033
- Figure 40: Middle East & Africa Blood Meal Industry Revenue (billion), by Consumption Analysis 2025 & 2033
- Figure 41: Middle East & Africa Blood Meal Industry Revenue Share (%), by Consumption Analysis 2025 & 2033
- Figure 42: Middle East & Africa Blood Meal Industry Revenue (billion), by Import Market Analysis (Value & Volume) 2025 & 2033
- Figure 43: Middle East & Africa Blood Meal Industry Revenue Share (%), by Import Market Analysis (Value & Volume) 2025 & 2033
- Figure 44: Middle East & Africa Blood Meal Industry Revenue (billion), by Export Market Analysis (Value & Volume) 2025 & 2033
- Figure 45: Middle East & Africa Blood Meal Industry Revenue Share (%), by Export Market Analysis (Value & Volume) 2025 & 2033
- Figure 46: Middle East & Africa Blood Meal Industry Revenue (billion), by Price Trend Analysis 2025 & 2033
- Figure 47: Middle East & Africa Blood Meal Industry Revenue Share (%), by Price Trend Analysis 2025 & 2033
- Figure 48: Middle East & Africa Blood Meal Industry Revenue (billion), by Country 2025 & 2033
- Figure 49: Middle East & Africa Blood Meal Industry Revenue Share (%), by Country 2025 & 2033
- Figure 50: Asia Pacific Blood Meal Industry Revenue (billion), by Production Analysis 2025 & 2033
- Figure 51: Asia Pacific Blood Meal Industry Revenue Share (%), by Production Analysis 2025 & 2033
- Figure 52: Asia Pacific Blood Meal Industry Revenue (billion), by Consumption Analysis 2025 & 2033
- Figure 53: Asia Pacific Blood Meal Industry Revenue Share (%), by Consumption Analysis 2025 & 2033
- Figure 54: Asia Pacific Blood Meal Industry Revenue (billion), by Import Market Analysis (Value & Volume) 2025 & 2033
- Figure 55: Asia Pacific Blood Meal Industry Revenue Share (%), by Import Market Analysis (Value & Volume) 2025 & 2033
- Figure 56: Asia Pacific Blood Meal Industry Revenue (billion), by Export Market Analysis (Value & Volume) 2025 & 2033
- Figure 57: Asia Pacific Blood Meal Industry Revenue Share (%), by Export Market Analysis (Value & Volume) 2025 & 2033
- Figure 58: Asia Pacific Blood Meal Industry Revenue (billion), by Price Trend Analysis 2025 & 2033
- Figure 59: Asia Pacific Blood Meal Industry Revenue Share (%), by Price Trend Analysis 2025 & 2033
- Figure 60: Asia Pacific Blood Meal Industry Revenue (billion), by Country 2025 & 2033
- Figure 61: Asia Pacific Blood Meal Industry Revenue Share (%), by Country 2025 & 2033
List of Tables
- Table 1: Global Blood Meal Industry Revenue billion Forecast, by Production Analysis 2020 & 2033
- Table 2: Global Blood Meal Industry Revenue billion Forecast, by Consumption Analysis 2020 & 2033
- Table 3: Global Blood Meal Industry Revenue billion Forecast, by Import Market Analysis (Value & Volume) 2020 & 2033
- Table 4: Global Blood Meal Industry Revenue billion Forecast, by Export Market Analysis (Value & Volume) 2020 & 2033
- Table 5: Global Blood Meal Industry Revenue billion Forecast, by Price Trend Analysis 2020 & 2033
- Table 6: Global Blood Meal Industry Revenue billion Forecast, by Region 2020 & 2033
- Table 7: Global Blood Meal Industry Revenue billion Forecast, by Production Analysis 2020 & 2033
- Table 8: Global Blood Meal Industry Revenue billion Forecast, by Consumption Analysis 2020 & 2033
- Table 9: Global Blood Meal Industry Revenue billion Forecast, by Import Market Analysis (Value & Volume) 2020 & 2033
- Table 10: Global Blood Meal Industry Revenue billion Forecast, by Export Market Analysis (Value & Volume) 2020 & 2033
- Table 11: Global Blood Meal Industry Revenue billion Forecast, by Price Trend Analysis 2020 & 2033
- Table 12: Global Blood Meal Industry Revenue billion Forecast, by Country 2020 & 2033
- Table 13: United States Blood Meal Industry Revenue (billion) Forecast, by Application 2020 & 2033
- Table 14: Canada Blood Meal Industry Revenue (billion) Forecast, by Application 2020 & 2033
- Table 15: Mexico Blood Meal Industry Revenue (billion) Forecast, by Application 2020 & 2033
- Table 16: Global Blood Meal Industry Revenue billion Forecast, by Production Analysis 2020 & 2033
- Table 17: Global Blood Meal Industry Revenue billion Forecast, by Consumption Analysis 2020 & 2033
- Table 18: Global Blood Meal Industry Revenue billion Forecast, by Import Market Analysis (Value & Volume) 2020 & 2033
- Table 19: Global Blood Meal Industry Revenue billion Forecast, by Export Market Analysis (Value & Volume) 2020 & 2033
- Table 20: Global Blood Meal Industry Revenue billion Forecast, by Price Trend Analysis 2020 & 2033
- Table 21: Global Blood Meal Industry Revenue billion Forecast, by Country 2020 & 2033
- Table 22: Brazil Blood Meal Industry Revenue (billion) Forecast, by Application 2020 & 2033
- Table 23: Argentina Blood Meal Industry Revenue (billion) Forecast, by Application 2020 & 2033
- Table 24: Rest of South America Blood Meal Industry Revenue (billion) Forecast, by Application 2020 & 2033
- Table 25: Global Blood Meal Industry Revenue billion Forecast, by Production Analysis 2020 & 2033
- Table 26: Global Blood Meal Industry Revenue billion Forecast, by Consumption Analysis 2020 & 2033
- Table 27: Global Blood Meal Industry Revenue billion Forecast, by Import Market Analysis (Value & Volume) 2020 & 2033
- Table 28: Global Blood Meal Industry Revenue billion Forecast, by Export Market Analysis (Value & Volume) 2020 & 2033
- Table 29: Global Blood Meal Industry Revenue billion Forecast, by Price Trend Analysis 2020 & 2033
- Table 30: Global Blood Meal Industry Revenue billion Forecast, by Country 2020 & 2033
- Table 31: United Kingdom Blood Meal Industry Revenue (billion) Forecast, by Application 2020 & 2033
- Table 32: Germany Blood Meal Industry Revenue (billion) Forecast, by Application 2020 & 2033
- Table 33: France Blood Meal Industry Revenue (billion) Forecast, by Application 2020 & 2033
- Table 34: Italy Blood Meal Industry Revenue (billion) Forecast, by Application 2020 & 2033
- Table 35: Spain Blood Meal Industry Revenue (billion) Forecast, by Application 2020 & 2033
- Table 36: Russia Blood Meal Industry Revenue (billion) Forecast, by Application 2020 & 2033
- Table 37: Benelux Blood Meal Industry Revenue (billion) Forecast, by Application 2020 & 2033
- Table 38: Nordics Blood Meal Industry Revenue (billion) Forecast, by Application 2020 & 2033
- Table 39: Rest of Europe Blood Meal Industry Revenue (billion) Forecast, by Application 2020 & 2033
- Table 40: Global Blood Meal Industry Revenue billion Forecast, by Production Analysis 2020 & 2033
- Table 41: Global Blood Meal Industry Revenue billion Forecast, by Consumption Analysis 2020 & 2033
- Table 42: Global Blood Meal Industry Revenue billion Forecast, by Import Market Analysis (Value & Volume) 2020 & 2033
- Table 43: Global Blood Meal Industry Revenue billion Forecast, by Export Market Analysis (Value & Volume) 2020 & 2033
- Table 44: Global Blood Meal Industry Revenue billion Forecast, by Price Trend Analysis 2020 & 2033
- Table 45: Global Blood Meal Industry Revenue billion Forecast, by Country 2020 & 2033
- Table 46: Turkey Blood Meal Industry Revenue (billion) Forecast, by Application 2020 & 2033
- Table 47: Israel Blood Meal Industry Revenue (billion) Forecast, by Application 2020 & 2033
- Table 48: GCC Blood Meal Industry Revenue (billion) Forecast, by Application 2020 & 2033
- Table 49: North Africa Blood Meal Industry Revenue (billion) Forecast, by Application 2020 & 2033
- Table 50: South Africa Blood Meal Industry Revenue (billion) Forecast, by Application 2020 & 2033
- Table 51: Rest of Middle East & Africa Blood Meal Industry Revenue (billion) Forecast, by Application 2020 & 2033
- Table 52: Global Blood Meal Industry Revenue billion Forecast, by Production Analysis 2020 & 2033
- Table 53: Global Blood Meal Industry Revenue billion Forecast, by Consumption Analysis 2020 & 2033
- Table 54: Global Blood Meal Industry Revenue billion Forecast, by Import Market Analysis (Value & Volume) 2020 & 2033
- Table 55: Global Blood Meal Industry Revenue billion Forecast, by Export Market Analysis (Value & Volume) 2020 & 2033
- Table 56: Global Blood Meal Industry Revenue billion Forecast, by Price Trend Analysis 2020 & 2033
- Table 57: Global Blood Meal Industry Revenue billion Forecast, by Country 2020 & 2033
- Table 58: China Blood Meal Industry Revenue (billion) Forecast, by Application 2020 & 2033
- Table 59: India Blood Meal Industry Revenue (billion) Forecast, by Application 2020 & 2033
- Table 60: Japan Blood Meal Industry Revenue (billion) Forecast, by Application 2020 & 2033
- Table 61: South Korea Blood Meal Industry Revenue (billion) Forecast, by Application 2020 & 2033
- Table 62: ASEAN Blood Meal Industry Revenue (billion) Forecast, by Application 2020 & 2033
- Table 63: Oceania Blood Meal Industry Revenue (billion) Forecast, by Application 2020 & 2033
- Table 64: Rest of Asia Pacific Blood Meal Industry Revenue (billion) Forecast, by Application 2020 & 2033
Frequently Asked Questions
1. What is the projected Compound Annual Growth Rate (CAGR) of the Blood Meal Industry?
The projected CAGR is approximately 3.63%.
2. Which companies are prominent players in the Blood Meal Industry?
Key companies in the market include Allanasons Pvt Ltd*List Not Exhaustive, Valley Proteins Inc, Terramar Chile, Sanimax, West Coast Reduction Ltd, Darling Ingredients, Boyer Valley Company LLC, Agro-industrial Complex Backa Topola LTD, The Fetrell Company.
3. What are the main segments of the Blood Meal Industry?
The market segments include Production Analysis, Consumption Analysis, Import Market Analysis (Value & Volume), Export Market Analysis (Value & Volume), Price Trend Analysis.
4. Can you provide details about the market size?
The market size is estimated to be USD 1.29 billion as of 2022.
5. What are some drivers contributing to market growth?
Adoption of Organic and Eco-friendly Farming Practices; Declining Area of Arable Land and Rising Food Security Concerns.
6. What are the notable trends driving market growth?
Growing Demand for Animal Meat is creating Market Opportunities.
7. Are there any restraints impacting market growth?
High Demand for Conventional and Synthetic Products; Lack of Awareness and Other Factors Limiting the Adoption of Agricultural Inoculants.
8. Can you provide examples of recent developments in the market?
May 2022: Darling Ingredients acquired Fasa Group for USD 560 million to expand its geographical presence and new product offerings in the global blood meal market.
9. What pricing options are available for accessing the report?
Pricing options include single-user, multi-user, and enterprise licenses priced at USD 4750, USD 5250, and USD 8750 respectively.
10. Is the market size provided in terms of value or volume?
The market size is provided in terms of value, measured in billion.
11. Are there any specific market keywords associated with the report?
Yes, the market keyword associated with the report is "Blood Meal Industry," which aids in identifying and referencing the specific market segment covered.
12. How do I determine which pricing option suits my needs best?
The pricing options vary based on user requirements and access needs. Individual users may opt for single-user licenses, while businesses requiring broader access may choose multi-user or enterprise licenses for cost-effective access to the report.
13. Are there any additional resources or data provided in the Blood Meal Industry report?
While the report offers comprehensive insights, it's advisable to review the specific contents or supplementary materials provided to ascertain if additional resources or data are available.
14. How can I stay updated on further developments or reports in the Blood Meal Industry?
To stay informed about further developments, trends, and reports in the Blood Meal Industry, consider subscribing to industry newsletters, following relevant companies and organizations, or regularly checking reputable industry news sources and publications.
Methodology
Step 1 - Identification of Relevant Samples Size from Population Database


Step 2 - Approaches for Defining Global Market Size (Value, Volume* & Price*)

Note*: In applicable scenarios
Step 3 - Data Sources
Primary Research
- Web Analytics
- Survey Reports
- Research Institute
- Latest Research Reports
- Opinion Leaders
Secondary Research
- Annual Reports
- White Paper
- Latest Press Release
- Industry Association
- Paid Database
- Investor Presentations

Step 4 - Data Triangulation
Involves using different sources of information in order to increase the validity of a study
These sources are likely to be stakeholders in a program - participants, other researchers, program staff, other community members, and so on.
Then we put all data in single framework & apply various statistical tools to find out the dynamic on the market.
During the analysis stage, feedback from the stakeholder groups would be compared to determine areas of agreement as well as areas of divergence

