
Key Insights
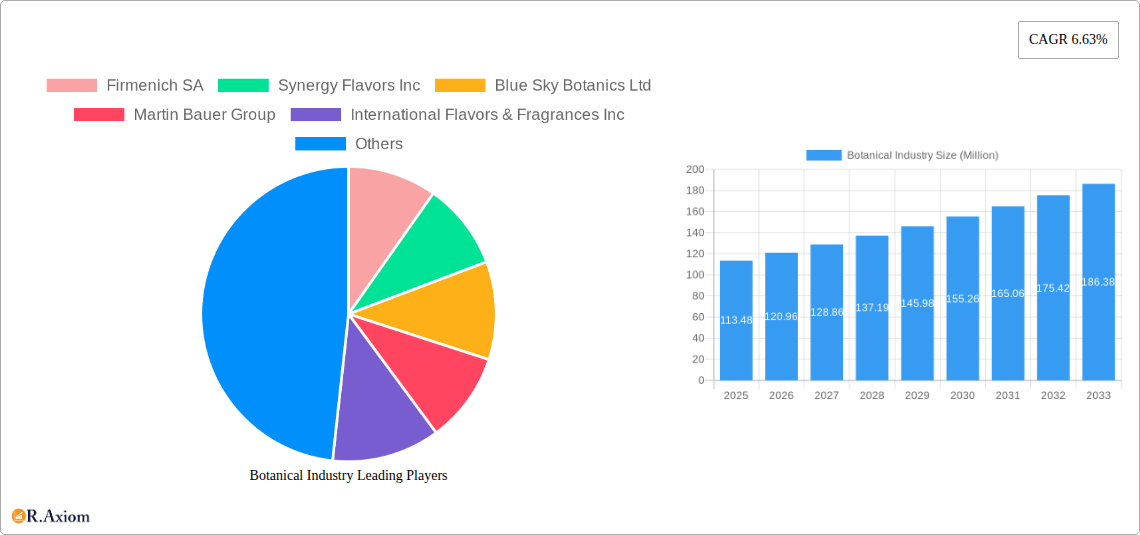
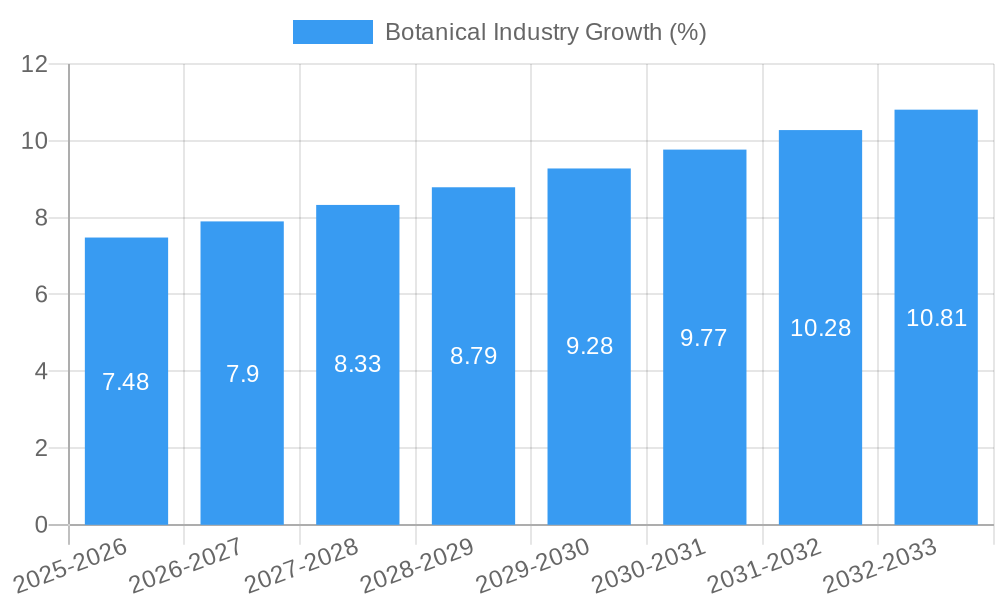
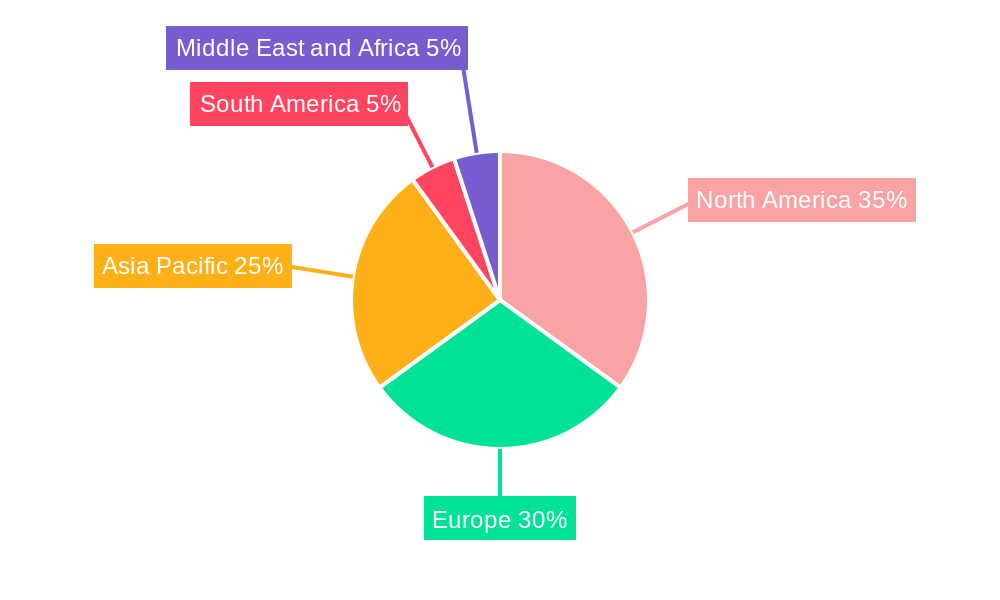
The botanical industry, valued at $113.48 million in 2025, is experiencing robust growth, projected to expand at a compound annual growth rate (CAGR) of 6.63% from 2025 to 2033. This expansion is fueled by several key drivers. The increasing consumer demand for natural and organic products in food and beverages, dietary supplements, and cosmetics is a significant factor. The growing awareness of the health benefits associated with botanical extracts, such as antioxidants and anti-inflammatory properties, further boosts market growth. Innovation in extraction technologies is also playing a crucial role, leading to higher quality extracts and more efficient production processes. Furthermore, the rising popularity of herbal remedies and traditional medicine in various regions contributes to the industry's expansion. The market segmentation reveals that food and beverages dominate the application segment, followed by dietary supplements and animal feed. Herbs are the leading source category, underscoring the importance of traditional botanical ingredients. Geographically, North America and Europe currently hold substantial market share, driven by high consumer awareness and established distribution networks; however, Asia-Pacific is poised for significant growth, fueled by increasing disposable incomes and expanding middle classes. Competition is fierce, with established players like Firmenich SA, Givaudan SA, and Symrise AG vying for market dominance alongside smaller, specialized companies focusing on niche botanical extracts. The industry faces challenges such as fluctuating raw material prices, stringent regulatory requirements, and the potential for adulteration, impacting both supply chain stability and consumer trust.
The forecast period (2025-2033) anticipates continued market expansion, primarily driven by the sustained demand for natural ingredients across diverse applications. The industry will likely see further consolidation, with larger companies acquiring smaller, specialized firms to expand their product portfolios and geographic reach. Technological advancements in extraction and processing will continue to play a crucial role in enhancing product quality and efficiency. Sustainable sourcing practices and transparency within supply chains will become increasingly important to maintain consumer confidence. Addressing regulatory challenges and ensuring product safety and authenticity will also remain crucial for long-term market stability and growth. The Asia-Pacific region's expanding market presents significant opportunities for growth, requiring strategic investments in local infrastructure and distribution networks. Companies that successfully leverage these opportunities and address industry challenges will be best positioned for success in this dynamic and expanding market.
Botanical Industry Market Report: 2019-2033
This comprehensive report provides a detailed analysis of the global Botanical Industry market, offering invaluable insights for stakeholders across the value chain. The study period spans from 2019 to 2033, with 2025 serving as both the base and estimated year. The report covers market sizing, segmentation, competitive landscape, growth drivers, challenges, and emerging opportunities, providing a 360-degree view of this dynamic sector. The market is projected to reach xx Million by 2033, exhibiting a CAGR of xx% during the forecast period (2025-2033).
Botanical Industry Market Concentration & Innovation
The Botanical Industry is characterized by a moderately concentrated market structure, with a few large players holding significant market share. Firmenich SA, Givaudan S A, Symrise AG, International Flavors & Fragrances Inc., and Archer-Daniels-Midland Company are some of the key players dominating the market, collectively accounting for an estimated xx% of the global market share in 2025. Smaller, specialized companies like Blue Sky Botanics Ltd and Ransom Naturals Ltd cater to niche segments.
- Market Share (2025): Firmenich SA (xx%), Givaudan S A (xx%), Symrise AG (xx%), IFF (xx%), ADM (xx%), Others (xx%).
- M&A Activity: The industry has witnessed significant consolidation through mergers and acquisitions (M&A) in recent years, with deal values exceeding xx Million in the period 2019-2024. These activities are driven by the need to expand product portfolios, access new markets, and gain technological advantages. For example, the acquisition of xx by xx in xx significantly expanded the acquirer's presence in the xx segment.
- Innovation Drivers: The demand for natural and sustainable products is driving innovation in extraction techniques, product formulations, and applications. Growing consumer awareness of health and wellness is also fostering the development of functional botanical products.
- Regulatory Frameworks: Stringent regulations regarding food safety, labeling, and sustainability are shaping industry practices and influencing product development.
- Product Substitutes: Synthetic alternatives exist for some botanical extracts, posing a challenge to the industry, particularly in price-sensitive segments.
- End-User Trends: The increasing adoption of botanical ingredients in food and beverages, personal care, and pharmaceuticals is driving market growth.
Botanical Industry Industry Trends & Insights
The Botanical Industry is experiencing robust growth, fueled by several key trends. The increasing consumer preference for natural and organic products is a major driver, propelling demand across various applications. The rising awareness of health benefits associated with botanicals is further fueling this growth. Technological advancements in extraction and processing are improving the quality and yield of botanical extracts, making them more accessible and affordable. The market is also witnessing a shift towards sustainable and ethically sourced botanical ingredients, driven by growing environmental concerns.
The global Botanical Industry market exhibited a CAGR of xx% during the historical period (2019-2024) and is projected to maintain a healthy growth trajectory, exceeding xx Million by 2033. Market penetration of botanical extracts in food & beverages is estimated at xx% in 2025, with significant growth potential in emerging markets. Competitive dynamics are characterized by both intense rivalry amongst established players and the emergence of innovative startups offering unique products and services. The increasing use of technology in extraction and processing is expected to improve the efficiency and sustainability of the industry further boosting the market.
Dominant Markets & Segments in Botanical Industry
The Asia-Pacific region dominates the global Botanical Industry market, accounting for the largest share in 2025, driven by robust economic growth, rising disposable incomes, and increasing demand for natural products. Within the application segments, Food and Beverage holds the largest share, followed by Dietary Supplements. Among source segments, herbs dominate the market, followed by spices.
- Key Drivers for Asia-Pacific Dominance:
- Rapidly expanding middle class.
- Increasing health consciousness.
- Strong traditional medicine practices.
- Favorable government policies supporting the agricultural sector.
- Dominant Application Segment: Food and Beverage – The widespread use of botanical ingredients in food and beverages, including flavors, colors, and functional ingredients, contributes significantly to the segment's dominance.
- Dominant Source Segment: Herbs – The versatility and wide range of applications of herbs make them a major driver of market growth in the botanical source category.
Botanical Industry Product Developments
Recent product innovations focus on enhancing the efficacy and functionality of botanical extracts. Supercritical CO2 extraction and other advanced technologies are being employed to improve yield and quality while minimizing environmental impact. The development of standardized extracts with consistent quality and potency is also a significant trend. New applications of botanical ingredients in areas such as cosmetics, pharmaceuticals, and nutraceuticals are expanding the market's reach. Products with clean labels and sustainable sourcing credentials are gaining traction with consumers.
Report Scope & Segmentation Analysis
The report segments the Botanical Industry market by application (Food and Beverage, Dietary Supplements, Animal Feed, Other Applications) and by source (Herbs, Spices, Flowers, Other Sources). Each segment is analyzed in detail, providing market size, growth projections, and competitive dynamics for the period 2019-2033. For example, the Food and Beverage segment is expected to witness robust growth driven by increasing demand for natural flavors and colors. Similarly, the Herbs segment is anticipated to maintain its dominant position due to the wide range of applications and health benefits associated with herbs.
Key Drivers of Botanical Industry Growth
Several factors are contributing to the growth of the Botanical Industry. These include the growing global demand for natural and organic products driven by health-conscious consumers. Technological advancements such as supercritical fluid extraction offer increased efficiency and sustainability. Favorable government regulations and policies promoting the use of natural ingredients also play a vital role.
Challenges in the Botanical Industry Sector
The Botanical Industry faces several challenges. Supply chain complexities, including issues with sourcing and quality control of raw materials, pose significant hurdles. Fluctuations in raw material prices can impact profitability, and stringent regulatory requirements add to the operational costs. Competition from synthetic substitutes and the need for sustainable practices represent additional challenges.
Emerging Opportunities in Botanical Industry
The Botanical Industry presents several opportunities. The growing demand for personalized nutrition and functional foods offers potential for innovative product development. The expansion into new markets, particularly in developing economies, presents significant growth prospects. Furthermore, advancements in extraction technologies and the development of novel applications for botanical ingredients provide considerable opportunities for market expansion.
Leading Players in the Botanical Industry Market
- Firmenich SA
- Synergy Flavors Inc
- Blue Sky Botanics Ltd
- Martin Bauer Group
- International Flavors & Fragrances Inc
- Bell Flavors & Fragrances
- Ransom Naturals Ltd
- Givaudan S A
- Archer-Daniels-Midland Company
- Symrise AG
Key Developments in Botanical Industry Industry
- January 2023: Company X launched a new line of organic botanical extracts.
- March 2022: Company Y acquired Company Z, expanding its presence in the South American market.
- June 2021: A new extraction technology was introduced, enhancing the efficiency and sustainability of botanical processing.
(Note: Further key developments can be added here as needed. Remember to include date and a brief description of impact.)
Strategic Outlook for Botanical Industry Market
The Botanical Industry is poised for sustained growth, driven by evolving consumer preferences, technological advancements, and increasing demand for natural products. The market presents significant opportunities for companies to innovate, expand their product portfolios, and capitalize on emerging trends in areas such as personalized nutrition and sustainable sourcing. Strategic partnerships and collaborations are also expected to play a crucial role in shaping the future of the industry.
Botanical Industry Segmentation
-
1. Source
- 1.1. Herbs
- 1.2. Spices
- 1.3. Flowers
- 1.4. Other Sources
-
2. Application
-
2.1. Food and Beverage
- 2.1.1. Bakery and Confectionery
- 2.1.2. Sauces and Dressings
- 2.1.3. Functional Beverages
- 2.1.4. Other Food and Beverages
- 2.2. Dietary Supplements
- 2.3. Animal Feed
- 2.4. Other Applications
-
2.1. Food and Beverage
Botanical Industry Segmentation By Geography
-
1. North America
- 1.1. United States
- 1.2. Canada
- 1.3. Mexico
- 1.4. Rest of North America
-
2. Europe
- 2.1. Spain
- 2.2. United Kingdom
- 2.3. France
- 2.4. Germany
- 2.5. Italy
- 2.6. Russia
- 2.7. Rest of Europe
-
3. Asia Pacific
- 3.1. China
- 3.2. India
- 3.3. Japan
- 3.4. Australia
- 3.5. Rest of Asia Pacific
-
4. South America
- 4.1. Brazil
- 4.2. Argentina
- 4.3. Rest of South America
-
5. Middle East and Africa
- 5.1. Saudi Arabia
- 5.2. South Africa
- 5.3. Rest of Middle East and Africa
Botanical Industry REPORT HIGHLIGHTS
| Aspects | Details |
|---|---|
| Study Period | 2019-2033 |
| Base Year | 2024 |
| Estimated Year | 2025 |
| Forecast Period | 2025-2033 |
| Historical Period | 2019-2024 |
| Growth Rate | CAGR of 6.63% from 2019-2033 |
| Segmentation |
|
Table of Contents
- 1. Introduction
- 1.1. Research Scope
- 1.2. Market Segmentation
- 1.3. Research Methodology
- 1.4. Definitions and Assumptions
- 2. Executive Summary
- 2.1. Introduction
- 3. Market Dynamics
- 3.1. Introduction
- 3.2. Market Drivers
- 3.2.1. Increasing Demand For Convenience & Processed Food
- 3.3. Market Restrains
- 3.3.1. Increased Consumer Awareness On Side-Effects Of Chemical Additives
- 3.4. Market Trends
- 3.4.1. Increasing awareness regarding clean label products
- 4. Market Factor Analysis
- 4.1. Porters Five Forces
- 4.2. Supply/Value Chain
- 4.3. PESTEL analysis
- 4.4. Market Entropy
- 4.5. Patent/Trademark Analysis
- 5. Global Botanical Industry Analysis, Insights and Forecast, 2019-2031
- 5.1. Market Analysis, Insights and Forecast - by Source
- 5.1.1. Herbs
- 5.1.2. Spices
- 5.1.3. Flowers
- 5.1.4. Other Sources
- 5.2. Market Analysis, Insights and Forecast - by Application
- 5.2.1. Food and Beverage
- 5.2.1.1. Bakery and Confectionery
- 5.2.1.2. Sauces and Dressings
- 5.2.1.3. Functional Beverages
- 5.2.1.4. Other Food and Beverages
- 5.2.2. Dietary Supplements
- 5.2.3. Animal Feed
- 5.2.4. Other Applications
- 5.2.1. Food and Beverage
- 5.3. Market Analysis, Insights and Forecast - by Region
- 5.3.1. North America
- 5.3.2. Europe
- 5.3.3. Asia Pacific
- 5.3.4. South America
- 5.3.5. Middle East and Africa
- 5.1. Market Analysis, Insights and Forecast - by Source
- 6. North America Botanical Industry Analysis, Insights and Forecast, 2019-2031
- 6.1. Market Analysis, Insights and Forecast - by Source
- 6.1.1. Herbs
- 6.1.2. Spices
- 6.1.3. Flowers
- 6.1.4. Other Sources
- 6.2. Market Analysis, Insights and Forecast - by Application
- 6.2.1. Food and Beverage
- 6.2.1.1. Bakery and Confectionery
- 6.2.1.2. Sauces and Dressings
- 6.2.1.3. Functional Beverages
- 6.2.1.4. Other Food and Beverages
- 6.2.2. Dietary Supplements
- 6.2.3. Animal Feed
- 6.2.4. Other Applications
- 6.2.1. Food and Beverage
- 6.1. Market Analysis, Insights and Forecast - by Source
- 7. Europe Botanical Industry Analysis, Insights and Forecast, 2019-2031
- 7.1. Market Analysis, Insights and Forecast - by Source
- 7.1.1. Herbs
- 7.1.2. Spices
- 7.1.3. Flowers
- 7.1.4. Other Sources
- 7.2. Market Analysis, Insights and Forecast - by Application
- 7.2.1. Food and Beverage
- 7.2.1.1. Bakery and Confectionery
- 7.2.1.2. Sauces and Dressings
- 7.2.1.3. Functional Beverages
- 7.2.1.4. Other Food and Beverages
- 7.2.2. Dietary Supplements
- 7.2.3. Animal Feed
- 7.2.4. Other Applications
- 7.2.1. Food and Beverage
- 7.1. Market Analysis, Insights and Forecast - by Source
- 8. Asia Pacific Botanical Industry Analysis, Insights and Forecast, 2019-2031
- 8.1. Market Analysis, Insights and Forecast - by Source
- 8.1.1. Herbs
- 8.1.2. Spices
- 8.1.3. Flowers
- 8.1.4. Other Sources
- 8.2. Market Analysis, Insights and Forecast - by Application
- 8.2.1. Food and Beverage
- 8.2.1.1. Bakery and Confectionery
- 8.2.1.2. Sauces and Dressings
- 8.2.1.3. Functional Beverages
- 8.2.1.4. Other Food and Beverages
- 8.2.2. Dietary Supplements
- 8.2.3. Animal Feed
- 8.2.4. Other Applications
- 8.2.1. Food and Beverage
- 8.1. Market Analysis, Insights and Forecast - by Source
- 9. South America Botanical Industry Analysis, Insights and Forecast, 2019-2031
- 9.1. Market Analysis, Insights and Forecast - by Source
- 9.1.1. Herbs
- 9.1.2. Spices
- 9.1.3. Flowers
- 9.1.4. Other Sources
- 9.2. Market Analysis, Insights and Forecast - by Application
- 9.2.1. Food and Beverage
- 9.2.1.1. Bakery and Confectionery
- 9.2.1.2. Sauces and Dressings
- 9.2.1.3. Functional Beverages
- 9.2.1.4. Other Food and Beverages
- 9.2.2. Dietary Supplements
- 9.2.3. Animal Feed
- 9.2.4. Other Applications
- 9.2.1. Food and Beverage
- 9.1. Market Analysis, Insights and Forecast - by Source
- 10. Middle East and Africa Botanical Industry Analysis, Insights and Forecast, 2019-2031
- 10.1. Market Analysis, Insights and Forecast - by Source
- 10.1.1. Herbs
- 10.1.2. Spices
- 10.1.3. Flowers
- 10.1.4. Other Sources
- 10.2. Market Analysis, Insights and Forecast - by Application
- 10.2.1. Food and Beverage
- 10.2.1.1. Bakery and Confectionery
- 10.2.1.2. Sauces and Dressings
- 10.2.1.3. Functional Beverages
- 10.2.1.4. Other Food and Beverages
- 10.2.2. Dietary Supplements
- 10.2.3. Animal Feed
- 10.2.4. Other Applications
- 10.2.1. Food and Beverage
- 10.1. Market Analysis, Insights and Forecast - by Source
- 11. North America Botanical Industry Analysis, Insights and Forecast, 2019-2031
- 11.1. Market Analysis, Insights and Forecast - By Country/Sub-region
- 11.1.1 United States
- 11.1.2 Canada
- 11.1.3 Mexico
- 11.1.4 Rest of North America
- 12. Europe Botanical Industry Analysis, Insights and Forecast, 2019-2031
- 12.1. Market Analysis, Insights and Forecast - By Country/Sub-region
- 12.1.1 Spain
- 12.1.2 United Kingdom
- 12.1.3 France
- 12.1.4 Germany
- 12.1.5 Italy
- 12.1.6 Russia
- 12.1.7 Rest of Europe
- 13. Asia Pacific Botanical Industry Analysis, Insights and Forecast, 2019-2031
- 13.1. Market Analysis, Insights and Forecast - By Country/Sub-region
- 13.1.1 China
- 13.1.2 India
- 13.1.3 Japan
- 13.1.4 Australia
- 13.1.5 Rest of Asia Pacific
- 14. South America Botanical Industry Analysis, Insights and Forecast, 2019-2031
- 14.1. Market Analysis, Insights and Forecast - By Country/Sub-region
- 14.1.1 Brazil
- 14.1.2 Argentina
- 14.1.3 Rest of South America
- 15. Middle East and Africa Botanical Industry Analysis, Insights and Forecast, 2019-2031
- 15.1. Market Analysis, Insights and Forecast - By Country/Sub-region
- 15.1.1 Saudi Arabia
- 15.1.2 South Africa
- 15.1.3 Rest of Middle East and Africa
- 16. Competitive Analysis
- 16.1. Global Market Share Analysis 2024
- 16.2. Company Profiles
- 16.2.1 Firmenich SA
- 16.2.1.1. Overview
- 16.2.1.2. Products
- 16.2.1.3. SWOT Analysis
- 16.2.1.4. Recent Developments
- 16.2.1.5. Financials (Based on Availability)
- 16.2.2 Synergy Flavors Inc
- 16.2.2.1. Overview
- 16.2.2.2. Products
- 16.2.2.3. SWOT Analysis
- 16.2.2.4. Recent Developments
- 16.2.2.5. Financials (Based on Availability)
- 16.2.3 Blue Sky Botanics Ltd
- 16.2.3.1. Overview
- 16.2.3.2. Products
- 16.2.3.3. SWOT Analysis
- 16.2.3.4. Recent Developments
- 16.2.3.5. Financials (Based on Availability)
- 16.2.4 Martin Bauer Group
- 16.2.4.1. Overview
- 16.2.4.2. Products
- 16.2.4.3. SWOT Analysis
- 16.2.4.4. Recent Developments
- 16.2.4.5. Financials (Based on Availability)
- 16.2.5 International Flavors & Fragrances Inc
- 16.2.5.1. Overview
- 16.2.5.2. Products
- 16.2.5.3. SWOT Analysis
- 16.2.5.4. Recent Developments
- 16.2.5.5. Financials (Based on Availability)
- 16.2.6 Bell Flavors & Fragrances
- 16.2.6.1. Overview
- 16.2.6.2. Products
- 16.2.6.3. SWOT Analysis
- 16.2.6.4. Recent Developments
- 16.2.6.5. Financials (Based on Availability)
- 16.2.7 Ransom Naturals Ltd
- 16.2.7.1. Overview
- 16.2.7.2. Products
- 16.2.7.3. SWOT Analysis
- 16.2.7.4. Recent Developments
- 16.2.7.5. Financials (Based on Availability)
- 16.2.8 Givaudan S A *List Not Exhaustive
- 16.2.8.1. Overview
- 16.2.8.2. Products
- 16.2.8.3. SWOT Analysis
- 16.2.8.4. Recent Developments
- 16.2.8.5. Financials (Based on Availability)
- 16.2.9 Archer-Daniels-Midland Company
- 16.2.9.1. Overview
- 16.2.9.2. Products
- 16.2.9.3. SWOT Analysis
- 16.2.9.4. Recent Developments
- 16.2.9.5. Financials (Based on Availability)
- 16.2.10 Symrise AG
- 16.2.10.1. Overview
- 16.2.10.2. Products
- 16.2.10.3. SWOT Analysis
- 16.2.10.4. Recent Developments
- 16.2.10.5. Financials (Based on Availability)
- 16.2.1 Firmenich SA
List of Figures
- Figure 1: Global Botanical Industry Revenue Breakdown (Million, %) by Region 2024 & 2032
- Figure 2: Global Botanical Industry Volume Breakdown (K Tons, %) by Region 2024 & 2032
- Figure 3: North America Botanical Industry Revenue (Million), by Country 2024 & 2032
- Figure 4: North America Botanical Industry Volume (K Tons), by Country 2024 & 2032
- Figure 5: North America Botanical Industry Revenue Share (%), by Country 2024 & 2032
- Figure 6: North America Botanical Industry Volume Share (%), by Country 2024 & 2032
- Figure 7: Europe Botanical Industry Revenue (Million), by Country 2024 & 2032
- Figure 8: Europe Botanical Industry Volume (K Tons), by Country 2024 & 2032
- Figure 9: Europe Botanical Industry Revenue Share (%), by Country 2024 & 2032
- Figure 10: Europe Botanical Industry Volume Share (%), by Country 2024 & 2032
- Figure 11: Asia Pacific Botanical Industry Revenue (Million), by Country 2024 & 2032
- Figure 12: Asia Pacific Botanical Industry Volume (K Tons), by Country 2024 & 2032
- Figure 13: Asia Pacific Botanical Industry Revenue Share (%), by Country 2024 & 2032
- Figure 14: Asia Pacific Botanical Industry Volume Share (%), by Country 2024 & 2032
- Figure 15: South America Botanical Industry Revenue (Million), by Country 2024 & 2032
- Figure 16: South America Botanical Industry Volume (K Tons), by Country 2024 & 2032
- Figure 17: South America Botanical Industry Revenue Share (%), by Country 2024 & 2032
- Figure 18: South America Botanical Industry Volume Share (%), by Country 2024 & 2032
- Figure 19: Middle East and Africa Botanical Industry Revenue (Million), by Country 2024 & 2032
- Figure 20: Middle East and Africa Botanical Industry Volume (K Tons), by Country 2024 & 2032
- Figure 21: Middle East and Africa Botanical Industry Revenue Share (%), by Country 2024 & 2032
- Figure 22: Middle East and Africa Botanical Industry Volume Share (%), by Country 2024 & 2032
- Figure 23: North America Botanical Industry Revenue (Million), by Source 2024 & 2032
- Figure 24: North America Botanical Industry Volume (K Tons), by Source 2024 & 2032
- Figure 25: North America Botanical Industry Revenue Share (%), by Source 2024 & 2032
- Figure 26: North America Botanical Industry Volume Share (%), by Source 2024 & 2032
- Figure 27: North America Botanical Industry Revenue (Million), by Application 2024 & 2032
- Figure 28: North America Botanical Industry Volume (K Tons), by Application 2024 & 2032
- Figure 29: North America Botanical Industry Revenue Share (%), by Application 2024 & 2032
- Figure 30: North America Botanical Industry Volume Share (%), by Application 2024 & 2032
- Figure 31: North America Botanical Industry Revenue (Million), by Country 2024 & 2032
- Figure 32: North America Botanical Industry Volume (K Tons), by Country 2024 & 2032
- Figure 33: North America Botanical Industry Revenue Share (%), by Country 2024 & 2032
- Figure 34: North America Botanical Industry Volume Share (%), by Country 2024 & 2032
- Figure 35: Europe Botanical Industry Revenue (Million), by Source 2024 & 2032
- Figure 36: Europe Botanical Industry Volume (K Tons), by Source 2024 & 2032
- Figure 37: Europe Botanical Industry Revenue Share (%), by Source 2024 & 2032
- Figure 38: Europe Botanical Industry Volume Share (%), by Source 2024 & 2032
- Figure 39: Europe Botanical Industry Revenue (Million), by Application 2024 & 2032
- Figure 40: Europe Botanical Industry Volume (K Tons), by Application 2024 & 2032
- Figure 41: Europe Botanical Industry Revenue Share (%), by Application 2024 & 2032
- Figure 42: Europe Botanical Industry Volume Share (%), by Application 2024 & 2032
- Figure 43: Europe Botanical Industry Revenue (Million), by Country 2024 & 2032
- Figure 44: Europe Botanical Industry Volume (K Tons), by Country 2024 & 2032
- Figure 45: Europe Botanical Industry Revenue Share (%), by Country 2024 & 2032
- Figure 46: Europe Botanical Industry Volume Share (%), by Country 2024 & 2032
- Figure 47: Asia Pacific Botanical Industry Revenue (Million), by Source 2024 & 2032
- Figure 48: Asia Pacific Botanical Industry Volume (K Tons), by Source 2024 & 2032
- Figure 49: Asia Pacific Botanical Industry Revenue Share (%), by Source 2024 & 2032
- Figure 50: Asia Pacific Botanical Industry Volume Share (%), by Source 2024 & 2032
- Figure 51: Asia Pacific Botanical Industry Revenue (Million), by Application 2024 & 2032
- Figure 52: Asia Pacific Botanical Industry Volume (K Tons), by Application 2024 & 2032
- Figure 53: Asia Pacific Botanical Industry Revenue Share (%), by Application 2024 & 2032
- Figure 54: Asia Pacific Botanical Industry Volume Share (%), by Application 2024 & 2032
- Figure 55: Asia Pacific Botanical Industry Revenue (Million), by Country 2024 & 2032
- Figure 56: Asia Pacific Botanical Industry Volume (K Tons), by Country 2024 & 2032
- Figure 57: Asia Pacific Botanical Industry Revenue Share (%), by Country 2024 & 2032
- Figure 58: Asia Pacific Botanical Industry Volume Share (%), by Country 2024 & 2032
- Figure 59: South America Botanical Industry Revenue (Million), by Source 2024 & 2032
- Figure 60: South America Botanical Industry Volume (K Tons), by Source 2024 & 2032
- Figure 61: South America Botanical Industry Revenue Share (%), by Source 2024 & 2032
- Figure 62: South America Botanical Industry Volume Share (%), by Source 2024 & 2032
- Figure 63: South America Botanical Industry Revenue (Million), by Application 2024 & 2032
- Figure 64: South America Botanical Industry Volume (K Tons), by Application 2024 & 2032
- Figure 65: South America Botanical Industry Revenue Share (%), by Application 2024 & 2032
- Figure 66: South America Botanical Industry Volume Share (%), by Application 2024 & 2032
- Figure 67: South America Botanical Industry Revenue (Million), by Country 2024 & 2032
- Figure 68: South America Botanical Industry Volume (K Tons), by Country 2024 & 2032
- Figure 69: South America Botanical Industry Revenue Share (%), by Country 2024 & 2032
- Figure 70: South America Botanical Industry Volume Share (%), by Country 2024 & 2032
- Figure 71: Middle East and Africa Botanical Industry Revenue (Million), by Source 2024 & 2032
- Figure 72: Middle East and Africa Botanical Industry Volume (K Tons), by Source 2024 & 2032
- Figure 73: Middle East and Africa Botanical Industry Revenue Share (%), by Source 2024 & 2032
- Figure 74: Middle East and Africa Botanical Industry Volume Share (%), by Source 2024 & 2032
- Figure 75: Middle East and Africa Botanical Industry Revenue (Million), by Application 2024 & 2032
- Figure 76: Middle East and Africa Botanical Industry Volume (K Tons), by Application 2024 & 2032
- Figure 77: Middle East and Africa Botanical Industry Revenue Share (%), by Application 2024 & 2032
- Figure 78: Middle East and Africa Botanical Industry Volume Share (%), by Application 2024 & 2032
- Figure 79: Middle East and Africa Botanical Industry Revenue (Million), by Country 2024 & 2032
- Figure 80: Middle East and Africa Botanical Industry Volume (K Tons), by Country 2024 & 2032
- Figure 81: Middle East and Africa Botanical Industry Revenue Share (%), by Country 2024 & 2032
- Figure 82: Middle East and Africa Botanical Industry Volume Share (%), by Country 2024 & 2032
List of Tables
- Table 1: Global Botanical Industry Revenue Million Forecast, by Region 2019 & 2032
- Table 2: Global Botanical Industry Volume K Tons Forecast, by Region 2019 & 2032
- Table 3: Global Botanical Industry Revenue Million Forecast, by Source 2019 & 2032
- Table 4: Global Botanical Industry Volume K Tons Forecast, by Source 2019 & 2032
- Table 5: Global Botanical Industry Revenue Million Forecast, by Application 2019 & 2032
- Table 6: Global Botanical Industry Volume K Tons Forecast, by Application 2019 & 2032
- Table 7: Global Botanical Industry Revenue Million Forecast, by Region 2019 & 2032
- Table 8: Global Botanical Industry Volume K Tons Forecast, by Region 2019 & 2032
- Table 9: Global Botanical Industry Revenue Million Forecast, by Country 2019 & 2032
- Table 10: Global Botanical Industry Volume K Tons Forecast, by Country 2019 & 2032
- Table 11: United States Botanical Industry Revenue (Million) Forecast, by Application 2019 & 2032
- Table 12: United States Botanical Industry Volume (K Tons) Forecast, by Application 2019 & 2032
- Table 13: Canada Botanical Industry Revenue (Million) Forecast, by Application 2019 & 2032
- Table 14: Canada Botanical Industry Volume (K Tons) Forecast, by Application 2019 & 2032
- Table 15: Mexico Botanical Industry Revenue (Million) Forecast, by Application 2019 & 2032
- Table 16: Mexico Botanical Industry Volume (K Tons) Forecast, by Application 2019 & 2032
- Table 17: Rest of North America Botanical Industry Revenue (Million) Forecast, by Application 2019 & 2032
- Table 18: Rest of North America Botanical Industry Volume (K Tons) Forecast, by Application 2019 & 2032
- Table 19: Global Botanical Industry Revenue Million Forecast, by Country 2019 & 2032
- Table 20: Global Botanical Industry Volume K Tons Forecast, by Country 2019 & 2032
- Table 21: Spain Botanical Industry Revenue (Million) Forecast, by Application 2019 & 2032
- Table 22: Spain Botanical Industry Volume (K Tons) Forecast, by Application 2019 & 2032
- Table 23: United Kingdom Botanical Industry Revenue (Million) Forecast, by Application 2019 & 2032
- Table 24: United Kingdom Botanical Industry Volume (K Tons) Forecast, by Application 2019 & 2032
- Table 25: France Botanical Industry Revenue (Million) Forecast, by Application 2019 & 2032
- Table 26: France Botanical Industry Volume (K Tons) Forecast, by Application 2019 & 2032
- Table 27: Germany Botanical Industry Revenue (Million) Forecast, by Application 2019 & 2032
- Table 28: Germany Botanical Industry Volume (K Tons) Forecast, by Application 2019 & 2032
- Table 29: Italy Botanical Industry Revenue (Million) Forecast, by Application 2019 & 2032
- Table 30: Italy Botanical Industry Volume (K Tons) Forecast, by Application 2019 & 2032
- Table 31: Russia Botanical Industry Revenue (Million) Forecast, by Application 2019 & 2032
- Table 32: Russia Botanical Industry Volume (K Tons) Forecast, by Application 2019 & 2032
- Table 33: Rest of Europe Botanical Industry Revenue (Million) Forecast, by Application 2019 & 2032
- Table 34: Rest of Europe Botanical Industry Volume (K Tons) Forecast, by Application 2019 & 2032
- Table 35: Global Botanical Industry Revenue Million Forecast, by Country 2019 & 2032
- Table 36: Global Botanical Industry Volume K Tons Forecast, by Country 2019 & 2032
- Table 37: China Botanical Industry Revenue (Million) Forecast, by Application 2019 & 2032
- Table 38: China Botanical Industry Volume (K Tons) Forecast, by Application 2019 & 2032
- Table 39: India Botanical Industry Revenue (Million) Forecast, by Application 2019 & 2032
- Table 40: India Botanical Industry Volume (K Tons) Forecast, by Application 2019 & 2032
- Table 41: Japan Botanical Industry Revenue (Million) Forecast, by Application 2019 & 2032
- Table 42: Japan Botanical Industry Volume (K Tons) Forecast, by Application 2019 & 2032
- Table 43: Australia Botanical Industry Revenue (Million) Forecast, by Application 2019 & 2032
- Table 44: Australia Botanical Industry Volume (K Tons) Forecast, by Application 2019 & 2032
- Table 45: Rest of Asia Pacific Botanical Industry Revenue (Million) Forecast, by Application 2019 & 2032
- Table 46: Rest of Asia Pacific Botanical Industry Volume (K Tons) Forecast, by Application 2019 & 2032
- Table 47: Global Botanical Industry Revenue Million Forecast, by Country 2019 & 2032
- Table 48: Global Botanical Industry Volume K Tons Forecast, by Country 2019 & 2032
- Table 49: Brazil Botanical Industry Revenue (Million) Forecast, by Application 2019 & 2032
- Table 50: Brazil Botanical Industry Volume (K Tons) Forecast, by Application 2019 & 2032
- Table 51: Argentina Botanical Industry Revenue (Million) Forecast, by Application 2019 & 2032
- Table 52: Argentina Botanical Industry Volume (K Tons) Forecast, by Application 2019 & 2032
- Table 53: Rest of South America Botanical Industry Revenue (Million) Forecast, by Application 2019 & 2032
- Table 54: Rest of South America Botanical Industry Volume (K Tons) Forecast, by Application 2019 & 2032
- Table 55: Global Botanical Industry Revenue Million Forecast, by Country 2019 & 2032
- Table 56: Global Botanical Industry Volume K Tons Forecast, by Country 2019 & 2032
- Table 57: Saudi Arabia Botanical Industry Revenue (Million) Forecast, by Application 2019 & 2032
- Table 58: Saudi Arabia Botanical Industry Volume (K Tons) Forecast, by Application 2019 & 2032
- Table 59: South Africa Botanical Industry Revenue (Million) Forecast, by Application 2019 & 2032
- Table 60: South Africa Botanical Industry Volume (K Tons) Forecast, by Application 2019 & 2032
- Table 61: Rest of Middle East and Africa Botanical Industry Revenue (Million) Forecast, by Application 2019 & 2032
- Table 62: Rest of Middle East and Africa Botanical Industry Volume (K Tons) Forecast, by Application 2019 & 2032
- Table 63: Global Botanical Industry Revenue Million Forecast, by Source 2019 & 2032
- Table 64: Global Botanical Industry Volume K Tons Forecast, by Source 2019 & 2032
- Table 65: Global Botanical Industry Revenue Million Forecast, by Application 2019 & 2032
- Table 66: Global Botanical Industry Volume K Tons Forecast, by Application 2019 & 2032
- Table 67: Global Botanical Industry Revenue Million Forecast, by Country 2019 & 2032
- Table 68: Global Botanical Industry Volume K Tons Forecast, by Country 2019 & 2032
- Table 69: United States Botanical Industry Revenue (Million) Forecast, by Application 2019 & 2032
- Table 70: United States Botanical Industry Volume (K Tons) Forecast, by Application 2019 & 2032
- Table 71: Canada Botanical Industry Revenue (Million) Forecast, by Application 2019 & 2032
- Table 72: Canada Botanical Industry Volume (K Tons) Forecast, by Application 2019 & 2032
- Table 73: Mexico Botanical Industry Revenue (Million) Forecast, by Application 2019 & 2032
- Table 74: Mexico Botanical Industry Volume (K Tons) Forecast, by Application 2019 & 2032
- Table 75: Rest of North America Botanical Industry Revenue (Million) Forecast, by Application 2019 & 2032
- Table 76: Rest of North America Botanical Industry Volume (K Tons) Forecast, by Application 2019 & 2032
- Table 77: Global Botanical Industry Revenue Million Forecast, by Source 2019 & 2032
- Table 78: Global Botanical Industry Volume K Tons Forecast, by Source 2019 & 2032
- Table 79: Global Botanical Industry Revenue Million Forecast, by Application 2019 & 2032
- Table 80: Global Botanical Industry Volume K Tons Forecast, by Application 2019 & 2032
- Table 81: Global Botanical Industry Revenue Million Forecast, by Country 2019 & 2032
- Table 82: Global Botanical Industry Volume K Tons Forecast, by Country 2019 & 2032
- Table 83: Spain Botanical Industry Revenue (Million) Forecast, by Application 2019 & 2032
- Table 84: Spain Botanical Industry Volume (K Tons) Forecast, by Application 2019 & 2032
- Table 85: United Kingdom Botanical Industry Revenue (Million) Forecast, by Application 2019 & 2032
- Table 86: United Kingdom Botanical Industry Volume (K Tons) Forecast, by Application 2019 & 2032
- Table 87: France Botanical Industry Revenue (Million) Forecast, by Application 2019 & 2032
- Table 88: France Botanical Industry Volume (K Tons) Forecast, by Application 2019 & 2032
- Table 89: Germany Botanical Industry Revenue (Million) Forecast, by Application 2019 & 2032
- Table 90: Germany Botanical Industry Volume (K Tons) Forecast, by Application 2019 & 2032
- Table 91: Italy Botanical Industry Revenue (Million) Forecast, by Application 2019 & 2032
- Table 92: Italy Botanical Industry Volume (K Tons) Forecast, by Application 2019 & 2032
- Table 93: Russia Botanical Industry Revenue (Million) Forecast, by Application 2019 & 2032
- Table 94: Russia Botanical Industry Volume (K Tons) Forecast, by Application 2019 & 2032
- Table 95: Rest of Europe Botanical Industry Revenue (Million) Forecast, by Application 2019 & 2032
- Table 96: Rest of Europe Botanical Industry Volume (K Tons) Forecast, by Application 2019 & 2032
- Table 97: Global Botanical Industry Revenue Million Forecast, by Source 2019 & 2032
- Table 98: Global Botanical Industry Volume K Tons Forecast, by Source 2019 & 2032
- Table 99: Global Botanical Industry Revenue Million Forecast, by Application 2019 & 2032
- Table 100: Global Botanical Industry Volume K Tons Forecast, by Application 2019 & 2032
- Table 101: Global Botanical Industry Revenue Million Forecast, by Country 2019 & 2032
- Table 102: Global Botanical Industry Volume K Tons Forecast, by Country 2019 & 2032
- Table 103: China Botanical Industry Revenue (Million) Forecast, by Application 2019 & 2032
- Table 104: China Botanical Industry Volume (K Tons) Forecast, by Application 2019 & 2032
- Table 105: India Botanical Industry Revenue (Million) Forecast, by Application 2019 & 2032
- Table 106: India Botanical Industry Volume (K Tons) Forecast, by Application 2019 & 2032
- Table 107: Japan Botanical Industry Revenue (Million) Forecast, by Application 2019 & 2032
- Table 108: Japan Botanical Industry Volume (K Tons) Forecast, by Application 2019 & 2032
- Table 109: Australia Botanical Industry Revenue (Million) Forecast, by Application 2019 & 2032
- Table 110: Australia Botanical Industry Volume (K Tons) Forecast, by Application 2019 & 2032
- Table 111: Rest of Asia Pacific Botanical Industry Revenue (Million) Forecast, by Application 2019 & 2032
- Table 112: Rest of Asia Pacific Botanical Industry Volume (K Tons) Forecast, by Application 2019 & 2032
- Table 113: Global Botanical Industry Revenue Million Forecast, by Source 2019 & 2032
- Table 114: Global Botanical Industry Volume K Tons Forecast, by Source 2019 & 2032
- Table 115: Global Botanical Industry Revenue Million Forecast, by Application 2019 & 2032
- Table 116: Global Botanical Industry Volume K Tons Forecast, by Application 2019 & 2032
- Table 117: Global Botanical Industry Revenue Million Forecast, by Country 2019 & 2032
- Table 118: Global Botanical Industry Volume K Tons Forecast, by Country 2019 & 2032
- Table 119: Brazil Botanical Industry Revenue (Million) Forecast, by Application 2019 & 2032
- Table 120: Brazil Botanical Industry Volume (K Tons) Forecast, by Application 2019 & 2032
- Table 121: Argentina Botanical Industry Revenue (Million) Forecast, by Application 2019 & 2032
- Table 122: Argentina Botanical Industry Volume (K Tons) Forecast, by Application 2019 & 2032
- Table 123: Rest of South America Botanical Industry Revenue (Million) Forecast, by Application 2019 & 2032
- Table 124: Rest of South America Botanical Industry Volume (K Tons) Forecast, by Application 2019 & 2032
- Table 125: Global Botanical Industry Revenue Million Forecast, by Source 2019 & 2032
- Table 126: Global Botanical Industry Volume K Tons Forecast, by Source 2019 & 2032
- Table 127: Global Botanical Industry Revenue Million Forecast, by Application 2019 & 2032
- Table 128: Global Botanical Industry Volume K Tons Forecast, by Application 2019 & 2032
- Table 129: Global Botanical Industry Revenue Million Forecast, by Country 2019 & 2032
- Table 130: Global Botanical Industry Volume K Tons Forecast, by Country 2019 & 2032
- Table 131: Saudi Arabia Botanical Industry Revenue (Million) Forecast, by Application 2019 & 2032
- Table 132: Saudi Arabia Botanical Industry Volume (K Tons) Forecast, by Application 2019 & 2032
- Table 133: South Africa Botanical Industry Revenue (Million) Forecast, by Application 2019 & 2032
- Table 134: South Africa Botanical Industry Volume (K Tons) Forecast, by Application 2019 & 2032
- Table 135: Rest of Middle East and Africa Botanical Industry Revenue (Million) Forecast, by Application 2019 & 2032
- Table 136: Rest of Middle East and Africa Botanical Industry Volume (K Tons) Forecast, by Application 2019 & 2032
Frequently Asked Questions
1. What is the projected Compound Annual Growth Rate (CAGR) of the Botanical Industry?
The projected CAGR is approximately 6.63%.
2. Which companies are prominent players in the Botanical Industry?
Key companies in the market include Firmenich SA, Synergy Flavors Inc, Blue Sky Botanics Ltd, Martin Bauer Group, International Flavors & Fragrances Inc, Bell Flavors & Fragrances, Ransom Naturals Ltd, Givaudan S A *List Not Exhaustive, Archer-Daniels-Midland Company, Symrise AG.
3. What are the main segments of the Botanical Industry?
The market segments include Source, Application.
4. Can you provide details about the market size?
The market size is estimated to be USD 113.48 Million as of 2022.
5. What are some drivers contributing to market growth?
Increasing Demand For Convenience & Processed Food.
6. What are the notable trends driving market growth?
Increasing awareness regarding clean label products.
7. Are there any restraints impacting market growth?
Increased Consumer Awareness On Side-Effects Of Chemical Additives.
8. Can you provide examples of recent developments in the market?
N/A
9. What pricing options are available for accessing the report?
Pricing options include single-user, multi-user, and enterprise licenses priced at USD 4750, USD 5250, and USD 8750 respectively.
10. Is the market size provided in terms of value or volume?
The market size is provided in terms of value, measured in Million and volume, measured in K Tons.
11. Are there any specific market keywords associated with the report?
Yes, the market keyword associated with the report is "Botanical Industry," which aids in identifying and referencing the specific market segment covered.
12. How do I determine which pricing option suits my needs best?
The pricing options vary based on user requirements and access needs. Individual users may opt for single-user licenses, while businesses requiring broader access may choose multi-user or enterprise licenses for cost-effective access to the report.
13. Are there any additional resources or data provided in the Botanical Industry report?
While the report offers comprehensive insights, it's advisable to review the specific contents or supplementary materials provided to ascertain if additional resources or data are available.
14. How can I stay updated on further developments or reports in the Botanical Industry?
To stay informed about further developments, trends, and reports in the Botanical Industry, consider subscribing to industry newsletters, following relevant companies and organizations, or regularly checking reputable industry news sources and publications.
Methodology
Step 1 - Identification of Relevant Samples Size from Population Database


Step 2 - Approaches for Defining Global Market Size (Value, Volume* & Price*)

Note*: In applicable scenarios
Step 3 - Data Sources
Primary Research
- Web Analytics
- Survey Reports
- Research Institute
- Latest Research Reports
- Opinion Leaders
Secondary Research
- Annual Reports
- White Paper
- Latest Press Release
- Industry Association
- Paid Database
- Investor Presentations

Step 4 - Data Triangulation
Involves using different sources of information in order to increase the validity of a study
These sources are likely to be stakeholders in a program - participants, other researchers, program staff, other community members, and so on.
Then we put all data in single framework & apply various statistical tools to find out the dynamic on the market.
During the analysis stage, feedback from the stakeholder groups would be compared to determine areas of agreement as well as areas of divergence


