

Key Insights
The global Botox market is poised for significant expansion, projected to reach an estimated $6.49 billion by 2025, with a robust Compound Annual Growth Rate (CAGR) of 9.20% anticipated to continue through 2033. This remarkable growth is underpinned by a confluence of evolving consumer preferences and advancements in therapeutic applications. The burgeoning demand for aesthetic procedures, particularly to address cosmetic concerns like glabellar lines, crow's feet, and forehead lines, is a primary driver. This trend is further amplified by increasing disposable incomes, growing awareness of minimally invasive treatments, and the rising influence of social media and celebrity endorsements on beauty standards. Concurrently, the non-cosmetic segment is witnessing substantial traction, driven by established therapeutic uses in managing conditions such as dystonia, chronic migraines, and certain ophthalmologic disorders. The efficacy of botulinum toxin in alleviating symptoms and improving quality of life for patients suffering from these ailments is a key factor contributing to market expansion in this area.
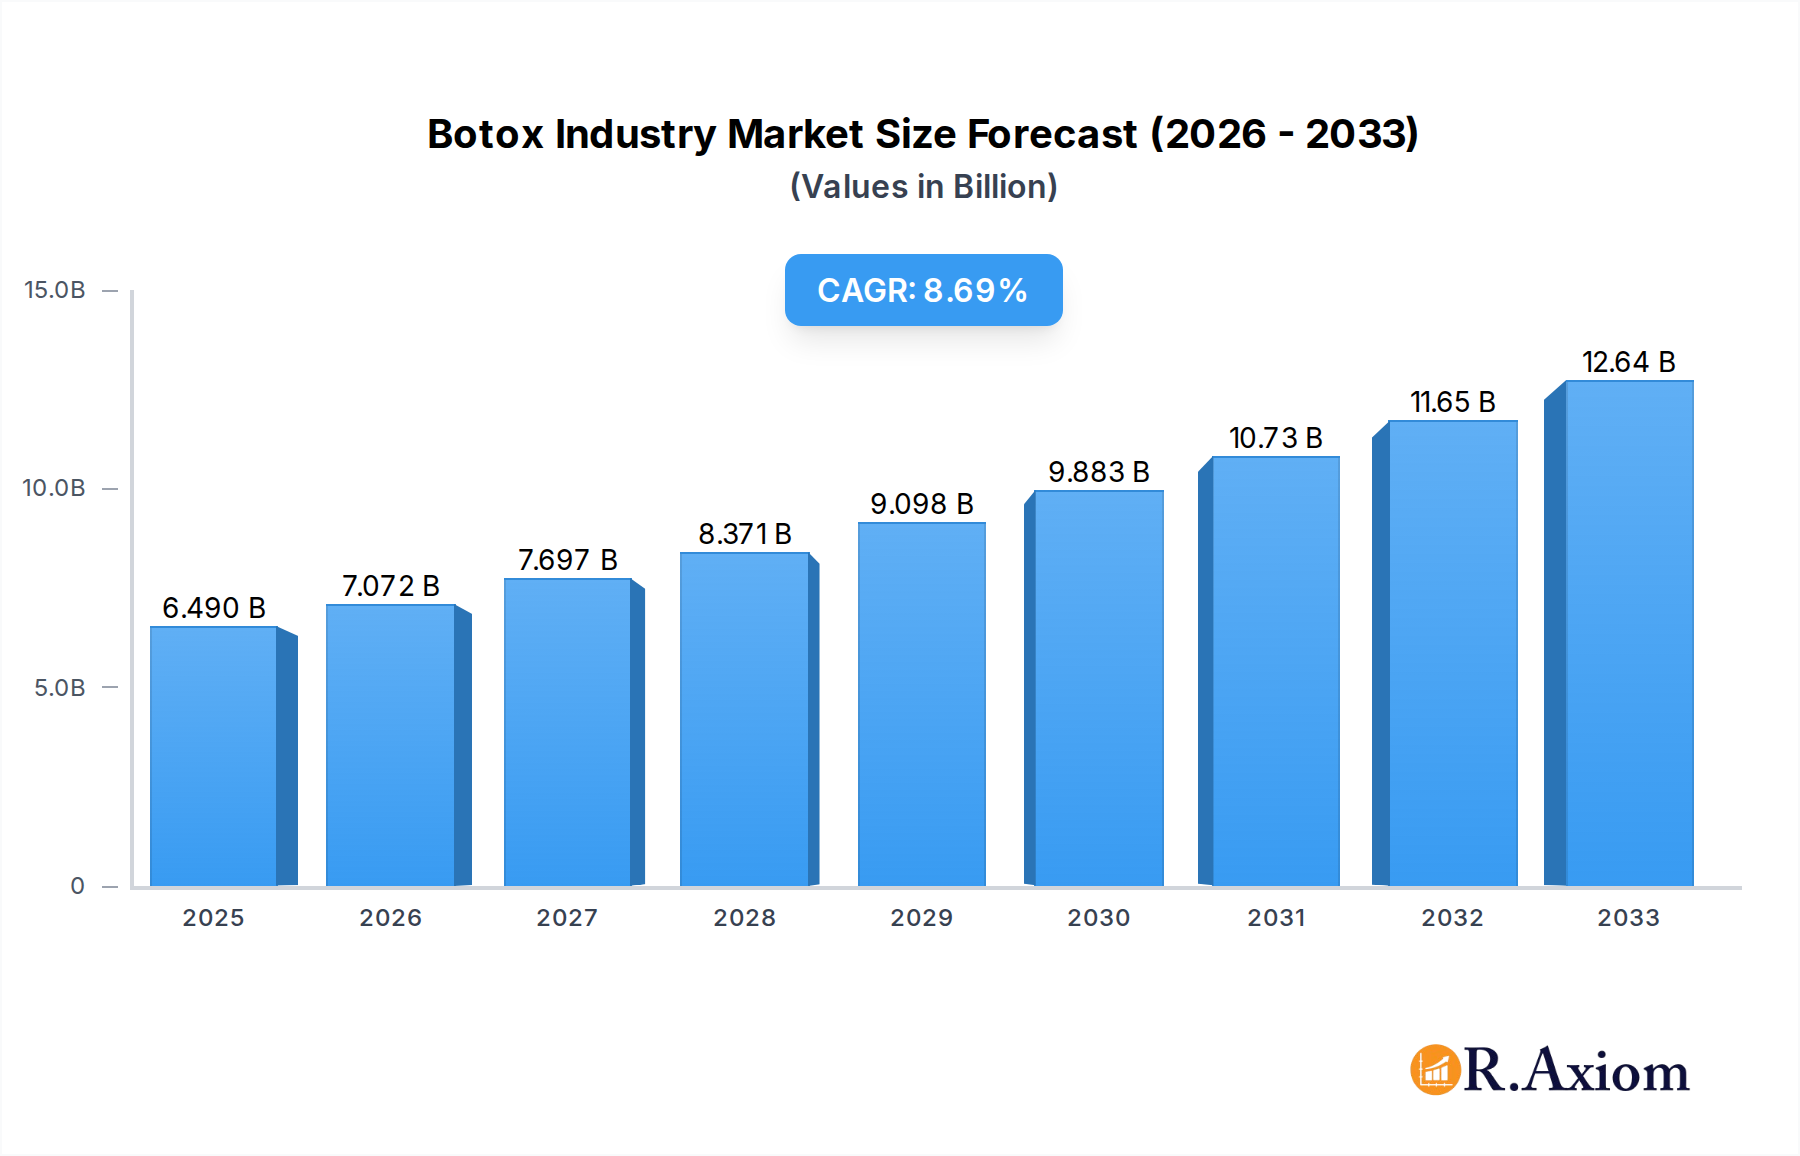
Botox Industry Market Size (In Billion)
The competitive landscape of the Botox market is characterized by the presence of major global players, including AbbVie Inc. (Allergan), Galderma, Medytox, and Revance Therapeutics Inc., who are actively engaged in research and development, product innovation, and strategic collaborations. These companies are focusing on expanding their product portfolios, seeking regulatory approvals for new indications, and enhancing their market penetration through strategic partnerships with clinics and hospitals. Geographically, North America and Europe currently dominate the market share due to high healthcare expenditure, advanced medical infrastructure, and a well-established aesthetic treatment market. However, the Asia Pacific region is emerging as a high-growth territory, fueled by a rapidly expanding middle class, increasing adoption of cosmetic procedures, and a growing number of local players entering the market. Restraints such as the potential for adverse effects, the need for skilled practitioners, and stringent regulatory frameworks are being addressed through continuous product refinement and educational initiatives, ensuring safe and effective utilization across diverse applications.

Botox Industry Company Market Share
This comprehensive report delves into the dynamic Botox industry, providing an in-depth analysis of market dynamics, growth drivers, emerging trends, and competitive landscape. Covering the study period 2019–2033, with a base year of 2025 and a forecast period of 2025–2033, this research offers actionable insights for industry stakeholders, investors, and decision-makers. The report meticulously examines key segments, including Cosmetic Applications (Glabellar Lines, Lateral Canthal Lines (Crow's Feet), Forehead Lines, Other Cosmetic Applications) and Non-cosmetic Applications (Dystonia, Chronic Migraine, Ophthalmologic Disorders, Other Non-cosmetic Applications), as well as End User segments such as Spas and Beauty Centers and Clinics and Hospitals. With an estimated market size exceeding XX million dollars in the base year, the global Botox market is poised for significant expansion, driven by increasing aesthetic consciousness, technological advancements, and a growing acceptance of neurotoxin treatments for medical conditions.
Botox Industry Market Concentration & Innovation
The Botox industry exhibits a moderate to high level of market concentration, with a few key players dominating the global market share, estimated at over XX million dollars. AbbVie Inc (Allergan) and Galderma are prominent leaders, holding substantial market influence. Innovation remains a critical driver, fueled by extensive research and development into novel neurotoxin formulations, improved delivery methods, and expanded therapeutic applications. Regulatory frameworks, particularly stringent approvals from agencies like the US FDA and EMA, shape the competitive landscape and influence product development timelines. Product substitutes, while emerging, currently pose a limited threat to established neurotoxin brands due to their proven efficacy and safety profiles. End-user trends are shifting towards minimally invasive procedures and an increasing demand for preventative treatments, impacting product demand. Mergers and acquisitions (M&A) activities, with estimated deal values reaching millions of dollars, are strategically employed by leading companies to expand their product portfolios, geographical reach, and technological capabilities.
Botox Industry Industry Trends & Insights
The Botox industry is experiencing robust growth, projected to achieve a Compound Annual Growth Rate (CAGR) of approximately XX% during the forecast period. This expansion is primarily propelled by a confluence of factors, including the escalating global demand for aesthetic enhancement procedures, a growing awareness and acceptance of botulinum toxin treatments for both cosmetic and medical indications, and significant advancements in research and development leading to novel product applications and improved efficacy. The increasing disposable income in developed and emerging economies further fuels consumer spending on non-surgical cosmetic procedures, contributing to higher market penetration. Technological disruptions, such as the development of longer-lasting formulations and less invasive injection techniques, are enhancing patient satisfaction and driving market adoption. Consumer preferences are increasingly leaning towards natural-looking results and preventative anti-aging treatments, influencing product development and marketing strategies. The competitive dynamics within the industry are characterized by intense innovation, strategic partnerships, and a focus on expanding indications and market access. Companies are investing heavily in clinical trials to validate new therapeutic uses for botulinum toxin, thereby broadening the market scope beyond traditional cosmetic applications. Furthermore, the growing aging population worldwide presents a sustained demand for rejuvenation therapies, solidifying the long-term growth trajectory of the Botox market.
Dominant Markets & Segments in Botox Industry
The Botox industry is segmented across various applications and end-user demographics, with Cosmetic Applications representing the largest and most influential segment, estimated to hold a market share of over XX%. Within cosmetic applications, Glabellar Lines (frown lines) continue to be the primary driver, accounting for a significant portion of the market revenue. However, there is a notable surge in demand for treatments addressing Lateral Canthal Lines (Crow's Feet) and Forehead Lines, reflecting evolving aesthetic goals. The Non-cosmetic Applications segment, while smaller in current market share, exhibits substantial growth potential, particularly in the treatment of Chronic Migraine and Dystonia. The growing recognition and efficacy of botulinum toxin in managing these debilitating medical conditions are leading to increased adoption and market expansion.
- Geographical Dominance: North America, particularly the United States, currently dominates the global Botox market, driven by high consumer spending on aesthetic procedures, a well-established healthcare infrastructure, and strong regulatory support for product approvals.
- Application Dominance: Cosmetic Applications are the dominant segment, fueled by the widespread desire for facial rejuvenation and anti-aging solutions. The increasing prevalence of social media and celebrity influence further amplifies the demand for cosmetic enhancements.
- End-User Dominance: Clinics and Hospitals are the leading end-user segment, owing to the specialized nature of botulinum toxin administration and the availability of trained medical professionals. However, Spas and Beauty Centers are witnessing a significant increase in their market share, particularly for less complex cosmetic applications, indicating a democratization of aesthetic treatments.
- Key Drivers for Cosmetic Applications:
- Rising Aesthetic Consciousness: A global trend towards self-care and appearance enhancement.
- Minimally Invasive Procedures: Botulinum toxin offers a non-surgical alternative to more invasive cosmetic surgeries.
- Technological Advancements: Development of refined formulations and injection techniques.
- Key Drivers for Non-cosmetic Applications:
- Increased Diagnosis Rates: Better identification and diagnosis of neurological and ophthalmologic disorders.
- Therapeutic Efficacy: Proven effectiveness in alleviating symptoms of chronic pain and involuntary muscle movements.
- Reimbursement Policies: Growing insurance coverage for medically necessary treatments.
Botox Industry Product Developments
Recent Botox industry product developments are centered on enhancing efficacy, safety, and patient convenience. Companies are investing in research for novel neurotoxin formulations with prolonged action and reduced side effects. Innovations are also focused on expanding the therapeutic applications of botulinum toxin, moving beyond traditional cosmetic uses into areas like overactive bladder and excessive sweating. The development of more precise and user-friendly delivery systems is another key trend, aiming to improve patient comfort and treatment outcomes. Competitive advantages are being gained through intellectual property protection for new formulations and production processes, as well as by obtaining regulatory approvals for expanded indications.
Report Scope & Segmentation Analysis
This report provides a comprehensive segmentation of the Botox industry across key categories. The Application segment is divided into Cosmetic Applications, encompassing Glabellar Lines, Lateral Canthal Lines (Crow's Feet), Forehead Lines, and Other Cosmetic Applications, and Non-cosmetic Applications, including Dystonia, Chronic Migraine, Ophthalmologic Disorders, and Other Non-cosmetic Applications. The End User segment is categorized into Spas and Beauty Centers and Clinics and Hospitals. Market growth projections for each segment are meticulously analyzed, with estimated market sizes for the base year and forecast period. Competitive dynamics within each segment are explored, highlighting the key players and their respective market shares.
Key Drivers of Botox Industry Growth
The Botox industry is propelled by several key growth drivers. Technologically, advancements in formulation and delivery systems enhance treatment efficacy and patient experience. Economically, rising disposable incomes globally translate to increased consumer spending on aesthetic and therapeutic treatments. Regulatory approvals for new indications, such as chronic migraine and muscle spasticity, significantly expand the market reach. Furthermore, an aging global population fuels the demand for anti-aging solutions, while increasing awareness of neurotoxin benefits for medical conditions drives adoption in the healthcare sector.
Challenges in the Botox Industry Sector
Despite robust growth, the Botox industry faces several challenges. Stringent and lengthy regulatory approval processes for new indications can delay market entry and increase development costs, estimated to be in the millions of dollars. Supply chain complexities and potential disruptions can impact product availability and distribution, especially for specialized raw materials. Intense competitive pressures, with new entrants and established players vying for market share, can lead to price erosion and necessitate continuous innovation. Public perception and potential misinformation regarding the safety and efficacy of neurotoxin treatments also present a persistent challenge, requiring ongoing educational initiatives.
Emerging Opportunities in Botox Industry
Emerging opportunities within the Botox industry lie in the exploration of novel therapeutic applications, such as the treatment of depression, pain management, and other neurological disorders, which could unlock significant market potential measured in millions. The growing demand for preventative anti-aging treatments, particularly among younger demographics, presents a substantial market opportunity. Expansion into emerging economies with rising disposable incomes and increasing aesthetic awareness offers considerable growth prospects. Furthermore, the development of advanced drug delivery systems and personalized treatment approaches can create new market niches and competitive advantages.
Leading Players in the Botox Industry Market
- AbbVie Inc (Allergan)
- Galderma
- Medytox
- Revance Therapeutics Inc (Revance Aesthetics)
- Evolus Inc
- Hughs
- Merz Pharma GmbH & Co KGaA
- Daewoong Pharmaceuticals
- Eisai
- Ipsen Biopharmaceuticals Inc
- HUGEL
- USWM LLC
Key Developments in Botox Industry Industry
- March 2024: Hugel America Inc. announced that the United States Food and Drugs Administration (US FDA) had approved Letybo (Neurotoxin) for the management of moderate-to-severe glabellar (frown) lines in adults.
- October 2023: Huadong Medicine Aesthetics Investment (HongKong) Limited (Sinclair) formed a global license agreement with ATGC Co. Ltd to manufacture and commercialize ATGC-110 (botulinum toxin) globally.
Strategic Outlook for Botox Industry Market
The strategic outlook for the Botox industry remains exceptionally positive, driven by sustained innovation and expanding therapeutic applications. The market is anticipated to witness continued growth through the development of new neurotoxin products with improved efficacy and longer duration of action, potentially increasing annual revenues by millions. Strategic partnerships and acquisitions will play a crucial role in consolidating market positions and accessing new technologies or geographic regions. Furthermore, the growing acceptance of botulinum toxin for a wider range of medical conditions, beyond cosmetic uses, represents a significant avenue for future growth, promising substantial market expansion and revenue generation.
Botox Industry Segmentation
-
1. Application
-
1.1. Cosmetic Applications
- 1.1.1. Glabellar Lines
- 1.1.2. Lateral Canthal Lines (Crow's Feet)
- 1.1.3. Forehead Lines
- 1.1.4. Other Cosmetic Applications
-
1.2. Non-cosmetic Applications
- 1.2.1. Dystonia
- 1.2.2. Chronic Migraine
- 1.2.3. Ophthalmologic Disorders
- 1.2.4. Other Non-cosmetic Applications
-
1.1. Cosmetic Applications
-
2. End User
- 2.1. Spas and Beauty Centers
- 2.2. Clinics and Hospitals
Botox Industry Segmentation By Geography
-
1. North America
- 1.1. United States
- 1.2. Canada
- 1.3. Mexico
-
2. Europe
- 2.1. Germany
- 2.2. United Kingdom
- 2.3. France
- 2.4. Italy
- 2.5. Spain
- 2.6. Rest of Europe
-
3. Asia Pacific
- 3.1. China
- 3.2. Japan
- 3.3. India
- 3.4. Australia
- 3.5. South Korea
- 3.6. Rest of Asia Pacific
-
4. Middle East and Africa
- 4.1. GCC
- 4.2. South Africa
- 4.3. Rest of Middle East and Africa
-
5. South America
- 5.1. Brazil
- 5.2. Argentina
- 5.3. Rest of South America
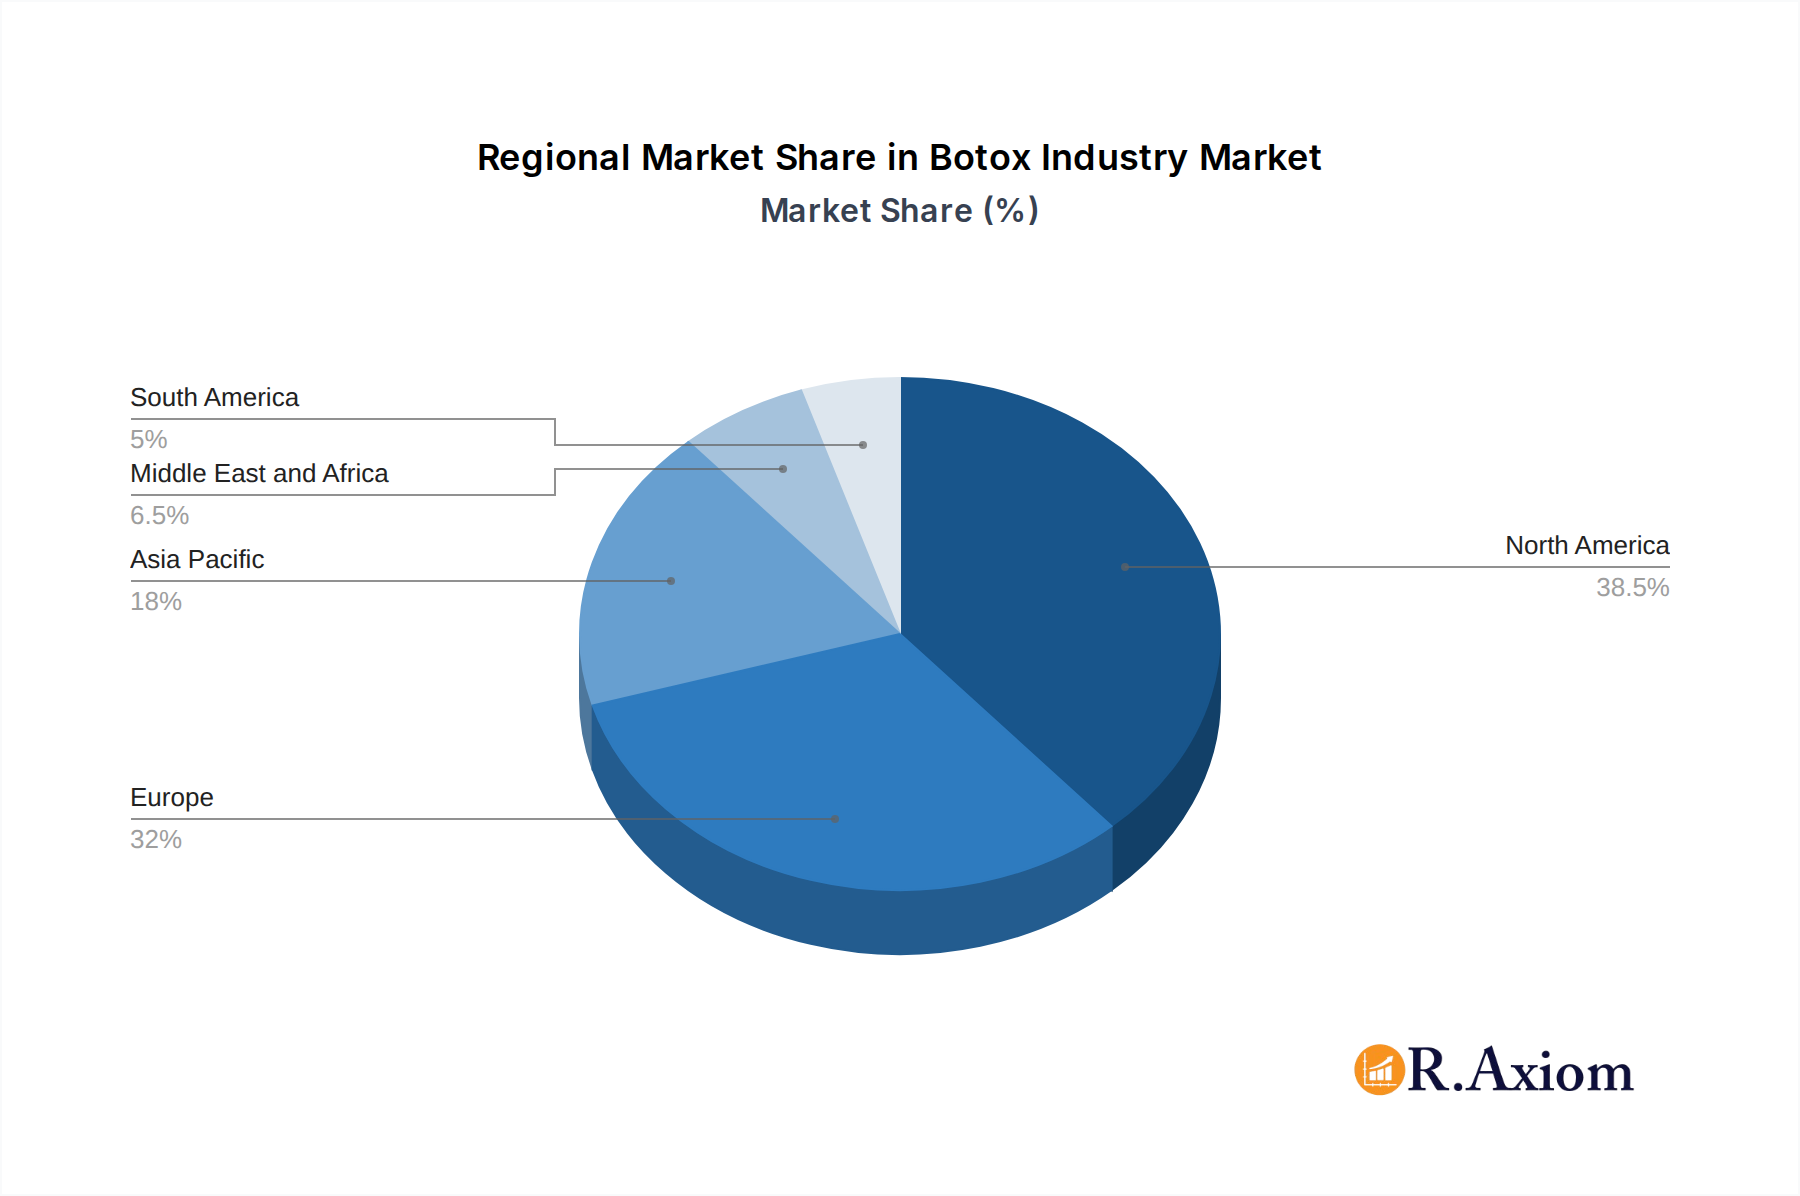
Botox Industry Regional Market Share
Geographic Coverage of Botox Industry
Botox Industry REPORT HIGHLIGHTS
| Aspects | Details |
|---|---|
| Study Period | 2020-2034 |
| Base Year | 2025 |
| Estimated Year | 2026 |
| Forecast Period | 2026-2034 |
| Historical Period | 2020-2025 |
| Growth Rate | CAGR of 9.20% from 2020-2034 |
| Segmentation |
|
Table of Contents
- 1. Introduction
- 1.1. Research Scope
- 1.2. Market Segmentation
- 1.3. Research Objective
- 1.4. Definitions and Assumptions
- 2. Executive Summary
- 2.1. Market Snapshot
- 3. Market Dynamics
- 3.1. Market Drivers
- 3.2. Market Restrains
- 3.3. Market Trends
- 3.4. Market Opportunities
- 4. Market Factor Analysis
- 4.1. Porters Five Forces
- 4.1.1. Bargaining Power of Suppliers
- 4.1.2. Bargaining Power of Buyers
- 4.1.3. Threat of New Entrants
- 4.1.4. Threat of Substitutes
- 4.1.5. Competitive Rivalry
- 4.2. PESTEL analysis
- 4.3. BCG Analysis
- 4.3.1. Stars (High Growth, High Market Share)
- 4.3.2. Cash Cows (Low Growth, High Market Share)
- 4.3.3. Question Mark (High Growth, Low Market Share)
- 4.3.4. Dogs (Low Growth, Low Market Share)
- 4.4. Ansoff Matrix Analysis
- 4.5. Supply Chain Analysis
- 4.6. Regulatory Landscape
- 4.7. Current Market Potential and Opportunity Assessment (TAM–SAM–SOM Framework)
- 4.8. RAX Analyst Note
- 4.1. Porters Five Forces
- 5. Market Analysis, Insights and Forecast 2021-2033
- 5.1. Market Analysis, Insights and Forecast - by Application
- 5.1.1. Cosmetic Applications
- 5.1.1.1. Glabellar Lines
- 5.1.1.2. Lateral Canthal Lines (Crow's Feet)
- 5.1.1.3. Forehead Lines
- 5.1.1.4. Other Cosmetic Applications
- 5.1.2. Non-cosmetic Applications
- 5.1.2.1. Dystonia
- 5.1.2.2. Chronic Migraine
- 5.1.2.3. Ophthalmologic Disorders
- 5.1.2.4. Other Non-cosmetic Applications
- 5.1.1. Cosmetic Applications
- 5.2. Market Analysis, Insights and Forecast - by End User
- 5.2.1. Spas and Beauty Centers
- 5.2.2. Clinics and Hospitals
- 5.3. Market Analysis, Insights and Forecast - by Region
- 5.3.1. North America
- 5.3.2. Europe
- 5.3.3. Asia Pacific
- 5.3.4. Middle East and Africa
- 5.3.5. South America
- 5.1. Market Analysis, Insights and Forecast - by Application
- 6. Global Botox Industry Analysis, Insights and Forecast, 2021-2033
- 6.1. Market Analysis, Insights and Forecast - by Application
- 6.1.1. Cosmetic Applications
- 6.1.1.1. Glabellar Lines
- 6.1.1.2. Lateral Canthal Lines (Crow's Feet)
- 6.1.1.3. Forehead Lines
- 6.1.1.4. Other Cosmetic Applications
- 6.1.2. Non-cosmetic Applications
- 6.1.2.1. Dystonia
- 6.1.2.2. Chronic Migraine
- 6.1.2.3. Ophthalmologic Disorders
- 6.1.2.4. Other Non-cosmetic Applications
- 6.1.1. Cosmetic Applications
- 6.2. Market Analysis, Insights and Forecast - by End User
- 6.2.1. Spas and Beauty Centers
- 6.2.2. Clinics and Hospitals
- 6.1. Market Analysis, Insights and Forecast - by Application
- 7. North America Botox Industry Analysis, Insights and Forecast, 2020-2032
- 7.1. Market Analysis, Insights and Forecast - by Application
- 7.1.1. Cosmetic Applications
- 7.1.1.1. Glabellar Lines
- 7.1.1.2. Lateral Canthal Lines (Crow's Feet)
- 7.1.1.3. Forehead Lines
- 7.1.1.4. Other Cosmetic Applications
- 7.1.2. Non-cosmetic Applications
- 7.1.2.1. Dystonia
- 7.1.2.2. Chronic Migraine
- 7.1.2.3. Ophthalmologic Disorders
- 7.1.2.4. Other Non-cosmetic Applications
- 7.1.1. Cosmetic Applications
- 7.2. Market Analysis, Insights and Forecast - by End User
- 7.2.1. Spas and Beauty Centers
- 7.2.2. Clinics and Hospitals
- 7.1. Market Analysis, Insights and Forecast - by Application
- 8. Europe Botox Industry Analysis, Insights and Forecast, 2020-2032
- 8.1. Market Analysis, Insights and Forecast - by Application
- 8.1.1. Cosmetic Applications
- 8.1.1.1. Glabellar Lines
- 8.1.1.2. Lateral Canthal Lines (Crow's Feet)
- 8.1.1.3. Forehead Lines
- 8.1.1.4. Other Cosmetic Applications
- 8.1.2. Non-cosmetic Applications
- 8.1.2.1. Dystonia
- 8.1.2.2. Chronic Migraine
- 8.1.2.3. Ophthalmologic Disorders
- 8.1.2.4. Other Non-cosmetic Applications
- 8.1.1. Cosmetic Applications
- 8.2. Market Analysis, Insights and Forecast - by End User
- 8.2.1. Spas and Beauty Centers
- 8.2.2. Clinics and Hospitals
- 8.1. Market Analysis, Insights and Forecast - by Application
- 9. Asia Pacific Botox Industry Analysis, Insights and Forecast, 2020-2032
- 9.1. Market Analysis, Insights and Forecast - by Application
- 9.1.1. Cosmetic Applications
- 9.1.1.1. Glabellar Lines
- 9.1.1.2. Lateral Canthal Lines (Crow's Feet)
- 9.1.1.3. Forehead Lines
- 9.1.1.4. Other Cosmetic Applications
- 9.1.2. Non-cosmetic Applications
- 9.1.2.1. Dystonia
- 9.1.2.2. Chronic Migraine
- 9.1.2.3. Ophthalmologic Disorders
- 9.1.2.4. Other Non-cosmetic Applications
- 9.1.1. Cosmetic Applications
- 9.2. Market Analysis, Insights and Forecast - by End User
- 9.2.1. Spas and Beauty Centers
- 9.2.2. Clinics and Hospitals
- 9.1. Market Analysis, Insights and Forecast - by Application
- 10. Middle East and Africa Botox Industry Analysis, Insights and Forecast, 2020-2032
- 10.1. Market Analysis, Insights and Forecast - by Application
- 10.1.1. Cosmetic Applications
- 10.1.1.1. Glabellar Lines
- 10.1.1.2. Lateral Canthal Lines (Crow's Feet)
- 10.1.1.3. Forehead Lines
- 10.1.1.4. Other Cosmetic Applications
- 10.1.2. Non-cosmetic Applications
- 10.1.2.1. Dystonia
- 10.1.2.2. Chronic Migraine
- 10.1.2.3. Ophthalmologic Disorders
- 10.1.2.4. Other Non-cosmetic Applications
- 10.1.1. Cosmetic Applications
- 10.2. Market Analysis, Insights and Forecast - by End User
- 10.2.1. Spas and Beauty Centers
- 10.2.2. Clinics and Hospitals
- 10.1. Market Analysis, Insights and Forecast - by Application
- 11. South America Botox Industry Analysis, Insights and Forecast, 2020-2032
- 11.1. Market Analysis, Insights and Forecast - by Application
- 11.1.1. Cosmetic Applications
- 11.1.1.1. Glabellar Lines
- 11.1.1.2. Lateral Canthal Lines (Crow's Feet)
- 11.1.1.3. Forehead Lines
- 11.1.1.4. Other Cosmetic Applications
- 11.1.2. Non-cosmetic Applications
- 11.1.2.1. Dystonia
- 11.1.2.2. Chronic Migraine
- 11.1.2.3. Ophthalmologic Disorders
- 11.1.2.4. Other Non-cosmetic Applications
- 11.1.1. Cosmetic Applications
- 11.2. Market Analysis, Insights and Forecast - by End User
- 11.2.1. Spas and Beauty Centers
- 11.2.2. Clinics and Hospitals
- 11.1. Market Analysis, Insights and Forecast - by Application
- 12. Competitive Analysis
- 12.1. Company Profiles
- 12.1.1 AbbVie Inc (Allergan)
- 12.1.1.1. Company Overview
- 12.1.1.2. Products
- 12.1.1.3. Company Financials
- 12.1.1.4. SWOT Analysis
- 12.1.2 Galderma
- 12.1.2.1. Company Overview
- 12.1.2.2. Products
- 12.1.2.3. Company Financials
- 12.1.2.4. SWOT Analysis
- 12.1.3 Medytox
- 12.1.3.1. Company Overview
- 12.1.3.2. Products
- 12.1.3.3. Company Financials
- 12.1.3.4. SWOT Analysis
- 12.1.4 Revance Therapeutics Inc (Revance Aesthetics)
- 12.1.4.1. Company Overview
- 12.1.4.2. Products
- 12.1.4.3. Company Financials
- 12.1.4.4. SWOT Analysis
- 12.1.5 Evolus Inc
- 12.1.5.1. Company Overview
- 12.1.5.2. Products
- 12.1.5.3. Company Financials
- 12.1.5.4. SWOT Analysis
- 12.1.6 Hughs
- 12.1.6.1. Company Overview
- 12.1.6.2. Products
- 12.1.6.3. Company Financials
- 12.1.6.4. SWOT Analysis
- 12.1.7 Merz Pharma GmbH & Co KGaA
- 12.1.7.1. Company Overview
- 12.1.7.2. Products
- 12.1.7.3. Company Financials
- 12.1.7.4. SWOT Analysis
- 12.1.8 Daewoong Pharmaceuticals
- 12.1.8.1. Company Overview
- 12.1.8.2. Products
- 12.1.8.3. Company Financials
- 12.1.8.4. SWOT Analysis
- 12.1.9 Eisai
- 12.1.9.1. Company Overview
- 12.1.9.2. Products
- 12.1.9.3. Company Financials
- 12.1.9.4. SWOT Analysis
- 12.1.10 Ipsen Biopharmaceuticals Inc
- 12.1.10.1. Company Overview
- 12.1.10.2. Products
- 12.1.10.3. Company Financials
- 12.1.10.4. SWOT Analysis
- 12.1.11 HUGEL
- 12.1.11.1. Company Overview
- 12.1.11.2. Products
- 12.1.11.3. Company Financials
- 12.1.11.4. SWOT Analysis
- 12.1.12 USWM LLC
- 12.1.12.1. Company Overview
- 12.1.12.2. Products
- 12.1.12.3. Company Financials
- 12.1.12.4. SWOT Analysis
- 12.1.1 AbbVie Inc (Allergan)
- 12.2. Market Entropy
- 12.2.1 Company's Key Areas Served
- 12.2.2 Recent Developments
- 12.3. Company Market Share Analysis 2025
- 12.3.1 Top 5 Companies Market Share Analysis
- 12.3.2 Top 3 Companies Market Share Analysis
- 12.4. List of Potential Customers
- 13. Research Methodology
List of Figures
- Figure 1: Global Botox Industry Revenue Breakdown (Million, %) by Region 2025 & 2033
- Figure 2: Global Botox Industry Volume Breakdown (K Unit, %) by Region 2025 & 2033
- Figure 3: North America Botox Industry Revenue (Million), by Application 2025 & 2033
- Figure 4: North America Botox Industry Volume (K Unit), by Application 2025 & 2033
- Figure 5: North America Botox Industry Revenue Share (%), by Application 2025 & 2033
- Figure 6: North America Botox Industry Volume Share (%), by Application 2025 & 2033
- Figure 7: North America Botox Industry Revenue (Million), by End User 2025 & 2033
- Figure 8: North America Botox Industry Volume (K Unit), by End User 2025 & 2033
- Figure 9: North America Botox Industry Revenue Share (%), by End User 2025 & 2033
- Figure 10: North America Botox Industry Volume Share (%), by End User 2025 & 2033
- Figure 11: North America Botox Industry Revenue (Million), by Country 2025 & 2033
- Figure 12: North America Botox Industry Volume (K Unit), by Country 2025 & 2033
- Figure 13: North America Botox Industry Revenue Share (%), by Country 2025 & 2033
- Figure 14: North America Botox Industry Volume Share (%), by Country 2025 & 2033
- Figure 15: Europe Botox Industry Revenue (Million), by Application 2025 & 2033
- Figure 16: Europe Botox Industry Volume (K Unit), by Application 2025 & 2033
- Figure 17: Europe Botox Industry Revenue Share (%), by Application 2025 & 2033
- Figure 18: Europe Botox Industry Volume Share (%), by Application 2025 & 2033
- Figure 19: Europe Botox Industry Revenue (Million), by End User 2025 & 2033
- Figure 20: Europe Botox Industry Volume (K Unit), by End User 2025 & 2033
- Figure 21: Europe Botox Industry Revenue Share (%), by End User 2025 & 2033
- Figure 22: Europe Botox Industry Volume Share (%), by End User 2025 & 2033
- Figure 23: Europe Botox Industry Revenue (Million), by Country 2025 & 2033
- Figure 24: Europe Botox Industry Volume (K Unit), by Country 2025 & 2033
- Figure 25: Europe Botox Industry Revenue Share (%), by Country 2025 & 2033
- Figure 26: Europe Botox Industry Volume Share (%), by Country 2025 & 2033
- Figure 27: Asia Pacific Botox Industry Revenue (Million), by Application 2025 & 2033
- Figure 28: Asia Pacific Botox Industry Volume (K Unit), by Application 2025 & 2033
- Figure 29: Asia Pacific Botox Industry Revenue Share (%), by Application 2025 & 2033
- Figure 30: Asia Pacific Botox Industry Volume Share (%), by Application 2025 & 2033
- Figure 31: Asia Pacific Botox Industry Revenue (Million), by End User 2025 & 2033
- Figure 32: Asia Pacific Botox Industry Volume (K Unit), by End User 2025 & 2033
- Figure 33: Asia Pacific Botox Industry Revenue Share (%), by End User 2025 & 2033
- Figure 34: Asia Pacific Botox Industry Volume Share (%), by End User 2025 & 2033
- Figure 35: Asia Pacific Botox Industry Revenue (Million), by Country 2025 & 2033
- Figure 36: Asia Pacific Botox Industry Volume (K Unit), by Country 2025 & 2033
- Figure 37: Asia Pacific Botox Industry Revenue Share (%), by Country 2025 & 2033
- Figure 38: Asia Pacific Botox Industry Volume Share (%), by Country 2025 & 2033
- Figure 39: Middle East and Africa Botox Industry Revenue (Million), by Application 2025 & 2033
- Figure 40: Middle East and Africa Botox Industry Volume (K Unit), by Application 2025 & 2033
- Figure 41: Middle East and Africa Botox Industry Revenue Share (%), by Application 2025 & 2033
- Figure 42: Middle East and Africa Botox Industry Volume Share (%), by Application 2025 & 2033
- Figure 43: Middle East and Africa Botox Industry Revenue (Million), by End User 2025 & 2033
- Figure 44: Middle East and Africa Botox Industry Volume (K Unit), by End User 2025 & 2033
- Figure 45: Middle East and Africa Botox Industry Revenue Share (%), by End User 2025 & 2033
- Figure 46: Middle East and Africa Botox Industry Volume Share (%), by End User 2025 & 2033
- Figure 47: Middle East and Africa Botox Industry Revenue (Million), by Country 2025 & 2033
- Figure 48: Middle East and Africa Botox Industry Volume (K Unit), by Country 2025 & 2033
- Figure 49: Middle East and Africa Botox Industry Revenue Share (%), by Country 2025 & 2033
- Figure 50: Middle East and Africa Botox Industry Volume Share (%), by Country 2025 & 2033
- Figure 51: South America Botox Industry Revenue (Million), by Application 2025 & 2033
- Figure 52: South America Botox Industry Volume (K Unit), by Application 2025 & 2033
- Figure 53: South America Botox Industry Revenue Share (%), by Application 2025 & 2033
- Figure 54: South America Botox Industry Volume Share (%), by Application 2025 & 2033
- Figure 55: South America Botox Industry Revenue (Million), by End User 2025 & 2033
- Figure 56: South America Botox Industry Volume (K Unit), by End User 2025 & 2033
- Figure 57: South America Botox Industry Revenue Share (%), by End User 2025 & 2033
- Figure 58: South America Botox Industry Volume Share (%), by End User 2025 & 2033
- Figure 59: South America Botox Industry Revenue (Million), by Country 2025 & 2033
- Figure 60: South America Botox Industry Volume (K Unit), by Country 2025 & 2033
- Figure 61: South America Botox Industry Revenue Share (%), by Country 2025 & 2033
- Figure 62: South America Botox Industry Volume Share (%), by Country 2025 & 2033
List of Tables
- Table 1: Global Botox Industry Revenue Million Forecast, by Application 2020 & 2033
- Table 2: Global Botox Industry Volume K Unit Forecast, by Application 2020 & 2033
- Table 3: Global Botox Industry Revenue Million Forecast, by End User 2020 & 2033
- Table 4: Global Botox Industry Volume K Unit Forecast, by End User 2020 & 2033
- Table 5: Global Botox Industry Revenue Million Forecast, by Region 2020 & 2033
- Table 6: Global Botox Industry Volume K Unit Forecast, by Region 2020 & 2033
- Table 7: Global Botox Industry Revenue Million Forecast, by Application 2020 & 2033
- Table 8: Global Botox Industry Volume K Unit Forecast, by Application 2020 & 2033
- Table 9: Global Botox Industry Revenue Million Forecast, by End User 2020 & 2033
- Table 10: Global Botox Industry Volume K Unit Forecast, by End User 2020 & 2033
- Table 11: Global Botox Industry Revenue Million Forecast, by Country 2020 & 2033
- Table 12: Global Botox Industry Volume K Unit Forecast, by Country 2020 & 2033
- Table 13: United States Botox Industry Revenue (Million) Forecast, by Application 2020 & 2033
- Table 14: United States Botox Industry Volume (K Unit) Forecast, by Application 2020 & 2033
- Table 15: Canada Botox Industry Revenue (Million) Forecast, by Application 2020 & 2033
- Table 16: Canada Botox Industry Volume (K Unit) Forecast, by Application 2020 & 2033
- Table 17: Mexico Botox Industry Revenue (Million) Forecast, by Application 2020 & 2033
- Table 18: Mexico Botox Industry Volume (K Unit) Forecast, by Application 2020 & 2033
- Table 19: Global Botox Industry Revenue Million Forecast, by Application 2020 & 2033
- Table 20: Global Botox Industry Volume K Unit Forecast, by Application 2020 & 2033
- Table 21: Global Botox Industry Revenue Million Forecast, by End User 2020 & 2033
- Table 22: Global Botox Industry Volume K Unit Forecast, by End User 2020 & 2033
- Table 23: Global Botox Industry Revenue Million Forecast, by Country 2020 & 2033
- Table 24: Global Botox Industry Volume K Unit Forecast, by Country 2020 & 2033
- Table 25: Germany Botox Industry Revenue (Million) Forecast, by Application 2020 & 2033
- Table 26: Germany Botox Industry Volume (K Unit) Forecast, by Application 2020 & 2033
- Table 27: United Kingdom Botox Industry Revenue (Million) Forecast, by Application 2020 & 2033
- Table 28: United Kingdom Botox Industry Volume (K Unit) Forecast, by Application 2020 & 2033
- Table 29: France Botox Industry Revenue (Million) Forecast, by Application 2020 & 2033
- Table 30: France Botox Industry Volume (K Unit) Forecast, by Application 2020 & 2033
- Table 31: Italy Botox Industry Revenue (Million) Forecast, by Application 2020 & 2033
- Table 32: Italy Botox Industry Volume (K Unit) Forecast, by Application 2020 & 2033
- Table 33: Spain Botox Industry Revenue (Million) Forecast, by Application 2020 & 2033
- Table 34: Spain Botox Industry Volume (K Unit) Forecast, by Application 2020 & 2033
- Table 35: Rest of Europe Botox Industry Revenue (Million) Forecast, by Application 2020 & 2033
- Table 36: Rest of Europe Botox Industry Volume (K Unit) Forecast, by Application 2020 & 2033
- Table 37: Global Botox Industry Revenue Million Forecast, by Application 2020 & 2033
- Table 38: Global Botox Industry Volume K Unit Forecast, by Application 2020 & 2033
- Table 39: Global Botox Industry Revenue Million Forecast, by End User 2020 & 2033
- Table 40: Global Botox Industry Volume K Unit Forecast, by End User 2020 & 2033
- Table 41: Global Botox Industry Revenue Million Forecast, by Country 2020 & 2033
- Table 42: Global Botox Industry Volume K Unit Forecast, by Country 2020 & 2033
- Table 43: China Botox Industry Revenue (Million) Forecast, by Application 2020 & 2033
- Table 44: China Botox Industry Volume (K Unit) Forecast, by Application 2020 & 2033
- Table 45: Japan Botox Industry Revenue (Million) Forecast, by Application 2020 & 2033
- Table 46: Japan Botox Industry Volume (K Unit) Forecast, by Application 2020 & 2033
- Table 47: India Botox Industry Revenue (Million) Forecast, by Application 2020 & 2033
- Table 48: India Botox Industry Volume (K Unit) Forecast, by Application 2020 & 2033
- Table 49: Australia Botox Industry Revenue (Million) Forecast, by Application 2020 & 2033
- Table 50: Australia Botox Industry Volume (K Unit) Forecast, by Application 2020 & 2033
- Table 51: South Korea Botox Industry Revenue (Million) Forecast, by Application 2020 & 2033
- Table 52: South Korea Botox Industry Volume (K Unit) Forecast, by Application 2020 & 2033
- Table 53: Rest of Asia Pacific Botox Industry Revenue (Million) Forecast, by Application 2020 & 2033
- Table 54: Rest of Asia Pacific Botox Industry Volume (K Unit) Forecast, by Application 2020 & 2033
- Table 55: Global Botox Industry Revenue Million Forecast, by Application 2020 & 2033
- Table 56: Global Botox Industry Volume K Unit Forecast, by Application 2020 & 2033
- Table 57: Global Botox Industry Revenue Million Forecast, by End User 2020 & 2033
- Table 58: Global Botox Industry Volume K Unit Forecast, by End User 2020 & 2033
- Table 59: Global Botox Industry Revenue Million Forecast, by Country 2020 & 2033
- Table 60: Global Botox Industry Volume K Unit Forecast, by Country 2020 & 2033
- Table 61: GCC Botox Industry Revenue (Million) Forecast, by Application 2020 & 2033
- Table 62: GCC Botox Industry Volume (K Unit) Forecast, by Application 2020 & 2033
- Table 63: South Africa Botox Industry Revenue (Million) Forecast, by Application 2020 & 2033
- Table 64: South Africa Botox Industry Volume (K Unit) Forecast, by Application 2020 & 2033
- Table 65: Rest of Middle East and Africa Botox Industry Revenue (Million) Forecast, by Application 2020 & 2033
- Table 66: Rest of Middle East and Africa Botox Industry Volume (K Unit) Forecast, by Application 2020 & 2033
- Table 67: Global Botox Industry Revenue Million Forecast, by Application 2020 & 2033
- Table 68: Global Botox Industry Volume K Unit Forecast, by Application 2020 & 2033
- Table 69: Global Botox Industry Revenue Million Forecast, by End User 2020 & 2033
- Table 70: Global Botox Industry Volume K Unit Forecast, by End User 2020 & 2033
- Table 71: Global Botox Industry Revenue Million Forecast, by Country 2020 & 2033
- Table 72: Global Botox Industry Volume K Unit Forecast, by Country 2020 & 2033
- Table 73: Brazil Botox Industry Revenue (Million) Forecast, by Application 2020 & 2033
- Table 74: Brazil Botox Industry Volume (K Unit) Forecast, by Application 2020 & 2033
- Table 75: Argentina Botox Industry Revenue (Million) Forecast, by Application 2020 & 2033
- Table 76: Argentina Botox Industry Volume (K Unit) Forecast, by Application 2020 & 2033
- Table 77: Rest of South America Botox Industry Revenue (Million) Forecast, by Application 2020 & 2033
- Table 78: Rest of South America Botox Industry Volume (K Unit) Forecast, by Application 2020 & 2033
Frequently Asked Questions
1. What is the projected Compound Annual Growth Rate (CAGR) of the Botox Industry?
The projected CAGR is approximately 9.20%.
2. Which companies are prominent players in the Botox Industry?
Key companies in the market include AbbVie Inc (Allergan), Galderma, Medytox, Revance Therapeutics Inc (Revance Aesthetics), Evolus Inc, Hughs, Merz Pharma GmbH & Co KGaA, Daewoong Pharmaceuticals, Eisai, Ipsen Biopharmaceuticals Inc, HUGEL, USWM LLC.
3. What are the main segments of the Botox Industry?
The market segments include Application, End User.
4. Can you provide details about the market size?
The market size is estimated to be USD 6.49 Million as of 2022.
5. What are some drivers contributing to market growth?
Increasing Demand for Aesthetic Procedures; Growing Research and Development Initiatives to Expand the Therapeutic Applications of Botulinum Toxin.
6. What are the notable trends driving market growth?
Glabellar Lines Segment is Expected to Hold Significant Share in the Market Over the Forecast Period.
7. Are there any restraints impacting market growth?
Adverse Effects Associated with Botulinum Toxin; Lack of Reimbursement Policies Supporting Cosmetic Procedures.
8. Can you provide examples of recent developments in the market?
March 2024: Hugel America Inc. announced that the United States Food and Drugs Administration (US FDA) had approved Letybo (Neurotoxin) for the management of moderate-to-severe glabellar (frown) lines in adults.
9. What pricing options are available for accessing the report?
Pricing options include single-user, multi-user, and enterprise licenses priced at USD 4750, USD 5250, and USD 8750 respectively.
10. Is the market size provided in terms of value or volume?
The market size is provided in terms of value, measured in Million and volume, measured in K Unit.
11. Are there any specific market keywords associated with the report?
Yes, the market keyword associated with the report is "Botox Industry," which aids in identifying and referencing the specific market segment covered.
12. How do I determine which pricing option suits my needs best?
The pricing options vary based on user requirements and access needs. Individual users may opt for single-user licenses, while businesses requiring broader access may choose multi-user or enterprise licenses for cost-effective access to the report.
13. Are there any additional resources or data provided in the Botox Industry report?
While the report offers comprehensive insights, it's advisable to review the specific contents or supplementary materials provided to ascertain if additional resources or data are available.
14. How can I stay updated on further developments or reports in the Botox Industry?
To stay informed about further developments, trends, and reports in the Botox Industry, consider subscribing to industry newsletters, following relevant companies and organizations, or regularly checking reputable industry news sources and publications.
Methodology
Step 1 - Identification of Relevant Samples Size from Population Database


Step 2 - Approaches for Defining Global Market Size (Value, Volume* & Price*)

Note*: In applicable scenarios
Step 3 - Data Sources
Primary Research
- Web Analytics
- Survey Reports
- Research Institute
- Latest Research Reports
- Opinion Leaders
Secondary Research
- Annual Reports
- White Paper
- Latest Press Release
- Industry Association
- Paid Database
- Investor Presentations

Step 4 - Data Triangulation
Involves using different sources of information in order to increase the validity of a study
These sources are likely to be stakeholders in a program - participants, other researchers, program staff, other community members, and so on.
Then we put all data in single framework & apply various statistical tools to find out the dynamic on the market.
During the analysis stage, feedback from the stakeholder groups would be compared to determine areas of agreement as well as areas of divergence