
Key Insights
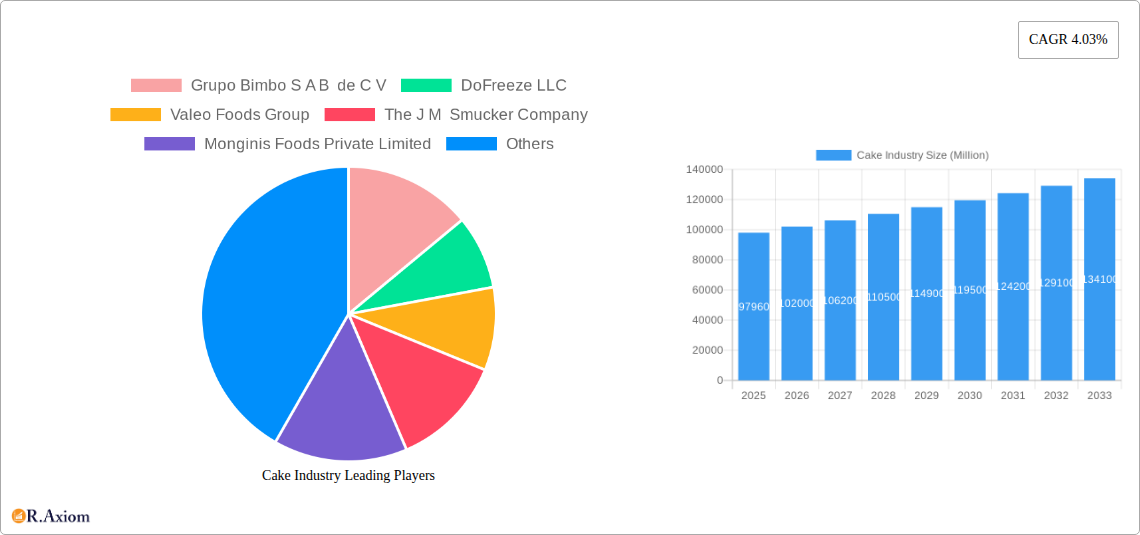
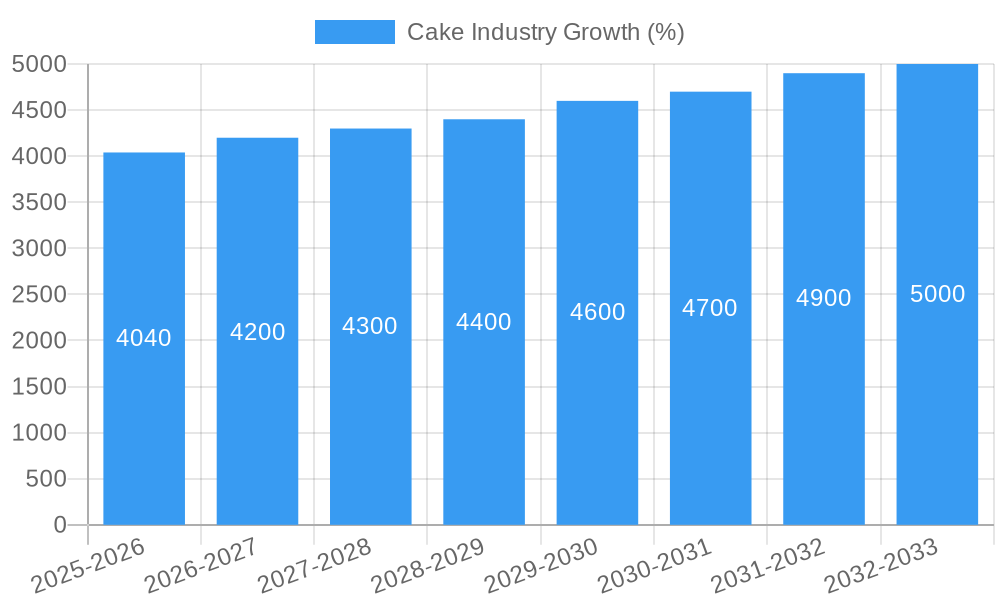
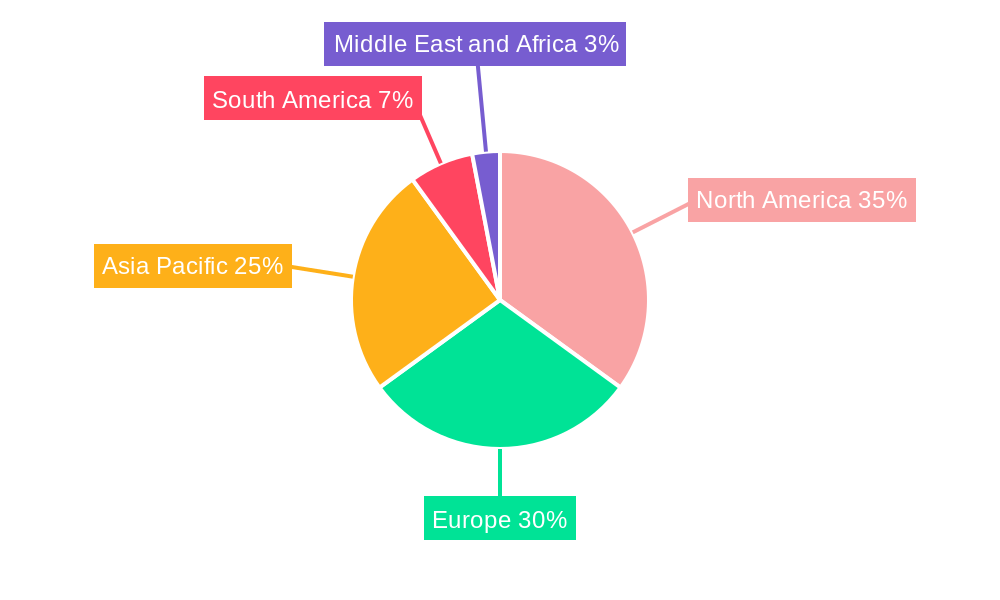
The global cake industry, currently valued at $97.96 billion (2025), is projected to experience steady growth, exhibiting a Compound Annual Growth Rate (CAGR) of 4.03% from 2025 to 2033. This growth is driven by several key factors. The increasing popularity of celebratory events and the rising demand for convenient, ready-to-eat desserts are significant contributors. Furthermore, the expanding online retail sector provides new avenues for cake distribution, reaching broader consumer bases. Innovation in product offerings, such as healthier cake options and unique flavors, is also fueling market expansion. The packaged cake segment holds a dominant market share, driven by convenience and longer shelf life. However, the unpackaged/artisanal segment is experiencing growth due to increasing consumer preference for premium quality and personalized experiences. Geographically, North America and Europe currently hold significant market share, but Asia Pacific is expected to witness substantial growth driven by rising disposable incomes and changing consumer preferences. Competition within the industry is intense, with major players like Grupo Bimbo, McKee Foods, and Britannia Industries vying for market dominance through product diversification, strategic acquisitions, and brand building.
The industry faces certain challenges, including fluctuating raw material prices and the need to adapt to evolving consumer demands. Maintaining consistent product quality and implementing sustainable practices are crucial for long-term success. The segmentation of the market by product type (celebration cakes, cupcakes, sponge cakes, etc.) and distribution channels (supermarkets, specialty stores, online platforms) offers strategic opportunities for companies to target specific consumer segments effectively. Future growth will depend on companies' ability to innovate, adapt to changing consumer tastes, and leverage digital channels for marketing and sales. The increasing focus on health and wellness is likely to influence product development, with a greater emphasis on healthier ingredients and reduced sugar content. This evolving landscape necessitates a dynamic approach from industry players to capitalize on emerging opportunities and maintain a competitive edge.
This comprehensive report provides a detailed analysis of the global cake industry, covering market size, segmentation, key players, trends, and future outlook. The study period spans from 2019 to 2033, with 2025 as the base and estimated year. The report offers actionable insights for industry stakeholders, including manufacturers, distributors, and investors. The global cake industry is valued at xx Million in 2025 and is projected to reach xx Million by 2033, exhibiting a CAGR of xx% during the forecast period (2025-2033).
Cake Industry Market Concentration & Innovation
The global cake industry is characterized by a moderately concentrated market structure, with a few large multinational companies holding significant market share. Grupo Bimbo S.A.B. de C.V., Flowers Foods Inc., and McKee Foods Corporation are some of the major players, collectively controlling an estimated xx% of the global market in 2025. However, the presence of numerous regional and local players, particularly in the artisanal segment, contributes to a fragmented landscape.
Innovation Drivers:
- Product Diversification: Continuous introduction of new flavors, varieties (e.g., gluten-free, vegan), and formats (e.g., single-serve, ready-to-eat) drives market growth.
- Technological Advancements: Automation in production, improved packaging technologies, and online ordering platforms are boosting efficiency and expanding market reach.
- Health and Wellness Trends: Growing demand for healthier cake options, such as reduced sugar or whole-wheat varieties, presents significant opportunities.
Regulatory Frameworks:
Regulations concerning food safety, labeling, and ingredient usage vary across regions, influencing production costs and market access.
Product Substitutes:
Cookies, pastries, and other desserts compete with cakes, while healthier alternatives like fruit and yogurt pose a growing challenge.
End-User Trends:
Changing consumer preferences, including demand for convenience, premiumization, and personalized experiences, are shaping industry dynamics.
M&A Activities:
The industry has witnessed a moderate level of mergers and acquisitions in recent years, with deal values ranging from xx Million to xx Million. These activities often aim to expand product portfolios, enhance distribution networks, and achieve economies of scale.
Cake Industry Industry Trends & Insights
The global cake market is experiencing robust growth, driven by several factors. Rising disposable incomes, particularly in developing economies, are fueling increased spending on premium and indulgent food products, including cakes. The growing popularity of celebrations and special occasions, coupled with the increasing preference for convenient and ready-to-eat desserts, is boosting demand. The market is also witnessing a shift towards healthier options, prompting manufacturers to innovate with ingredients and recipes.
Technological disruptions, such as automation in production and e-commerce platforms, are improving efficiency and market reach. The industry also observes a growing trend towards personalization and customization, with consumers seeking unique and tailored cake experiences. However, competitive dynamics remain intense, with companies vying for market share through product innovation, branding, and pricing strategies. The market penetration of packaged cakes is high, exceeding xx%, while the artisanal segment shows a slower but steady growth rate. The overall market is estimated to grow at a CAGR of xx% from 2025 to 2033.
Dominant Markets & Segments in Cake Industry
The North American region holds a dominant position in the global cake market, followed by Europe and Asia-Pacific. Within these regions, the United States and China are the leading national markets.
By Form:
- Packaged Cakes: This segment dominates the market due to its convenience, long shelf life, and widespread availability. Key growth drivers include expanding supermarket chains and increased consumer demand for packaged convenience food.
- Unpackaged/Artisanal Cakes: This segment exhibits niche growth, driven by the increasing demand for premium, personalized, and handcrafted cakes. Factors influencing growth include rising disposable incomes and a growing preference for high-quality, unique products.
By Product Type:
- Celebration Cakes: This remains a dominant segment, driven by birthdays, weddings, and other special occasions.
- Cupcakes: This segment shows strong growth, fueled by its portability and individual serving size.
- Plain Sponge Cakes: This segment serves as a base for many other cake types and shows consistent, albeit moderate, growth.
- Others (Other Cakes): This includes a variety of specialized cakes and pastries, offering growth opportunities based on specific trends and preferences.
By Distribution Channel:
- Supermarkets/Hypermarkets: This is the primary distribution channel, providing wide reach and convenience to consumers.
- Specialty Stores: These stores cater to high-end and specialized cake needs, contributing to market growth in the premium segment.
- Convenience Stores: This channel is expanding in urban areas, catering to customers seeking quick and readily available desserts.
- Online Retail Stores: This segment is growing rapidly, offering convenience and a wider product selection.
Cake Industry Product Developments
Recent product innovations focus on healthier options (reduced sugar, gluten-free), convenient formats (single-serve, ready-to-eat), and premium offerings (gourmet flavors, unique designs). Technological advancements like 3D printing for cake decoration are also gaining traction. The market fits these trends by providing consumers with diverse choices and personalized experiences that reflect evolving lifestyles and preferences.
Report Scope & Segmentation Analysis
This report segments the cake market by form (packaged, unpackaged/artisanal), product type (celebration cakes, cupcakes, sponge cakes, others), and distribution channel (supermarkets/hypermarkets, specialty stores, convenience stores, online retail stores, other channels). Each segment is analyzed for its market size, growth projections, and competitive dynamics. The packaged cakes segment is expected to show steady growth, driven by convenience and long shelf life. The artisanal segment is expected to experience niche growth, driven by increased consumer demand for premium and handcrafted products. Growth projections for each segment and channel are outlined in the detailed report.
Key Drivers of Cake Industry Growth
Several factors fuel the growth of the cake industry:
- Rising Disposable Incomes: Increased purchasing power, especially in emerging economies, boosts demand for premium and indulgent food products.
- Changing Consumer Preferences: Demand for convenience, premiumization, and personalized experiences drives innovation in product offerings.
- Technological Advancements: Automation in production, improved packaging, and online platforms enhance efficiency and market reach.
Challenges in the Cake Industry Sector
The cake industry faces various challenges:
- Fluctuating Raw Material Prices: Increases in the cost of ingredients (e.g., flour, sugar, eggs) can impact profitability.
- Intense Competition: The market is highly competitive, with players vying for market share through pricing and innovation.
- Maintaining Quality and Consistency: Meeting consumer expectations for quality and consistency is crucial, especially in a competitive landscape.
Emerging Opportunities in Cake Industry
Several opportunities exist within the cake industry:
- Expansion into Emerging Markets: Untapped potential exists in developing economies with growing middle classes.
- Healthier and Functional Cakes: Demand for low-sugar, gluten-free, and vegan options presents significant opportunities.
- Personalized and Customized Cakes: Tailoring cakes to individual preferences and special occasions can create unique experiences.
Leading Players in the Cake Industry Market
- Grupo Bimbo S.A.B. de C.V.
- DoFreeze LLC
- Valeo Foods Group
- The J.M. Smucker Company
- Monginis Foods Private Limited
- Flowers Foods Inc.
- Bonn Group of Industries
- Yıldız Holding
- McKee Foods Corporation
- Britannia Industries Limited
Key Developments in Cake Industry Industry
- March 2024: The Hostess brand launched Hostess Meltamors, a new mini-cake with a melting center, impacting the market with a novel product format.
- March 2024: McKee Foods introduced Valentine’s Day-themed Little Debbie products, capitalizing on seasonal demand and expanding its product portfolio.
- March 2024: Monginis Foods Private Limited modernized its packaging, enhancing brand appeal and potentially improving sales.
Strategic Outlook for Cake Industry Market
The cake industry is poised for continued growth, driven by several factors: innovation in product offerings, expansion into new markets, and the rising popularity of convenient and personalized food experiences. Companies focusing on health and wellness, sustainable practices, and technological advancements are expected to thrive in this dynamic and evolving market. The increasing focus on online ordering and delivery services presents additional opportunities for market expansion.
Cake Industry Segmentation
-
1. Form
- 1.1. Packaged
- 1.2. Unpackaged/Artisanal
-
2. Product Type
- 2.1. Celebration Cakes
-
2.2. Cupcakes
- 2.2.1. Center-filled
- 2.2.2. Plain
-
2.3. Sponge Cakes
- 2.3.1. Plain Cakes
- 2.3.2. Center-Filled Cakes
- 2.3.3. Others
- 2.4. Other Cakes
-
3. Distribution Channel
- 3.1. Supermarkets/Hypermarkets
- 3.2. Specialty Stores
- 3.3. Convenience Stores
- 3.4. Online Retail Stores
- 3.5. Other Distribution Channels
Cake Industry Segmentation By Geography
-
1. North America
- 1.1. United States
- 1.2. Canada
- 1.3. Mexico
- 1.4. Rest of North America
-
2. Europe
- 2.1. Germany
- 2.2. United Kingdom
- 2.3. France
- 2.4. Russia
- 2.5. Spain
- 2.6. Italy
- 2.7. Rest of Europe
-
3. Asia Pacific
- 3.1. China
- 3.2. Japan
- 3.3. India
- 3.4. Australia
- 3.5. Pakistan
- 3.6. Rest of Asia Pacific
-
4. South America
- 4.1. Brazil
- 4.2. Argentina
- 4.3. Rest of South America
-
5. Middle East and Africa
- 5.1. South Africa
- 5.2. Saudi Arabia
- 5.3. Rest of Middle East and Africa
Cake Industry REPORT HIGHLIGHTS
| Aspects | Details |
|---|---|
| Study Period | 2019-2033 |
| Base Year | 2024 |
| Estimated Year | 2025 |
| Forecast Period | 2025-2033 |
| Historical Period | 2019-2024 |
| Growth Rate | CAGR of 4.03% from 2019-2033 |
| Segmentation |
|
Table of Contents
- 1. Introduction
- 1.1. Research Scope
- 1.2. Market Segmentation
- 1.3. Research Methodology
- 1.4. Definitions and Assumptions
- 2. Executive Summary
- 2.1. Introduction
- 3. Market Dynamics
- 3.1. Introduction
- 3.2. Market Drivers
- 3.2.1. Increase in Number Of Social Event Celebration; Innovations In Designs And Flavors
- 3.3. Market Restrains
- 3.3.1. Health Concerns Related To Ingredients
- 3.4. Market Trends
- 3.4.1. Increase in Number Of Social Event Celebration
- 4. Market Factor Analysis
- 4.1. Porters Five Forces
- 4.2. Supply/Value Chain
- 4.3. PESTEL analysis
- 4.4. Market Entropy
- 4.5. Patent/Trademark Analysis
- 5. Global Cake Industry Analysis, Insights and Forecast, 2019-2031
- 5.1. Market Analysis, Insights and Forecast - by Form
- 5.1.1. Packaged
- 5.1.2. Unpackaged/Artisanal
- 5.2. Market Analysis, Insights and Forecast - by Product Type
- 5.2.1. Celebration Cakes
- 5.2.2. Cupcakes
- 5.2.2.1. Center-filled
- 5.2.2.2. Plain
- 5.2.3. Sponge Cakes
- 5.2.3.1. Plain Cakes
- 5.2.3.2. Center-Filled Cakes
- 5.2.3.3. Others
- 5.2.4. Other Cakes
- 5.3. Market Analysis, Insights and Forecast - by Distribution Channel
- 5.3.1. Supermarkets/Hypermarkets
- 5.3.2. Specialty Stores
- 5.3.3. Convenience Stores
- 5.3.4. Online Retail Stores
- 5.3.5. Other Distribution Channels
- 5.4. Market Analysis, Insights and Forecast - by Region
- 5.4.1. North America
- 5.4.2. Europe
- 5.4.3. Asia Pacific
- 5.4.4. South America
- 5.4.5. Middle East and Africa
- 5.1. Market Analysis, Insights and Forecast - by Form
- 6. North America Cake Industry Analysis, Insights and Forecast, 2019-2031
- 6.1. Market Analysis, Insights and Forecast - by Form
- 6.1.1. Packaged
- 6.1.2. Unpackaged/Artisanal
- 6.2. Market Analysis, Insights and Forecast - by Product Type
- 6.2.1. Celebration Cakes
- 6.2.2. Cupcakes
- 6.2.2.1. Center-filled
- 6.2.2.2. Plain
- 6.2.3. Sponge Cakes
- 6.2.3.1. Plain Cakes
- 6.2.3.2. Center-Filled Cakes
- 6.2.3.3. Others
- 6.2.4. Other Cakes
- 6.3. Market Analysis, Insights and Forecast - by Distribution Channel
- 6.3.1. Supermarkets/Hypermarkets
- 6.3.2. Specialty Stores
- 6.3.3. Convenience Stores
- 6.3.4. Online Retail Stores
- 6.3.5. Other Distribution Channels
- 6.1. Market Analysis, Insights and Forecast - by Form
- 7. Europe Cake Industry Analysis, Insights and Forecast, 2019-2031
- 7.1. Market Analysis, Insights and Forecast - by Form
- 7.1.1. Packaged
- 7.1.2. Unpackaged/Artisanal
- 7.2. Market Analysis, Insights and Forecast - by Product Type
- 7.2.1. Celebration Cakes
- 7.2.2. Cupcakes
- 7.2.2.1. Center-filled
- 7.2.2.2. Plain
- 7.2.3. Sponge Cakes
- 7.2.3.1. Plain Cakes
- 7.2.3.2. Center-Filled Cakes
- 7.2.3.3. Others
- 7.2.4. Other Cakes
- 7.3. Market Analysis, Insights and Forecast - by Distribution Channel
- 7.3.1. Supermarkets/Hypermarkets
- 7.3.2. Specialty Stores
- 7.3.3. Convenience Stores
- 7.3.4. Online Retail Stores
- 7.3.5. Other Distribution Channels
- 7.1. Market Analysis, Insights and Forecast - by Form
- 8. Asia Pacific Cake Industry Analysis, Insights and Forecast, 2019-2031
- 8.1. Market Analysis, Insights and Forecast - by Form
- 8.1.1. Packaged
- 8.1.2. Unpackaged/Artisanal
- 8.2. Market Analysis, Insights and Forecast - by Product Type
- 8.2.1. Celebration Cakes
- 8.2.2. Cupcakes
- 8.2.2.1. Center-filled
- 8.2.2.2. Plain
- 8.2.3. Sponge Cakes
- 8.2.3.1. Plain Cakes
- 8.2.3.2. Center-Filled Cakes
- 8.2.3.3. Others
- 8.2.4. Other Cakes
- 8.3. Market Analysis, Insights and Forecast - by Distribution Channel
- 8.3.1. Supermarkets/Hypermarkets
- 8.3.2. Specialty Stores
- 8.3.3. Convenience Stores
- 8.3.4. Online Retail Stores
- 8.3.5. Other Distribution Channels
- 8.1. Market Analysis, Insights and Forecast - by Form
- 9. South America Cake Industry Analysis, Insights and Forecast, 2019-2031
- 9.1. Market Analysis, Insights and Forecast - by Form
- 9.1.1. Packaged
- 9.1.2. Unpackaged/Artisanal
- 9.2. Market Analysis, Insights and Forecast - by Product Type
- 9.2.1. Celebration Cakes
- 9.2.2. Cupcakes
- 9.2.2.1. Center-filled
- 9.2.2.2. Plain
- 9.2.3. Sponge Cakes
- 9.2.3.1. Plain Cakes
- 9.2.3.2. Center-Filled Cakes
- 9.2.3.3. Others
- 9.2.4. Other Cakes
- 9.3. Market Analysis, Insights and Forecast - by Distribution Channel
- 9.3.1. Supermarkets/Hypermarkets
- 9.3.2. Specialty Stores
- 9.3.3. Convenience Stores
- 9.3.4. Online Retail Stores
- 9.3.5. Other Distribution Channels
- 9.1. Market Analysis, Insights and Forecast - by Form
- 10. Middle East and Africa Cake Industry Analysis, Insights and Forecast, 2019-2031
- 10.1. Market Analysis, Insights and Forecast - by Form
- 10.1.1. Packaged
- 10.1.2. Unpackaged/Artisanal
- 10.2. Market Analysis, Insights and Forecast - by Product Type
- 10.2.1. Celebration Cakes
- 10.2.2. Cupcakes
- 10.2.2.1. Center-filled
- 10.2.2.2. Plain
- 10.2.3. Sponge Cakes
- 10.2.3.1. Plain Cakes
- 10.2.3.2. Center-Filled Cakes
- 10.2.3.3. Others
- 10.2.4. Other Cakes
- 10.3. Market Analysis, Insights and Forecast - by Distribution Channel
- 10.3.1. Supermarkets/Hypermarkets
- 10.3.2. Specialty Stores
- 10.3.3. Convenience Stores
- 10.3.4. Online Retail Stores
- 10.3.5. Other Distribution Channels
- 10.1. Market Analysis, Insights and Forecast - by Form
- 11. North America Cake Industry Analysis, Insights and Forecast, 2019-2031
- 11.1. Market Analysis, Insights and Forecast - By Country/Sub-region
- 11.1.1 United States
- 11.1.2 Canada
- 11.1.3 Mexico
- 11.1.4 Rest of North America
- 12. Europe Cake Industry Analysis, Insights and Forecast, 2019-2031
- 12.1. Market Analysis, Insights and Forecast - By Country/Sub-region
- 12.1.1 Germany
- 12.1.2 United Kingdom
- 12.1.3 France
- 12.1.4 Russia
- 12.1.5 Spain
- 12.1.6 Italy
- 12.1.7 Rest of Europe
- 13. Asia Pacific Cake Industry Analysis, Insights and Forecast, 2019-2031
- 13.1. Market Analysis, Insights and Forecast - By Country/Sub-region
- 13.1.1 China
- 13.1.2 Japan
- 13.1.3 India
- 13.1.4 Australia
- 13.1.5 Pakistan
- 13.1.6 Rest of Asia Pacific
- 14. South America Cake Industry Analysis, Insights and Forecast, 2019-2031
- 14.1. Market Analysis, Insights and Forecast - By Country/Sub-region
- 14.1.1 Brazil
- 14.1.2 Argentina
- 14.1.3 Rest of South America
- 15. Middle East and Africa Cake Industry Analysis, Insights and Forecast, 2019-2031
- 15.1. Market Analysis, Insights and Forecast - By Country/Sub-region
- 15.1.1 South Africa
- 15.1.2 Saudi Arabia
- 15.1.3 Rest of Middle East and Africa
- 16. Competitive Analysis
- 16.1. Global Market Share Analysis 2024
- 16.2. Company Profiles
- 16.2.1 Grupo Bimbo S A B de C V
- 16.2.1.1. Overview
- 16.2.1.2. Products
- 16.2.1.3. SWOT Analysis
- 16.2.1.4. Recent Developments
- 16.2.1.5. Financials (Based on Availability)
- 16.2.2 DoFreeze LLC
- 16.2.2.1. Overview
- 16.2.2.2. Products
- 16.2.2.3. SWOT Analysis
- 16.2.2.4. Recent Developments
- 16.2.2.5. Financials (Based on Availability)
- 16.2.3 Valeo Foods Group
- 16.2.3.1. Overview
- 16.2.3.2. Products
- 16.2.3.3. SWOT Analysis
- 16.2.3.4. Recent Developments
- 16.2.3.5. Financials (Based on Availability)
- 16.2.4 The J M Smucker Company
- 16.2.4.1. Overview
- 16.2.4.2. Products
- 16.2.4.3. SWOT Analysis
- 16.2.4.4. Recent Developments
- 16.2.4.5. Financials (Based on Availability)
- 16.2.5 Monginis Foods Private Limited
- 16.2.5.1. Overview
- 16.2.5.2. Products
- 16.2.5.3. SWOT Analysis
- 16.2.5.4. Recent Developments
- 16.2.5.5. Financials (Based on Availability)
- 16.2.6 Flowers Foods Inc
- 16.2.6.1. Overview
- 16.2.6.2. Products
- 16.2.6.3. SWOT Analysis
- 16.2.6.4. Recent Developments
- 16.2.6.5. Financials (Based on Availability)
- 16.2.7 Bonn Group of Industries
- 16.2.7.1. Overview
- 16.2.7.2. Products
- 16.2.7.3. SWOT Analysis
- 16.2.7.4. Recent Developments
- 16.2.7.5. Financials (Based on Availability)
- 16.2.8 Yıldız Holding *List Not Exhaustive
- 16.2.8.1. Overview
- 16.2.8.2. Products
- 16.2.8.3. SWOT Analysis
- 16.2.8.4. Recent Developments
- 16.2.8.5. Financials (Based on Availability)
- 16.2.9 McKee Foods Corporation
- 16.2.9.1. Overview
- 16.2.9.2. Products
- 16.2.9.3. SWOT Analysis
- 16.2.9.4. Recent Developments
- 16.2.9.5. Financials (Based on Availability)
- 16.2.10 Britannia Industries Limited
- 16.2.10.1. Overview
- 16.2.10.2. Products
- 16.2.10.3. SWOT Analysis
- 16.2.10.4. Recent Developments
- 16.2.10.5. Financials (Based on Availability)
- 16.2.1 Grupo Bimbo S A B de C V
List of Figures
- Figure 1: Global Cake Industry Revenue Breakdown (Million, %) by Region 2024 & 2032
- Figure 2: Global Cake Industry Volume Breakdown (k unit, %) by Region 2024 & 2032
- Figure 3: North America Cake Industry Revenue (Million), by Country 2024 & 2032
- Figure 4: North America Cake Industry Volume (k unit), by Country 2024 & 2032
- Figure 5: North America Cake Industry Revenue Share (%), by Country 2024 & 2032
- Figure 6: North America Cake Industry Volume Share (%), by Country 2024 & 2032
- Figure 7: Europe Cake Industry Revenue (Million), by Country 2024 & 2032
- Figure 8: Europe Cake Industry Volume (k unit), by Country 2024 & 2032
- Figure 9: Europe Cake Industry Revenue Share (%), by Country 2024 & 2032
- Figure 10: Europe Cake Industry Volume Share (%), by Country 2024 & 2032
- Figure 11: Asia Pacific Cake Industry Revenue (Million), by Country 2024 & 2032
- Figure 12: Asia Pacific Cake Industry Volume (k unit), by Country 2024 & 2032
- Figure 13: Asia Pacific Cake Industry Revenue Share (%), by Country 2024 & 2032
- Figure 14: Asia Pacific Cake Industry Volume Share (%), by Country 2024 & 2032
- Figure 15: South America Cake Industry Revenue (Million), by Country 2024 & 2032
- Figure 16: South America Cake Industry Volume (k unit), by Country 2024 & 2032
- Figure 17: South America Cake Industry Revenue Share (%), by Country 2024 & 2032
- Figure 18: South America Cake Industry Volume Share (%), by Country 2024 & 2032
- Figure 19: Middle East and Africa Cake Industry Revenue (Million), by Country 2024 & 2032
- Figure 20: Middle East and Africa Cake Industry Volume (k unit), by Country 2024 & 2032
- Figure 21: Middle East and Africa Cake Industry Revenue Share (%), by Country 2024 & 2032
- Figure 22: Middle East and Africa Cake Industry Volume Share (%), by Country 2024 & 2032
- Figure 23: North America Cake Industry Revenue (Million), by Form 2024 & 2032
- Figure 24: North America Cake Industry Volume (k unit), by Form 2024 & 2032
- Figure 25: North America Cake Industry Revenue Share (%), by Form 2024 & 2032
- Figure 26: North America Cake Industry Volume Share (%), by Form 2024 & 2032
- Figure 27: North America Cake Industry Revenue (Million), by Product Type 2024 & 2032
- Figure 28: North America Cake Industry Volume (k unit), by Product Type 2024 & 2032
- Figure 29: North America Cake Industry Revenue Share (%), by Product Type 2024 & 2032
- Figure 30: North America Cake Industry Volume Share (%), by Product Type 2024 & 2032
- Figure 31: North America Cake Industry Revenue (Million), by Distribution Channel 2024 & 2032
- Figure 32: North America Cake Industry Volume (k unit), by Distribution Channel 2024 & 2032
- Figure 33: North America Cake Industry Revenue Share (%), by Distribution Channel 2024 & 2032
- Figure 34: North America Cake Industry Volume Share (%), by Distribution Channel 2024 & 2032
- Figure 35: North America Cake Industry Revenue (Million), by Country 2024 & 2032
- Figure 36: North America Cake Industry Volume (k unit), by Country 2024 & 2032
- Figure 37: North America Cake Industry Revenue Share (%), by Country 2024 & 2032
- Figure 38: North America Cake Industry Volume Share (%), by Country 2024 & 2032
- Figure 39: Europe Cake Industry Revenue (Million), by Form 2024 & 2032
- Figure 40: Europe Cake Industry Volume (k unit), by Form 2024 & 2032
- Figure 41: Europe Cake Industry Revenue Share (%), by Form 2024 & 2032
- Figure 42: Europe Cake Industry Volume Share (%), by Form 2024 & 2032
- Figure 43: Europe Cake Industry Revenue (Million), by Product Type 2024 & 2032
- Figure 44: Europe Cake Industry Volume (k unit), by Product Type 2024 & 2032
- Figure 45: Europe Cake Industry Revenue Share (%), by Product Type 2024 & 2032
- Figure 46: Europe Cake Industry Volume Share (%), by Product Type 2024 & 2032
- Figure 47: Europe Cake Industry Revenue (Million), by Distribution Channel 2024 & 2032
- Figure 48: Europe Cake Industry Volume (k unit), by Distribution Channel 2024 & 2032
- Figure 49: Europe Cake Industry Revenue Share (%), by Distribution Channel 2024 & 2032
- Figure 50: Europe Cake Industry Volume Share (%), by Distribution Channel 2024 & 2032
- Figure 51: Europe Cake Industry Revenue (Million), by Country 2024 & 2032
- Figure 52: Europe Cake Industry Volume (k unit), by Country 2024 & 2032
- Figure 53: Europe Cake Industry Revenue Share (%), by Country 2024 & 2032
- Figure 54: Europe Cake Industry Volume Share (%), by Country 2024 & 2032
- Figure 55: Asia Pacific Cake Industry Revenue (Million), by Form 2024 & 2032
- Figure 56: Asia Pacific Cake Industry Volume (k unit), by Form 2024 & 2032
- Figure 57: Asia Pacific Cake Industry Revenue Share (%), by Form 2024 & 2032
- Figure 58: Asia Pacific Cake Industry Volume Share (%), by Form 2024 & 2032
- Figure 59: Asia Pacific Cake Industry Revenue (Million), by Product Type 2024 & 2032
- Figure 60: Asia Pacific Cake Industry Volume (k unit), by Product Type 2024 & 2032
- Figure 61: Asia Pacific Cake Industry Revenue Share (%), by Product Type 2024 & 2032
- Figure 62: Asia Pacific Cake Industry Volume Share (%), by Product Type 2024 & 2032
- Figure 63: Asia Pacific Cake Industry Revenue (Million), by Distribution Channel 2024 & 2032
- Figure 64: Asia Pacific Cake Industry Volume (k unit), by Distribution Channel 2024 & 2032
- Figure 65: Asia Pacific Cake Industry Revenue Share (%), by Distribution Channel 2024 & 2032
- Figure 66: Asia Pacific Cake Industry Volume Share (%), by Distribution Channel 2024 & 2032
- Figure 67: Asia Pacific Cake Industry Revenue (Million), by Country 2024 & 2032
- Figure 68: Asia Pacific Cake Industry Volume (k unit), by Country 2024 & 2032
- Figure 69: Asia Pacific Cake Industry Revenue Share (%), by Country 2024 & 2032
- Figure 70: Asia Pacific Cake Industry Volume Share (%), by Country 2024 & 2032
- Figure 71: South America Cake Industry Revenue (Million), by Form 2024 & 2032
- Figure 72: South America Cake Industry Volume (k unit), by Form 2024 & 2032
- Figure 73: South America Cake Industry Revenue Share (%), by Form 2024 & 2032
- Figure 74: South America Cake Industry Volume Share (%), by Form 2024 & 2032
- Figure 75: South America Cake Industry Revenue (Million), by Product Type 2024 & 2032
- Figure 76: South America Cake Industry Volume (k unit), by Product Type 2024 & 2032
- Figure 77: South America Cake Industry Revenue Share (%), by Product Type 2024 & 2032
- Figure 78: South America Cake Industry Volume Share (%), by Product Type 2024 & 2032
- Figure 79: South America Cake Industry Revenue (Million), by Distribution Channel 2024 & 2032
- Figure 80: South America Cake Industry Volume (k unit), by Distribution Channel 2024 & 2032
- Figure 81: South America Cake Industry Revenue Share (%), by Distribution Channel 2024 & 2032
- Figure 82: South America Cake Industry Volume Share (%), by Distribution Channel 2024 & 2032
- Figure 83: South America Cake Industry Revenue (Million), by Country 2024 & 2032
- Figure 84: South America Cake Industry Volume (k unit), by Country 2024 & 2032
- Figure 85: South America Cake Industry Revenue Share (%), by Country 2024 & 2032
- Figure 86: South America Cake Industry Volume Share (%), by Country 2024 & 2032
- Figure 87: Middle East and Africa Cake Industry Revenue (Million), by Form 2024 & 2032
- Figure 88: Middle East and Africa Cake Industry Volume (k unit), by Form 2024 & 2032
- Figure 89: Middle East and Africa Cake Industry Revenue Share (%), by Form 2024 & 2032
- Figure 90: Middle East and Africa Cake Industry Volume Share (%), by Form 2024 & 2032
- Figure 91: Middle East and Africa Cake Industry Revenue (Million), by Product Type 2024 & 2032
- Figure 92: Middle East and Africa Cake Industry Volume (k unit), by Product Type 2024 & 2032
- Figure 93: Middle East and Africa Cake Industry Revenue Share (%), by Product Type 2024 & 2032
- Figure 94: Middle East and Africa Cake Industry Volume Share (%), by Product Type 2024 & 2032
- Figure 95: Middle East and Africa Cake Industry Revenue (Million), by Distribution Channel 2024 & 2032
- Figure 96: Middle East and Africa Cake Industry Volume (k unit), by Distribution Channel 2024 & 2032
- Figure 97: Middle East and Africa Cake Industry Revenue Share (%), by Distribution Channel 2024 & 2032
- Figure 98: Middle East and Africa Cake Industry Volume Share (%), by Distribution Channel 2024 & 2032
- Figure 99: Middle East and Africa Cake Industry Revenue (Million), by Country 2024 & 2032
- Figure 100: Middle East and Africa Cake Industry Volume (k unit), by Country 2024 & 2032
- Figure 101: Middle East and Africa Cake Industry Revenue Share (%), by Country 2024 & 2032
- Figure 102: Middle East and Africa Cake Industry Volume Share (%), by Country 2024 & 2032
List of Tables
- Table 1: Global Cake Industry Revenue Million Forecast, by Region 2019 & 2032
- Table 2: Global Cake Industry Volume k unit Forecast, by Region 2019 & 2032
- Table 3: Global Cake Industry Revenue Million Forecast, by Form 2019 & 2032
- Table 4: Global Cake Industry Volume k unit Forecast, by Form 2019 & 2032
- Table 5: Global Cake Industry Revenue Million Forecast, by Product Type 2019 & 2032
- Table 6: Global Cake Industry Volume k unit Forecast, by Product Type 2019 & 2032
- Table 7: Global Cake Industry Revenue Million Forecast, by Distribution Channel 2019 & 2032
- Table 8: Global Cake Industry Volume k unit Forecast, by Distribution Channel 2019 & 2032
- Table 9: Global Cake Industry Revenue Million Forecast, by Region 2019 & 2032
- Table 10: Global Cake Industry Volume k unit Forecast, by Region 2019 & 2032
- Table 11: Global Cake Industry Revenue Million Forecast, by Country 2019 & 2032
- Table 12: Global Cake Industry Volume k unit Forecast, by Country 2019 & 2032
- Table 13: United States Cake Industry Revenue (Million) Forecast, by Application 2019 & 2032
- Table 14: United States Cake Industry Volume (k unit) Forecast, by Application 2019 & 2032
- Table 15: Canada Cake Industry Revenue (Million) Forecast, by Application 2019 & 2032
- Table 16: Canada Cake Industry Volume (k unit) Forecast, by Application 2019 & 2032
- Table 17: Mexico Cake Industry Revenue (Million) Forecast, by Application 2019 & 2032
- Table 18: Mexico Cake Industry Volume (k unit) Forecast, by Application 2019 & 2032
- Table 19: Rest of North America Cake Industry Revenue (Million) Forecast, by Application 2019 & 2032
- Table 20: Rest of North America Cake Industry Volume (k unit) Forecast, by Application 2019 & 2032
- Table 21: Global Cake Industry Revenue Million Forecast, by Country 2019 & 2032
- Table 22: Global Cake Industry Volume k unit Forecast, by Country 2019 & 2032
- Table 23: Germany Cake Industry Revenue (Million) Forecast, by Application 2019 & 2032
- Table 24: Germany Cake Industry Volume (k unit) Forecast, by Application 2019 & 2032
- Table 25: United Kingdom Cake Industry Revenue (Million) Forecast, by Application 2019 & 2032
- Table 26: United Kingdom Cake Industry Volume (k unit) Forecast, by Application 2019 & 2032
- Table 27: France Cake Industry Revenue (Million) Forecast, by Application 2019 & 2032
- Table 28: France Cake Industry Volume (k unit) Forecast, by Application 2019 & 2032
- Table 29: Russia Cake Industry Revenue (Million) Forecast, by Application 2019 & 2032
- Table 30: Russia Cake Industry Volume (k unit) Forecast, by Application 2019 & 2032
- Table 31: Spain Cake Industry Revenue (Million) Forecast, by Application 2019 & 2032
- Table 32: Spain Cake Industry Volume (k unit) Forecast, by Application 2019 & 2032
- Table 33: Italy Cake Industry Revenue (Million) Forecast, by Application 2019 & 2032
- Table 34: Italy Cake Industry Volume (k unit) Forecast, by Application 2019 & 2032
- Table 35: Rest of Europe Cake Industry Revenue (Million) Forecast, by Application 2019 & 2032
- Table 36: Rest of Europe Cake Industry Volume (k unit) Forecast, by Application 2019 & 2032
- Table 37: Global Cake Industry Revenue Million Forecast, by Country 2019 & 2032
- Table 38: Global Cake Industry Volume k unit Forecast, by Country 2019 & 2032
- Table 39: China Cake Industry Revenue (Million) Forecast, by Application 2019 & 2032
- Table 40: China Cake Industry Volume (k unit) Forecast, by Application 2019 & 2032
- Table 41: Japan Cake Industry Revenue (Million) Forecast, by Application 2019 & 2032
- Table 42: Japan Cake Industry Volume (k unit) Forecast, by Application 2019 & 2032
- Table 43: India Cake Industry Revenue (Million) Forecast, by Application 2019 & 2032
- Table 44: India Cake Industry Volume (k unit) Forecast, by Application 2019 & 2032
- Table 45: Australia Cake Industry Revenue (Million) Forecast, by Application 2019 & 2032
- Table 46: Australia Cake Industry Volume (k unit) Forecast, by Application 2019 & 2032
- Table 47: Pakistan Cake Industry Revenue (Million) Forecast, by Application 2019 & 2032
- Table 48: Pakistan Cake Industry Volume (k unit) Forecast, by Application 2019 & 2032
- Table 49: Rest of Asia Pacific Cake Industry Revenue (Million) Forecast, by Application 2019 & 2032
- Table 50: Rest of Asia Pacific Cake Industry Volume (k unit) Forecast, by Application 2019 & 2032
- Table 51: Global Cake Industry Revenue Million Forecast, by Country 2019 & 2032
- Table 52: Global Cake Industry Volume k unit Forecast, by Country 2019 & 2032
- Table 53: Brazil Cake Industry Revenue (Million) Forecast, by Application 2019 & 2032
- Table 54: Brazil Cake Industry Volume (k unit) Forecast, by Application 2019 & 2032
- Table 55: Argentina Cake Industry Revenue (Million) Forecast, by Application 2019 & 2032
- Table 56: Argentina Cake Industry Volume (k unit) Forecast, by Application 2019 & 2032
- Table 57: Rest of South America Cake Industry Revenue (Million) Forecast, by Application 2019 & 2032
- Table 58: Rest of South America Cake Industry Volume (k unit) Forecast, by Application 2019 & 2032
- Table 59: Global Cake Industry Revenue Million Forecast, by Country 2019 & 2032
- Table 60: Global Cake Industry Volume k unit Forecast, by Country 2019 & 2032
- Table 61: South Africa Cake Industry Revenue (Million) Forecast, by Application 2019 & 2032
- Table 62: South Africa Cake Industry Volume (k unit) Forecast, by Application 2019 & 2032
- Table 63: Saudi Arabia Cake Industry Revenue (Million) Forecast, by Application 2019 & 2032
- Table 64: Saudi Arabia Cake Industry Volume (k unit) Forecast, by Application 2019 & 2032
- Table 65: Rest of Middle East and Africa Cake Industry Revenue (Million) Forecast, by Application 2019 & 2032
- Table 66: Rest of Middle East and Africa Cake Industry Volume (k unit) Forecast, by Application 2019 & 2032
- Table 67: Global Cake Industry Revenue Million Forecast, by Form 2019 & 2032
- Table 68: Global Cake Industry Volume k unit Forecast, by Form 2019 & 2032
- Table 69: Global Cake Industry Revenue Million Forecast, by Product Type 2019 & 2032
- Table 70: Global Cake Industry Volume k unit Forecast, by Product Type 2019 & 2032
- Table 71: Global Cake Industry Revenue Million Forecast, by Distribution Channel 2019 & 2032
- Table 72: Global Cake Industry Volume k unit Forecast, by Distribution Channel 2019 & 2032
- Table 73: Global Cake Industry Revenue Million Forecast, by Country 2019 & 2032
- Table 74: Global Cake Industry Volume k unit Forecast, by Country 2019 & 2032
- Table 75: United States Cake Industry Revenue (Million) Forecast, by Application 2019 & 2032
- Table 76: United States Cake Industry Volume (k unit) Forecast, by Application 2019 & 2032
- Table 77: Canada Cake Industry Revenue (Million) Forecast, by Application 2019 & 2032
- Table 78: Canada Cake Industry Volume (k unit) Forecast, by Application 2019 & 2032
- Table 79: Mexico Cake Industry Revenue (Million) Forecast, by Application 2019 & 2032
- Table 80: Mexico Cake Industry Volume (k unit) Forecast, by Application 2019 & 2032
- Table 81: Rest of North America Cake Industry Revenue (Million) Forecast, by Application 2019 & 2032
- Table 82: Rest of North America Cake Industry Volume (k unit) Forecast, by Application 2019 & 2032
- Table 83: Global Cake Industry Revenue Million Forecast, by Form 2019 & 2032
- Table 84: Global Cake Industry Volume k unit Forecast, by Form 2019 & 2032
- Table 85: Global Cake Industry Revenue Million Forecast, by Product Type 2019 & 2032
- Table 86: Global Cake Industry Volume k unit Forecast, by Product Type 2019 & 2032
- Table 87: Global Cake Industry Revenue Million Forecast, by Distribution Channel 2019 & 2032
- Table 88: Global Cake Industry Volume k unit Forecast, by Distribution Channel 2019 & 2032
- Table 89: Global Cake Industry Revenue Million Forecast, by Country 2019 & 2032
- Table 90: Global Cake Industry Volume k unit Forecast, by Country 2019 & 2032
- Table 91: Germany Cake Industry Revenue (Million) Forecast, by Application 2019 & 2032
- Table 92: Germany Cake Industry Volume (k unit) Forecast, by Application 2019 & 2032
- Table 93: United Kingdom Cake Industry Revenue (Million) Forecast, by Application 2019 & 2032
- Table 94: United Kingdom Cake Industry Volume (k unit) Forecast, by Application 2019 & 2032
- Table 95: France Cake Industry Revenue (Million) Forecast, by Application 2019 & 2032
- Table 96: France Cake Industry Volume (k unit) Forecast, by Application 2019 & 2032
- Table 97: Russia Cake Industry Revenue (Million) Forecast, by Application 2019 & 2032
- Table 98: Russia Cake Industry Volume (k unit) Forecast, by Application 2019 & 2032
- Table 99: Spain Cake Industry Revenue (Million) Forecast, by Application 2019 & 2032
- Table 100: Spain Cake Industry Volume (k unit) Forecast, by Application 2019 & 2032
- Table 101: Italy Cake Industry Revenue (Million) Forecast, by Application 2019 & 2032
- Table 102: Italy Cake Industry Volume (k unit) Forecast, by Application 2019 & 2032
- Table 103: Rest of Europe Cake Industry Revenue (Million) Forecast, by Application 2019 & 2032
- Table 104: Rest of Europe Cake Industry Volume (k unit) Forecast, by Application 2019 & 2032
- Table 105: Global Cake Industry Revenue Million Forecast, by Form 2019 & 2032
- Table 106: Global Cake Industry Volume k unit Forecast, by Form 2019 & 2032
- Table 107: Global Cake Industry Revenue Million Forecast, by Product Type 2019 & 2032
- Table 108: Global Cake Industry Volume k unit Forecast, by Product Type 2019 & 2032
- Table 109: Global Cake Industry Revenue Million Forecast, by Distribution Channel 2019 & 2032
- Table 110: Global Cake Industry Volume k unit Forecast, by Distribution Channel 2019 & 2032
- Table 111: Global Cake Industry Revenue Million Forecast, by Country 2019 & 2032
- Table 112: Global Cake Industry Volume k unit Forecast, by Country 2019 & 2032
- Table 113: China Cake Industry Revenue (Million) Forecast, by Application 2019 & 2032
- Table 114: China Cake Industry Volume (k unit) Forecast, by Application 2019 & 2032
- Table 115: Japan Cake Industry Revenue (Million) Forecast, by Application 2019 & 2032
- Table 116: Japan Cake Industry Volume (k unit) Forecast, by Application 2019 & 2032
- Table 117: India Cake Industry Revenue (Million) Forecast, by Application 2019 & 2032
- Table 118: India Cake Industry Volume (k unit) Forecast, by Application 2019 & 2032
- Table 119: Australia Cake Industry Revenue (Million) Forecast, by Application 2019 & 2032
- Table 120: Australia Cake Industry Volume (k unit) Forecast, by Application 2019 & 2032
- Table 121: Pakistan Cake Industry Revenue (Million) Forecast, by Application 2019 & 2032
- Table 122: Pakistan Cake Industry Volume (k unit) Forecast, by Application 2019 & 2032
- Table 123: Rest of Asia Pacific Cake Industry Revenue (Million) Forecast, by Application 2019 & 2032
- Table 124: Rest of Asia Pacific Cake Industry Volume (k unit) Forecast, by Application 2019 & 2032
- Table 125: Global Cake Industry Revenue Million Forecast, by Form 2019 & 2032
- Table 126: Global Cake Industry Volume k unit Forecast, by Form 2019 & 2032
- Table 127: Global Cake Industry Revenue Million Forecast, by Product Type 2019 & 2032
- Table 128: Global Cake Industry Volume k unit Forecast, by Product Type 2019 & 2032
- Table 129: Global Cake Industry Revenue Million Forecast, by Distribution Channel 2019 & 2032
- Table 130: Global Cake Industry Volume k unit Forecast, by Distribution Channel 2019 & 2032
- Table 131: Global Cake Industry Revenue Million Forecast, by Country 2019 & 2032
- Table 132: Global Cake Industry Volume k unit Forecast, by Country 2019 & 2032
- Table 133: Brazil Cake Industry Revenue (Million) Forecast, by Application 2019 & 2032
- Table 134: Brazil Cake Industry Volume (k unit) Forecast, by Application 2019 & 2032
- Table 135: Argentina Cake Industry Revenue (Million) Forecast, by Application 2019 & 2032
- Table 136: Argentina Cake Industry Volume (k unit) Forecast, by Application 2019 & 2032
- Table 137: Rest of South America Cake Industry Revenue (Million) Forecast, by Application 2019 & 2032
- Table 138: Rest of South America Cake Industry Volume (k unit) Forecast, by Application 2019 & 2032
- Table 139: Global Cake Industry Revenue Million Forecast, by Form 2019 & 2032
- Table 140: Global Cake Industry Volume k unit Forecast, by Form 2019 & 2032
- Table 141: Global Cake Industry Revenue Million Forecast, by Product Type 2019 & 2032
- Table 142: Global Cake Industry Volume k unit Forecast, by Product Type 2019 & 2032
- Table 143: Global Cake Industry Revenue Million Forecast, by Distribution Channel 2019 & 2032
- Table 144: Global Cake Industry Volume k unit Forecast, by Distribution Channel 2019 & 2032
- Table 145: Global Cake Industry Revenue Million Forecast, by Country 2019 & 2032
- Table 146: Global Cake Industry Volume k unit Forecast, by Country 2019 & 2032
- Table 147: South Africa Cake Industry Revenue (Million) Forecast, by Application 2019 & 2032
- Table 148: South Africa Cake Industry Volume (k unit) Forecast, by Application 2019 & 2032
- Table 149: Saudi Arabia Cake Industry Revenue (Million) Forecast, by Application 2019 & 2032
- Table 150: Saudi Arabia Cake Industry Volume (k unit) Forecast, by Application 2019 & 2032
- Table 151: Rest of Middle East and Africa Cake Industry Revenue (Million) Forecast, by Application 2019 & 2032
- Table 152: Rest of Middle East and Africa Cake Industry Volume (k unit) Forecast, by Application 2019 & 2032
Frequently Asked Questions
1. What is the projected Compound Annual Growth Rate (CAGR) of the Cake Industry?
The projected CAGR is approximately 4.03%.
2. Which companies are prominent players in the Cake Industry?
Key companies in the market include Grupo Bimbo S A B de C V, DoFreeze LLC, Valeo Foods Group, The J M Smucker Company, Monginis Foods Private Limited, Flowers Foods Inc, Bonn Group of Industries, Yıldız Holding *List Not Exhaustive, McKee Foods Corporation, Britannia Industries Limited.
3. What are the main segments of the Cake Industry?
The market segments include Form, Product Type, Distribution Channel.
4. Can you provide details about the market size?
The market size is estimated to be USD 97.96 Million as of 2022.
5. What are some drivers contributing to market growth?
Increase in Number Of Social Event Celebration; Innovations In Designs And Flavors.
6. What are the notable trends driving market growth?
Increase in Number Of Social Event Celebration.
7. Are there any restraints impacting market growth?
Health Concerns Related To Ingredients.
8. Can you provide examples of recent developments in the market?
March 2024: The Hostess brand expanded its product portfolio by launching Hostess Meltamors, a soft, fluffy mini-cake with a delightful chocolate-flavored drizzle and a chocolatey- or caramel-flavored melting center that flows like "lava" when warmed in the microwave.
9. What pricing options are available for accessing the report?
Pricing options include single-user, multi-user, and enterprise licenses priced at USD 4750, USD 5250, and USD 8750 respectively.
10. Is the market size provided in terms of value or volume?
The market size is provided in terms of value, measured in Million and volume, measured in k unit.
11. Are there any specific market keywords associated with the report?
Yes, the market keyword associated with the report is "Cake Industry," which aids in identifying and referencing the specific market segment covered.
12. How do I determine which pricing option suits my needs best?
The pricing options vary based on user requirements and access needs. Individual users may opt for single-user licenses, while businesses requiring broader access may choose multi-user or enterprise licenses for cost-effective access to the report.
13. Are there any additional resources or data provided in the Cake Industry report?
While the report offers comprehensive insights, it's advisable to review the specific contents or supplementary materials provided to ascertain if additional resources or data are available.
14. How can I stay updated on further developments or reports in the Cake Industry?
To stay informed about further developments, trends, and reports in the Cake Industry, consider subscribing to industry newsletters, following relevant companies and organizations, or regularly checking reputable industry news sources and publications.
Methodology
Step 1 - Identification of Relevant Samples Size from Population Database


Step 2 - Approaches for Defining Global Market Size (Value, Volume* & Price*)

Note*: In applicable scenarios
Step 3 - Data Sources
Primary Research
- Web Analytics
- Survey Reports
- Research Institute
- Latest Research Reports
- Opinion Leaders
Secondary Research
- Annual Reports
- White Paper
- Latest Press Release
- Industry Association
- Paid Database
- Investor Presentations

Step 4 - Data Triangulation
Involves using different sources of information in order to increase the validity of a study
These sources are likely to be stakeholders in a program - participants, other researchers, program staff, other community members, and so on.
Then we put all data in single framework & apply various statistical tools to find out the dynamic on the market.
During the analysis stage, feedback from the stakeholder groups would be compared to determine areas of agreement as well as areas of divergence


