Key Insights
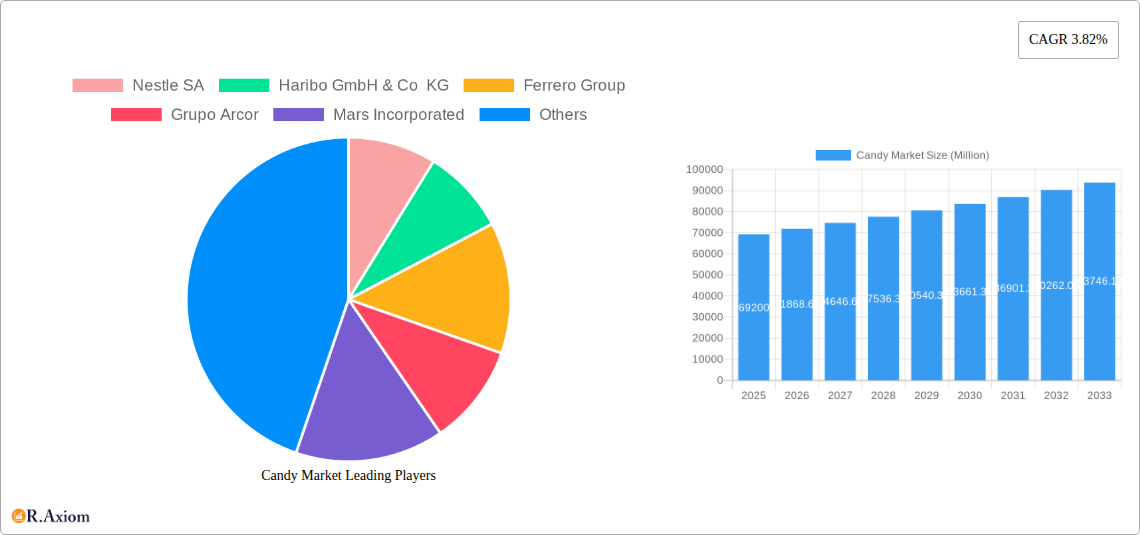
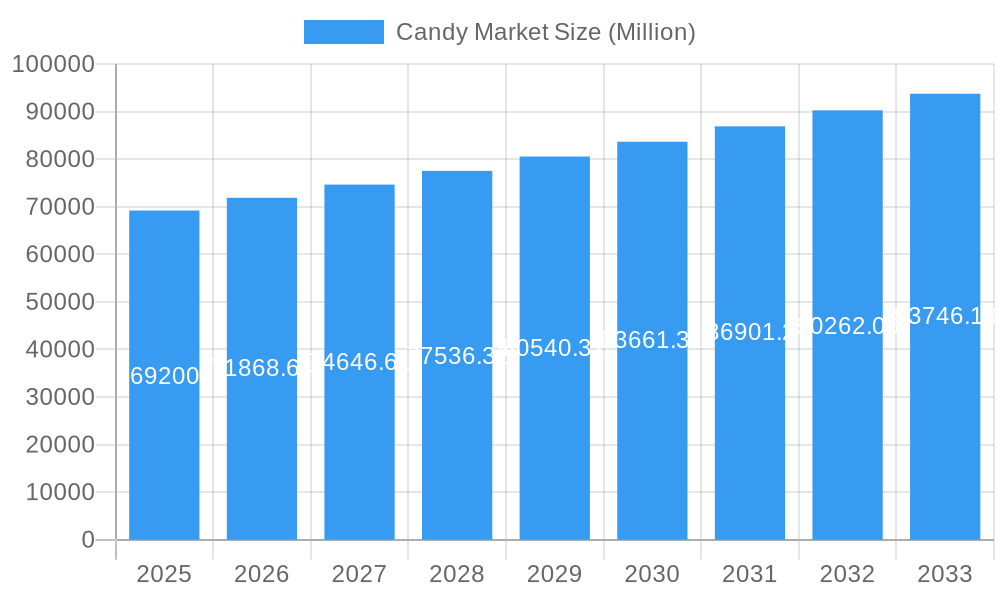
The global candy market, valued at $69.20 billion in 2025, is projected to experience steady growth, driven by several key factors. The rising disposable incomes in developing economies, coupled with increasing urbanization and changing lifestyles, are fueling demand for convenient and indulgent treats like candy. Innovation in product offerings, including healthier options with reduced sugar content and novel flavors, is also contributing to market expansion. The popularity of online retail channels provides further impetus, offering consumers broader choices and easier access. The market is segmented by type (chocolate and non-chocolate) and distribution channel (supermarkets, convenience stores, specialty retailers, and online). Chocolate candy currently holds a significant market share, though the non-chocolate segment is experiencing faster growth, driven by health-conscious consumers seeking alternatives. Geographically, North America and Europe represent mature markets, while Asia-Pacific exhibits substantial growth potential due to its expanding middle class and increasing consumption of confectionery products. Competitive pressures among major players like Nestlé, Ferrero, Mars, and Mondelez are intense, resulting in continuous product development and marketing initiatives to capture market share. However, growing health concerns regarding sugar consumption and the increasing prevalence of lifestyle diseases pose a challenge, requiring manufacturers to adapt their product offerings and marketing strategies.
Candy Market Market Size (In Billion)
The projected Compound Annual Growth Rate (CAGR) of 3.82% from 2025 to 2033 indicates a continued, albeit moderate, expansion of the candy market. This growth is expected to be uneven across regions, with emerging markets showing more significant increases compared to established markets. Regulatory changes related to sugar content and labeling may influence market dynamics, potentially leading to shifts in product formulations and consumer preferences. Furthermore, sustainability concerns are gaining traction, prompting manufacturers to focus on environmentally friendly packaging and sourcing practices. The market's long-term success will hinge on the industry's ability to navigate these evolving consumer preferences, health concerns, and regulatory landscape while maintaining profitability and innovation.
Candy Market Company Market Share
Candy Market: A Comprehensive Analysis (2019-2033)
This detailed report provides a comprehensive analysis of the global candy market, encompassing market size, segmentation, growth drivers, challenges, and future outlook. The study period covers 2019-2033, with 2025 as the base and estimated year. The report leverages extensive primary and secondary research to provide actionable insights for industry stakeholders, including manufacturers, distributors, retailers, and investors. The market is valued at xx Million in 2025 and is projected to reach xx Million by 2033, exhibiting a CAGR of xx%.
Candy Market Concentration & Innovation
The global candy market exhibits a moderately concentrated structure, with several multinational corporations holding significant market share. Nestle SA, Haribo GmbH & Co KG, Ferrero Group, Mars Incorporated, and Mondelez International Inc. are among the key players, collectively accounting for an estimated xx% of the market in 2025. However, the market also includes numerous smaller regional and niche players, fostering competition.
Market Concentration Metrics (2025):
- Nestle SA: xx% Market Share
- Haribo GmbH & Co KG: xx% Market Share
- Ferrero Group: xx% Market Share
- Mars Incorporated: xx% Market Share
- Mondelez International Inc.: xx% Market Share
Innovation Drivers:
- Product Diversification: The industry witnesses continuous innovation in flavors, textures, ingredients (e.g., organic, natural), and packaging to cater to evolving consumer preferences.
- Healthier Options: Growing health consciousness drives innovation in low-sugar, sugar-free, and functional candies.
- Sustainable Practices: Increasing emphasis on sustainability influences packaging materials and sourcing strategies.
Regulatory Framework & M&A Activities:
- Stringent regulations regarding sugar content, labeling, and ingredient safety influence market dynamics.
- M&A activities play a crucial role in market consolidation, with deal values totaling xx Million in the historical period (2019-2024). Examples include [insert specific M&A examples if data available, otherwise state "Data not available for specific examples"].
Candy Market Industry Trends & Insights
The global candy market is a vibrant and ever-evolving landscape, driven by a confluence of economic factors, consumer desires, and innovative advancements. Emerging economies, with their burgeoning middle class and increasing disposable incomes, are significant growth engines. This upward trend is further amplified by widespread urbanization, leading to greater accessibility and demand for convenient treat options. Consumers are increasingly seeking moments of indulgence and unique gifting solutions, propelling the market forward. However, the industry navigates complexities such as volatile raw material costs, a growing societal awareness of health and wellness, and the dynamic nature of regulatory frameworks.
- Key Growth Catalysts: Beyond rising disposable incomes and shifting lifestyles, the market is experiencing a surge in demand for premium and artisanal candies, reflecting a desire for unique experiences and higher quality ingredients. The rapid expansion of online retail channels, offering unparalleled convenience and accessibility, is also a major contributor to market expansion.
- Technological Innovations: The integration of automation in manufacturing is optimizing production efficiency and scalability. Sophisticated packaging technologies are not only enhancing product appeal but also improving shelf life and sustainability. Furthermore, the strategic use of data analytics is revolutionizing market research, enabling deeper consumer understanding and more targeted marketing efforts.
- Evolving Consumer Palates: There's a discernible trend towards healthier confectionery options, including reduced-sugar, sugar-free, and plant-based alternatives. Consumers also crave personalized experiences, whether through custom flavors, ingredients, or packaging. The continuous introduction of innovative flavors and textures keeps consumer engagement high and drives product diversification.
- Competitive Landscape: The candy sector is characterized by fierce competition, with established global players constantly innovating to maintain market share against agile emerging brands. This dynamic environment fuels relentless product development and strategic pricing adjustments. The growing influence of private label brands also presents a significant competitive challenge, often offering attractive value propositions.
Dominant Markets & Segments in Candy Market
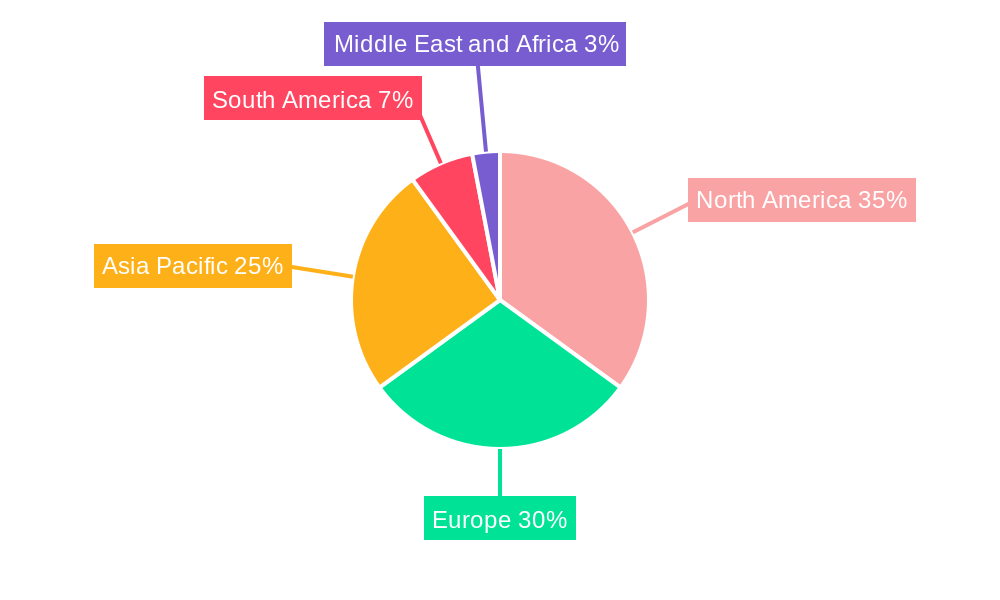
North America commands a leading position within the global candy market, a dominance attributed to its robust consumer spending power and the entrenched presence of major candy manufacturers. Within this expansive market, specific segments are exhibiting particular strength:
By Type:
- Chocolate Candy: This segment continues to be the market leader, underpinned by enduring consumer preference for its rich taste and diverse forms. However, it faces increasing scrutiny due to health concerns surrounding sugar and fat content, prompting manufacturers to explore reformulations and portion control options.
- Non-chocolate Candy: This category is experiencing robust growth, fueled by a wave of innovation in flavors, textures, and the introduction of healthier alternatives. Products such as gummies, hard candies, and chewy confections are at the forefront of this expansion, appealing to a broader consumer base seeking variety and novelty.
By Distribution Channel:
- Supermarkets/Hypermarkets: These remain the cornerstone of candy distribution, offering consumers a vast array of choices and the convenience of one-stop shopping.
- Convenience Stores: These outlets are crucial for capturing impulse purchases, providing readily accessible treats for consumers on the go.
- Online Retail: This channel is witnessing substantial growth, propelled by the widespread adoption of e-commerce and the increasing popularity of home delivery services, offering consumers new avenues for purchasing their favorite candies.
Key Drivers of Regional Dominance (North America):
- A deeply ingrained candy consumption culture, supported by high disposable incomes and a strong preference for confectionery products.
- The presence and strategic operations of prominent global candy corporations.
- A sophisticated and well-developed retail infrastructure, encompassing traditional brick-and-mortar stores as well as evolving online platforms.
Candy Market Product Developments
Recent innovations encompass healthier options, innovative flavors, interactive packaging (like Push Pop Gummy Pop-its), and sustainable packaging solutions. These developments cater to evolving consumer preferences for healthier treats, novel experiences, and environmentally responsible products. Companies are also investing in personalized products and unique flavor combinations to increase market differentiation and appeal to niche consumer segments.
Report Scope & Segmentation Analysis
This comprehensive report delves into the candy market, meticulously segmenting it by product type (distinguishing between chocolate and non-chocolate candies) and by distribution channels (including supermarkets/hypermarkets, convenience stores, specialist retailers, online retail, and other emergent channels). For each identified segment, the analysis provides detailed insights into market size, projected growth trajectories, and the prevailing competitive dynamics, offering a nuanced understanding of the opportunities present. Crucially, the report furnishes detailed growth forecasts for each segment covering the forecast period of 2025-2033.
Key Drivers of Candy Market Growth
Several factors contribute to the growth of the candy market:
- Rising Disposable Incomes: Increasing disposable incomes in developing countries fuel higher spending on discretionary items, including candy.
- Changing Lifestyles: Busy lifestyles and increased stress levels drive demand for convenient and mood-boosting treats.
- Product Innovation: Continuous innovation in flavors, textures, and formats caters to changing consumer tastes.
Challenges in the Candy Market Sector
The candy market navigates a complex terrain marked by several significant challenges:
- Health and Wellness Imperatives: A heightened global focus on health and wellness is leading consumers to curtail their intake of sugary products. This trend is a powerful impetus for the industry to innovate and develop a wider range of healthier confectionery alternatives.
- Supply Chain Volatility: The candy industry is susceptible to fluctuations in the prices of key raw materials such as sugar, cocoa, and dairy. Global supply chain disruptions further exacerbate these challenges, impacting production costs and overall profitability.
- Intense Market Competition: The candy sector is highly competitive, with both established multinational corporations and nimble new entrants vying for consumer attention. This environment necessitates continuous product innovation, effective marketing strategies, and competitive pricing to maintain market standing.
Emerging Opportunities in Candy Market
Emerging opportunities include:
- Growth in Emerging Markets: Expanding consumer base in developing countries presents significant growth potential.
- Premiumization: Increasing demand for premium and artisanal candy offers opportunities for higher-margin products.
- Healthier Options: Demand for sugar-free, low-sugar, and functional candies fuels innovation and market expansion.
Leading Players in the Candy Market Market
- Nestle SA
- Haribo GmbH & Co KG
- Ferrero Group
- Grupo Arcor
- Mars Incorporated
- Cloetta Ab
- Mondelez International Inc
- The Topps Company Inc
- Perfetti Van Melle Group BV
- The Hershey Company
Key Developments in Candy Market Industry
- May 2022: Bazooka Candy Brands expanded its popular Push Pop line with the introduction of Push Pop Gummy Pop-its, available in enticing flavors like strawberry, blue raspberry, berry blast, and watermelon.
- May 2022: The innovative Push Pop Gummy Pop-its were launched, merging the appeal of gummies with a unique, refillable dispensing mechanism for an interactive consumer experience.
- March 2022: HARIBO celebrated the Easter season with a delightful array of treats, including beloved returning favorites and new additions such as Jelly Bunnies and Chick 'n' Mix, catering to seasonal demand.
- [Year]: The prestigious Sweet & Snacks Expo held in Chicago served as a prominent platform for showcasing the latest advancements and innovations in the gummy confectionery segment, highlighting emerging trends and new product launches.
Strategic Outlook for Candy Market Market
The candy market is poised for continued growth, driven by rising disposable incomes, evolving consumer preferences, and continuous product innovation. Companies that successfully adapt to changing consumer health concerns, embrace sustainable practices, and leverage technological advancements will be well-positioned to capitalize on emerging opportunities. The focus on healthier options and innovative product development will be key to future market success.
Candy Market Segmentation
-
1. Type
- 1.1. Chocolate Candy
-
1.2. Non-chocolate Candy
- 1.2.1. Hard Boiled Candies
- 1.2.2. Pastilles, Gums, Jellies, and Chews
- 1.2.3. Toffees, Caramels, and Nougat
- 1.2.4. Mints
- 1.2.5. Other Non-chocolate Candies
-
2. Distribution Channel
- 2.1. Supermarkets/Hypermarkets
- 2.2. Convenience Stores
- 2.3. Specalist Retailers
- 2.4. Online Retail
- 2.5. Other Distribution Channels
Candy Market Segmentation By Geography
-
1. North America
- 1.1. United States
- 1.2. Canada
- 1.3. Mexico
- 1.4. Rest of North America
-
2. Europe
- 2.1. Germany
- 2.2. United Kingdom
- 2.3. France
- 2.4. Russia
- 2.5. Italy
- 2.6. Spain
- 2.7. Rest of Europe
-
3. Asia Pacific
- 3.1. India
- 3.2. China
- 3.3. Australia
- 3.4. Japan
- 3.5. Rest of Asia Pacific
-
4. South America
- 4.1. Brazil
- 4.2. Argentina
- 4.3. Rest of South America
-
5. Middle East and Africa
- 5.1. United Arab Emirates
- 5.2. South Africa
- 5.3. Rest of Middle East and Africa
Candy Market Regional Market Share
Geographic Coverage of Candy Market
Candy Market REPORT HIGHLIGHTS
| Aspects | Details |
|---|---|
| Study Period | 2020-2034 |
| Base Year | 2025 |
| Estimated Year | 2026 |
| Forecast Period | 2026-2034 |
| Historical Period | 2020-2025 |
| Growth Rate | CAGR of 3.82% from 2020-2034 |
| Segmentation |
|
Table of Contents
- 1. Introduction
- 1.1. Research Scope
- 1.2. Market Segmentation
- 1.3. Research Objective
- 1.4. Definitions and Assumptions
- 2. Executive Summary
- 2.1. Market Snapshot
- 3. Market Dynamics
- 3.1. Market Drivers
- 3.2. Market Restrains
- 3.3. Market Trends
- 3.4. Market Opportunities
- 4. Market Factor Analysis
- 4.1. Porters Five Forces
- 4.1.1. Bargaining Power of Suppliers
- 4.1.2. Bargaining Power of Buyers
- 4.1.3. Threat of New Entrants
- 4.1.4. Threat of Substitutes
- 4.1.5. Competitive Rivalry
- 4.2. PESTEL analysis
- 4.3. BCG Analysis
- 4.3.1. Stars (High Growth, High Market Share)
- 4.3.2. Cash Cows (Low Growth, High Market Share)
- 4.3.3. Question Mark (High Growth, Low Market Share)
- 4.3.4. Dogs (Low Growth, Low Market Share)
- 4.4. Ansoff Matrix Analysis
- 4.5. Supply Chain Analysis
- 4.6. Regulatory Landscape
- 4.7. Current Market Potential and Opportunity Assessment (TAM–SAM–SOM Framework)
- 4.8. RAX Analyst Note
- 4.1. Porters Five Forces
- 5. Market Analysis, Insights and Forecast 2021-2033
- 5.1. Market Analysis, Insights and Forecast - by Type
- 5.1.1. Chocolate Candy
- 5.1.2. Non-chocolate Candy
- 5.1.2.1. Hard Boiled Candies
- 5.1.2.2. Pastilles, Gums, Jellies, and Chews
- 5.1.2.3. Toffees, Caramels, and Nougat
- 5.1.2.4. Mints
- 5.1.2.5. Other Non-chocolate Candies
- 5.2. Market Analysis, Insights and Forecast - by Distribution Channel
- 5.2.1. Supermarkets/Hypermarkets
- 5.2.2. Convenience Stores
- 5.2.3. Specalist Retailers
- 5.2.4. Online Retail
- 5.2.5. Other Distribution Channels
- 5.3. Market Analysis, Insights and Forecast - by Region
- 5.3.1. North America
- 5.3.2. Europe
- 5.3.3. Asia Pacific
- 5.3.4. South America
- 5.3.5. Middle East and Africa
- 5.1. Market Analysis, Insights and Forecast - by Type
- 6. Global Candy Market Analysis, Insights and Forecast, 2021-2033
- 6.1. Market Analysis, Insights and Forecast - by Type
- 6.1.1. Chocolate Candy
- 6.1.2. Non-chocolate Candy
- 6.1.2.1. Hard Boiled Candies
- 6.1.2.2. Pastilles, Gums, Jellies, and Chews
- 6.1.2.3. Toffees, Caramels, and Nougat
- 6.1.2.4. Mints
- 6.1.2.5. Other Non-chocolate Candies
- 6.2. Market Analysis, Insights and Forecast - by Distribution Channel
- 6.2.1. Supermarkets/Hypermarkets
- 6.2.2. Convenience Stores
- 6.2.3. Specalist Retailers
- 6.2.4. Online Retail
- 6.2.5. Other Distribution Channels
- 6.1. Market Analysis, Insights and Forecast - by Type
- 7. North America Candy Market Analysis, Insights and Forecast, 2020-2032
- 7.1. Market Analysis, Insights and Forecast - by Type
- 7.1.1. Chocolate Candy
- 7.1.2. Non-chocolate Candy
- 7.1.2.1. Hard Boiled Candies
- 7.1.2.2. Pastilles, Gums, Jellies, and Chews
- 7.1.2.3. Toffees, Caramels, and Nougat
- 7.1.2.4. Mints
- 7.1.2.5. Other Non-chocolate Candies
- 7.2. Market Analysis, Insights and Forecast - by Distribution Channel
- 7.2.1. Supermarkets/Hypermarkets
- 7.2.2. Convenience Stores
- 7.2.3. Specalist Retailers
- 7.2.4. Online Retail
- 7.2.5. Other Distribution Channels
- 7.1. Market Analysis, Insights and Forecast - by Type
- 8. Europe Candy Market Analysis, Insights and Forecast, 2020-2032
- 8.1. Market Analysis, Insights and Forecast - by Type
- 8.1.1. Chocolate Candy
- 8.1.2. Non-chocolate Candy
- 8.1.2.1. Hard Boiled Candies
- 8.1.2.2. Pastilles, Gums, Jellies, and Chews
- 8.1.2.3. Toffees, Caramels, and Nougat
- 8.1.2.4. Mints
- 8.1.2.5. Other Non-chocolate Candies
- 8.2. Market Analysis, Insights and Forecast - by Distribution Channel
- 8.2.1. Supermarkets/Hypermarkets
- 8.2.2. Convenience Stores
- 8.2.3. Specalist Retailers
- 8.2.4. Online Retail
- 8.2.5. Other Distribution Channels
- 8.1. Market Analysis, Insights and Forecast - by Type
- 9. Asia Pacific Candy Market Analysis, Insights and Forecast, 2020-2032
- 9.1. Market Analysis, Insights and Forecast - by Type
- 9.1.1. Chocolate Candy
- 9.1.2. Non-chocolate Candy
- 9.1.2.1. Hard Boiled Candies
- 9.1.2.2. Pastilles, Gums, Jellies, and Chews
- 9.1.2.3. Toffees, Caramels, and Nougat
- 9.1.2.4. Mints
- 9.1.2.5. Other Non-chocolate Candies
- 9.2. Market Analysis, Insights and Forecast - by Distribution Channel
- 9.2.1. Supermarkets/Hypermarkets
- 9.2.2. Convenience Stores
- 9.2.3. Specalist Retailers
- 9.2.4. Online Retail
- 9.2.5. Other Distribution Channels
- 9.1. Market Analysis, Insights and Forecast - by Type
- 10. South America Candy Market Analysis, Insights and Forecast, 2020-2032
- 10.1. Market Analysis, Insights and Forecast - by Type
- 10.1.1. Chocolate Candy
- 10.1.2. Non-chocolate Candy
- 10.1.2.1. Hard Boiled Candies
- 10.1.2.2. Pastilles, Gums, Jellies, and Chews
- 10.1.2.3. Toffees, Caramels, and Nougat
- 10.1.2.4. Mints
- 10.1.2.5. Other Non-chocolate Candies
- 10.2. Market Analysis, Insights and Forecast - by Distribution Channel
- 10.2.1. Supermarkets/Hypermarkets
- 10.2.2. Convenience Stores
- 10.2.3. Specalist Retailers
- 10.2.4. Online Retail
- 10.2.5. Other Distribution Channels
- 10.1. Market Analysis, Insights and Forecast - by Type
- 11. Middle East and Africa Candy Market Analysis, Insights and Forecast, 2020-2032
- 11.1. Market Analysis, Insights and Forecast - by Type
- 11.1.1. Chocolate Candy
- 11.1.2. Non-chocolate Candy
- 11.1.2.1. Hard Boiled Candies
- 11.1.2.2. Pastilles, Gums, Jellies, and Chews
- 11.1.2.3. Toffees, Caramels, and Nougat
- 11.1.2.4. Mints
- 11.1.2.5. Other Non-chocolate Candies
- 11.2. Market Analysis, Insights and Forecast - by Distribution Channel
- 11.2.1. Supermarkets/Hypermarkets
- 11.2.2. Convenience Stores
- 11.2.3. Specalist Retailers
- 11.2.4. Online Retail
- 11.2.5. Other Distribution Channels
- 11.1. Market Analysis, Insights and Forecast - by Type
- 12. Competitive Analysis
- 12.1. Company Profiles
- 12.1.1 Nestle SA
- 12.1.1.1. Company Overview
- 12.1.1.2. Products
- 12.1.1.3. Company Financials
- 12.1.1.4. SWOT Analysis
- 12.1.2 Haribo GmbH & Co KG
- 12.1.2.1. Company Overview
- 12.1.2.2. Products
- 12.1.2.3. Company Financials
- 12.1.2.4. SWOT Analysis
- 12.1.3 Ferrero Group
- 12.1.3.1. Company Overview
- 12.1.3.2. Products
- 12.1.3.3. Company Financials
- 12.1.3.4. SWOT Analysis
- 12.1.4 Grupo Arcor
- 12.1.4.1. Company Overview
- 12.1.4.2. Products
- 12.1.4.3. Company Financials
- 12.1.4.4. SWOT Analysis
- 12.1.5 Mars Incorporated
- 12.1.5.1. Company Overview
- 12.1.5.2. Products
- 12.1.5.3. Company Financials
- 12.1.5.4. SWOT Analysis
- 12.1.6 Cloetta Ab
- 12.1.6.1. Company Overview
- 12.1.6.2. Products
- 12.1.6.3. Company Financials
- 12.1.6.4. SWOT Analysis
- 12.1.7 Mondelez International Inc
- 12.1.7.1. Company Overview
- 12.1.7.2. Products
- 12.1.7.3. Company Financials
- 12.1.7.4. SWOT Analysis
- 12.1.8 The Topps Company Inc *List Not Exhaustive
- 12.1.8.1. Company Overview
- 12.1.8.2. Products
- 12.1.8.3. Company Financials
- 12.1.8.4. SWOT Analysis
- 12.1.9 Perfetti Van Melle Group BV
- 12.1.9.1. Company Overview
- 12.1.9.2. Products
- 12.1.9.3. Company Financials
- 12.1.9.4. SWOT Analysis
- 12.1.10 The Hershey Company
- 12.1.10.1. Company Overview
- 12.1.10.2. Products
- 12.1.10.3. Company Financials
- 12.1.10.4. SWOT Analysis
- 12.1.1 Nestle SA
- 12.2. Market Entropy
- 12.2.1 Company's Key Areas Served
- 12.2.2 Recent Developments
- 12.3. Company Market Share Analysis 2025
- 12.3.1 Top 5 Companies Market Share Analysis
- 12.3.2 Top 3 Companies Market Share Analysis
- 12.4. List of Potential Customers
- 13. Research Methodology
List of Figures
- Figure 1: Global Candy Market Revenue Breakdown (Million, %) by Region 2025 & 2033
- Figure 2: North America Candy Market Revenue (Million), by Type 2025 & 2033
- Figure 3: North America Candy Market Revenue Share (%), by Type 2025 & 2033
- Figure 4: North America Candy Market Revenue (Million), by Distribution Channel 2025 & 2033
- Figure 5: North America Candy Market Revenue Share (%), by Distribution Channel 2025 & 2033
- Figure 6: North America Candy Market Revenue (Million), by Country 2025 & 2033
- Figure 7: North America Candy Market Revenue Share (%), by Country 2025 & 2033
- Figure 8: Europe Candy Market Revenue (Million), by Type 2025 & 2033
- Figure 9: Europe Candy Market Revenue Share (%), by Type 2025 & 2033
- Figure 10: Europe Candy Market Revenue (Million), by Distribution Channel 2025 & 2033
- Figure 11: Europe Candy Market Revenue Share (%), by Distribution Channel 2025 & 2033
- Figure 12: Europe Candy Market Revenue (Million), by Country 2025 & 2033
- Figure 13: Europe Candy Market Revenue Share (%), by Country 2025 & 2033
- Figure 14: Asia Pacific Candy Market Revenue (Million), by Type 2025 & 2033
- Figure 15: Asia Pacific Candy Market Revenue Share (%), by Type 2025 & 2033
- Figure 16: Asia Pacific Candy Market Revenue (Million), by Distribution Channel 2025 & 2033
- Figure 17: Asia Pacific Candy Market Revenue Share (%), by Distribution Channel 2025 & 2033
- Figure 18: Asia Pacific Candy Market Revenue (Million), by Country 2025 & 2033
- Figure 19: Asia Pacific Candy Market Revenue Share (%), by Country 2025 & 2033
- Figure 20: South America Candy Market Revenue (Million), by Type 2025 & 2033
- Figure 21: South America Candy Market Revenue Share (%), by Type 2025 & 2033
- Figure 22: South America Candy Market Revenue (Million), by Distribution Channel 2025 & 2033
- Figure 23: South America Candy Market Revenue Share (%), by Distribution Channel 2025 & 2033
- Figure 24: South America Candy Market Revenue (Million), by Country 2025 & 2033
- Figure 25: South America Candy Market Revenue Share (%), by Country 2025 & 2033
- Figure 26: Middle East and Africa Candy Market Revenue (Million), by Type 2025 & 2033
- Figure 27: Middle East and Africa Candy Market Revenue Share (%), by Type 2025 & 2033
- Figure 28: Middle East and Africa Candy Market Revenue (Million), by Distribution Channel 2025 & 2033
- Figure 29: Middle East and Africa Candy Market Revenue Share (%), by Distribution Channel 2025 & 2033
- Figure 30: Middle East and Africa Candy Market Revenue (Million), by Country 2025 & 2033
- Figure 31: Middle East and Africa Candy Market Revenue Share (%), by Country 2025 & 2033
List of Tables
- Table 1: Global Candy Market Revenue Million Forecast, by Type 2020 & 2033
- Table 2: Global Candy Market Revenue Million Forecast, by Distribution Channel 2020 & 2033
- Table 3: Global Candy Market Revenue Million Forecast, by Region 2020 & 2033
- Table 4: Global Candy Market Revenue Million Forecast, by Type 2020 & 2033
- Table 5: Global Candy Market Revenue Million Forecast, by Distribution Channel 2020 & 2033
- Table 6: Global Candy Market Revenue Million Forecast, by Country 2020 & 2033
- Table 7: United States Candy Market Revenue (Million) Forecast, by Application 2020 & 2033
- Table 8: Canada Candy Market Revenue (Million) Forecast, by Application 2020 & 2033
- Table 9: Mexico Candy Market Revenue (Million) Forecast, by Application 2020 & 2033
- Table 10: Rest of North America Candy Market Revenue (Million) Forecast, by Application 2020 & 2033
- Table 11: Global Candy Market Revenue Million Forecast, by Type 2020 & 2033
- Table 12: Global Candy Market Revenue Million Forecast, by Distribution Channel 2020 & 2033
- Table 13: Global Candy Market Revenue Million Forecast, by Country 2020 & 2033
- Table 14: Germany Candy Market Revenue (Million) Forecast, by Application 2020 & 2033
- Table 15: United Kingdom Candy Market Revenue (Million) Forecast, by Application 2020 & 2033
- Table 16: France Candy Market Revenue (Million) Forecast, by Application 2020 & 2033
- Table 17: Russia Candy Market Revenue (Million) Forecast, by Application 2020 & 2033
- Table 18: Italy Candy Market Revenue (Million) Forecast, by Application 2020 & 2033
- Table 19: Spain Candy Market Revenue (Million) Forecast, by Application 2020 & 2033
- Table 20: Rest of Europe Candy Market Revenue (Million) Forecast, by Application 2020 & 2033
- Table 21: Global Candy Market Revenue Million Forecast, by Type 2020 & 2033
- Table 22: Global Candy Market Revenue Million Forecast, by Distribution Channel 2020 & 2033
- Table 23: Global Candy Market Revenue Million Forecast, by Country 2020 & 2033
- Table 24: India Candy Market Revenue (Million) Forecast, by Application 2020 & 2033
- Table 25: China Candy Market Revenue (Million) Forecast, by Application 2020 & 2033
- Table 26: Australia Candy Market Revenue (Million) Forecast, by Application 2020 & 2033
- Table 27: Japan Candy Market Revenue (Million) Forecast, by Application 2020 & 2033
- Table 28: Rest of Asia Pacific Candy Market Revenue (Million) Forecast, by Application 2020 & 2033
- Table 29: Global Candy Market Revenue Million Forecast, by Type 2020 & 2033
- Table 30: Global Candy Market Revenue Million Forecast, by Distribution Channel 2020 & 2033
- Table 31: Global Candy Market Revenue Million Forecast, by Country 2020 & 2033
- Table 32: Brazil Candy Market Revenue (Million) Forecast, by Application 2020 & 2033
- Table 33: Argentina Candy Market Revenue (Million) Forecast, by Application 2020 & 2033
- Table 34: Rest of South America Candy Market Revenue (Million) Forecast, by Application 2020 & 2033
- Table 35: Global Candy Market Revenue Million Forecast, by Type 2020 & 2033
- Table 36: Global Candy Market Revenue Million Forecast, by Distribution Channel 2020 & 2033
- Table 37: Global Candy Market Revenue Million Forecast, by Country 2020 & 2033
- Table 38: United Arab Emirates Candy Market Revenue (Million) Forecast, by Application 2020 & 2033
- Table 39: South Africa Candy Market Revenue (Million) Forecast, by Application 2020 & 2033
- Table 40: Rest of Middle East and Africa Candy Market Revenue (Million) Forecast, by Application 2020 & 2033
Frequently Asked Questions
1. What is the projected Compound Annual Growth Rate (CAGR) of the Candy Market?
The projected CAGR is approximately 3.82%.
2. Which companies are prominent players in the Candy Market?
Key companies in the market include Nestle SA, Haribo GmbH & Co KG, Ferrero Group, Grupo Arcor, Mars Incorporated, Cloetta Ab, Mondelez International Inc, The Topps Company Inc *List Not Exhaustive, Perfetti Van Melle Group BV, The Hershey Company.
3. What are the main segments of the Candy Market?
The market segments include Type, Distribution Channel.
4. Can you provide details about the market size?
The market size is estimated to be USD 69.20 Million as of 2022.
5. What are some drivers contributing to market growth?
Iced Tea as a Healthy Alternative for Daily Intake; Introduction of Innovative and Flavorful Iced Tea Options.
6. What are the notable trends driving market growth?
Rising Demand for Sugar-free Candies.
7. Are there any restraints impacting market growth?
Competiton From Substitutes.
8. Can you provide examples of recent developments in the market?
In May 2022, Push Pop Gummy Pop-its were introduced by Bazooka Candy Brands. This year's Sweet & Snacks Expo in Chicago will feature the newest gummy innovation. Push Pop Gummy Pop-its, which debuted under the Push Pop brand, combine gummies with an interactive, refillable container.
9. What pricing options are available for accessing the report?
Pricing options include single-user, multi-user, and enterprise licenses priced at USD 4750, USD 5250, and USD 8750 respectively.
10. Is the market size provided in terms of value or volume?
The market size is provided in terms of value, measured in Million.
11. Are there any specific market keywords associated with the report?
Yes, the market keyword associated with the report is "Candy Market," which aids in identifying and referencing the specific market segment covered.
12. How do I determine which pricing option suits my needs best?
The pricing options vary based on user requirements and access needs. Individual users may opt for single-user licenses, while businesses requiring broader access may choose multi-user or enterprise licenses for cost-effective access to the report.
13. Are there any additional resources or data provided in the Candy Market report?
While the report offers comprehensive insights, it's advisable to review the specific contents or supplementary materials provided to ascertain if additional resources or data are available.
14. How can I stay updated on further developments or reports in the Candy Market?
To stay informed about further developments, trends, and reports in the Candy Market, consider subscribing to industry newsletters, following relevant companies and organizations, or regularly checking reputable industry news sources and publications.
Methodology
Step 1 - Identification of Relevant Samples Size from Population Database


Step 2 - Approaches for Defining Global Market Size (Value, Volume* & Price*)

Note*: In applicable scenarios
Step 3 - Data Sources
Primary Research
- Web Analytics
- Survey Reports
- Research Institute
- Latest Research Reports
- Opinion Leaders
Secondary Research
- Annual Reports
- White Paper
- Latest Press Release
- Industry Association
- Paid Database
- Investor Presentations

Step 4 - Data Triangulation
Involves using different sources of information in order to increase the validity of a study
These sources are likely to be stakeholders in a program - participants, other researchers, program staff, other community members, and so on.
Then we put all data in single framework & apply various statistical tools to find out the dynamic on the market.
During the analysis stage, feedback from the stakeholder groups would be compared to determine areas of agreement as well as areas of divergence

