
Key Insights
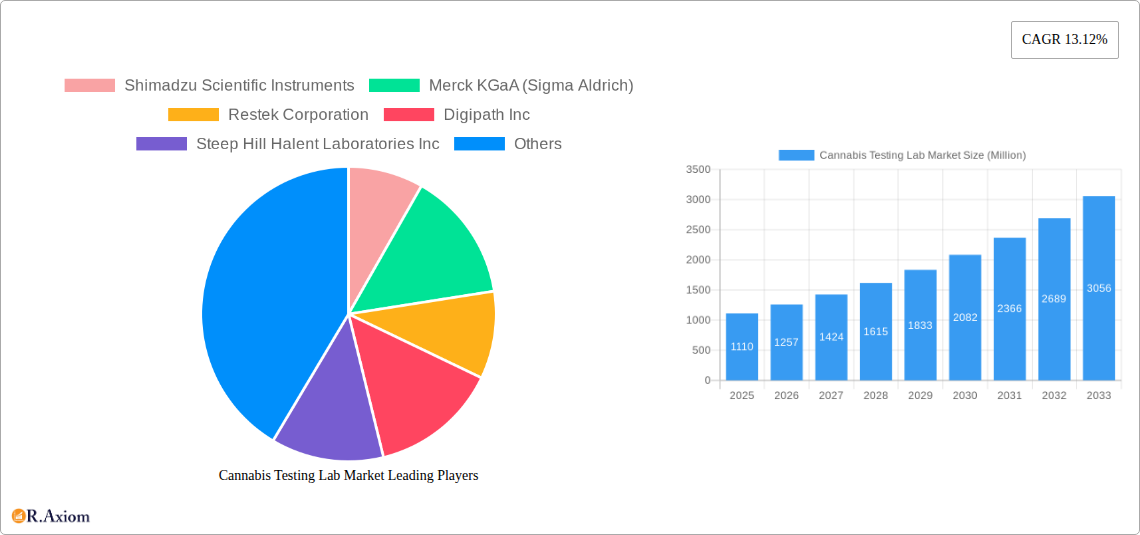
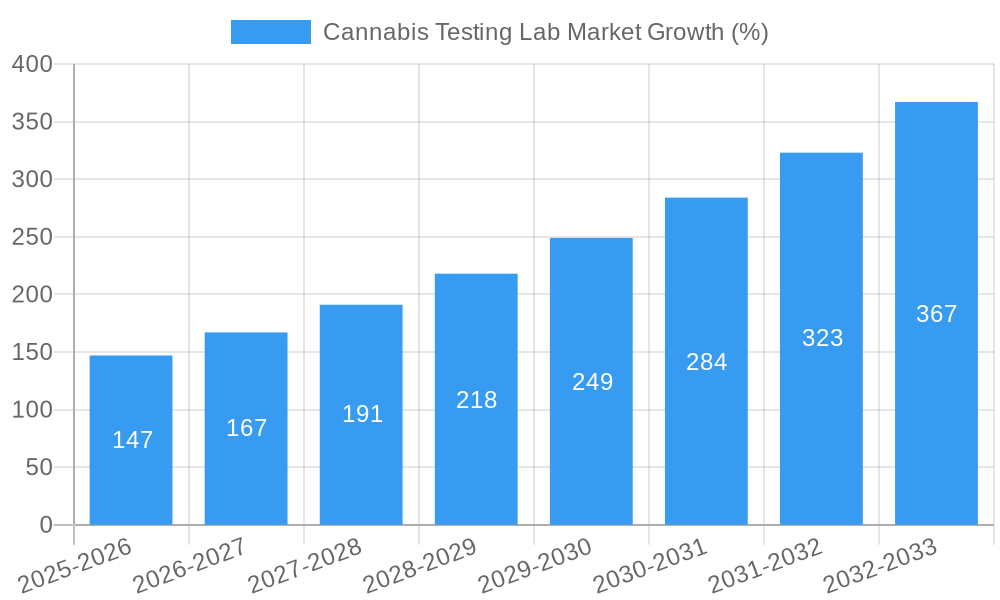
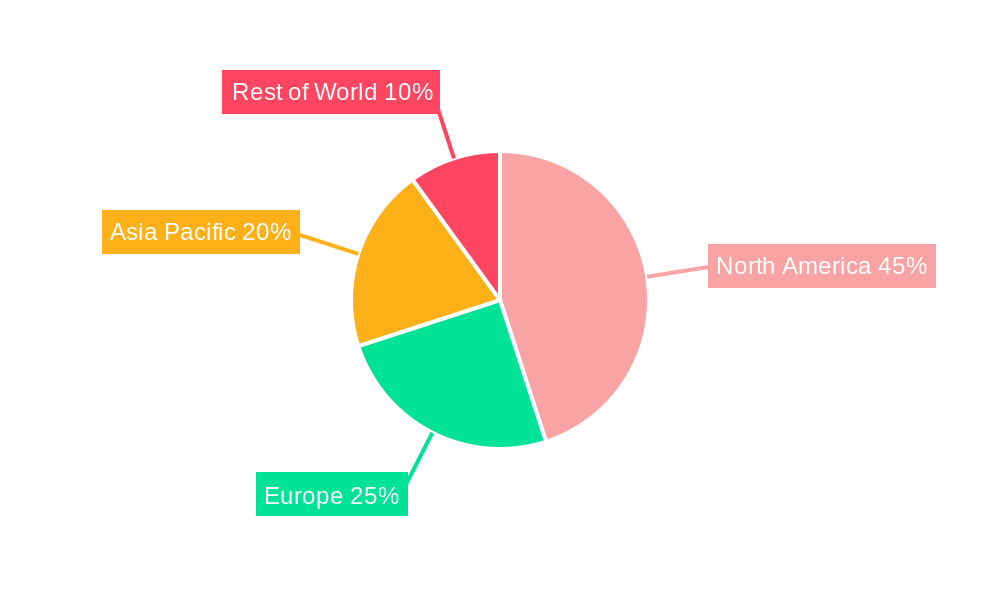
The cannabis testing lab market is experiencing robust growth, driven by the increasing legalization and acceptance of cannabis for both medical and recreational use globally. The market, valued at $1.11 billion in 2025, is projected to expand at a compound annual growth rate (CAGR) of 13.12% from 2025 to 2033. This significant growth is fueled by stringent regulatory requirements mandating comprehensive testing for potency, terpene profiles, residual solvents, heavy metals, and mycotoxins. The demand for accurate and reliable testing is paramount for ensuring product safety and consumer confidence, thereby driving the market's expansion. Major market segments include potency testing, which holds a significant share, followed by terpene profiling and residual solvent screening. The end-user segment is dominated by laboratories and cannabis drug manufacturers and dispensaries, reflecting the crucial role of testing in the entire cannabis supply chain. Technological advancements in analytical instruments, such as spectroscopy instruments, and the development of sophisticated cannabis testing software and services are also contributing to market growth. Geographical expansion is also a key driver, with North America currently leading the market, followed by Europe and the Asia-Pacific region. The market is characterized by the presence of both large multinational corporations and specialized smaller companies, indicating a dynamic competitive landscape.
The continued expansion of the legal cannabis industry globally is expected to further fuel the market's growth. Increasing consumer awareness of the importance of cannabis product safety and quality will also drive demand for testing services. Furthermore, advancements in testing technologies, such as faster and more efficient analytical methods, will enhance the market's appeal. However, potential challenges such as regulatory changes and variations in testing standards across different jurisdictions might present some restraints to growth. Nevertheless, the long-term outlook for the cannabis testing lab market remains positive, driven by sustained demand for safe and high-quality cannabis products. The market is expected to witness further consolidation, with larger players potentially acquiring smaller companies to expand their market share and service offerings.
This detailed report provides a comprehensive analysis of the Cannabis Testing Lab Market, covering the period from 2019 to 2033. It offers in-depth insights into market dynamics, growth drivers, challenges, opportunities, and key players, equipping stakeholders with actionable intelligence for strategic decision-making. The report leverages extensive data analysis and industry expertise to present a clear and concise overview of this rapidly evolving market, projected to reach xx Million by 2033.
Cannabis Testing Lab Market Concentration & Innovation
The Cannabis Testing Lab market exhibits a moderately concentrated landscape, with several large players holding significant market share alongside a number of smaller, specialized firms. Key players such as Shimadzu Scientific Instruments, Merck KGaA (Sigma Aldrich), and Agilent Technologies Inc. contribute significantly to the market’s overall revenue. However, the presence of numerous smaller, regional labs and the continuous emergence of innovative testing technologies indicates a dynamic and competitive environment.
Market concentration is influenced by several factors:
- Technological advancements: Continuous innovation in analytical instruments and software drives market competition and influences market share.
- Regulatory landscape: Stringent regulatory requirements vary across different jurisdictions, influencing market access and concentration levels.
- Mergers and Acquisitions (M&A): M&A activities have played a role in consolidating market share, with deal values varying significantly based on the size and strategic importance of the acquired entity. For example, a recent xx Million acquisition of a smaller testing lab by a larger company significantly altered the regional market share.
- End-user trends: The increasing demand for quality control and compliance within the cannabis industry drives market growth and influences the distribution of market share among various players.
Product substitutes, while limited, include older or less sophisticated testing methods. However, the demand for accuracy, speed, and comprehensive testing pushes the market towards more advanced technologies. The market’s innovation is driven by the need for faster, more accurate, and cost-effective testing solutions, especially in areas like terpene profiling and residual solvent analysis.
Cannabis Testing Lab Market Industry Trends & Insights
The Cannabis Testing Lab market is experiencing significant growth, fueled by the expanding global cannabis industry. The market's Compound Annual Growth Rate (CAGR) from 2019 to 2024 was estimated at xx%, and is projected to reach xx% during the forecast period (2025-2033). This growth is driven by increasing legalization and regulatory frameworks, stricter quality control measures, and rising consumer demand for safe and high-quality cannabis products.
Technological disruptions are significant, with advancements in analytical instrumentation (such as HPLC, GC-MS, and LC-MS) enabling faster, more accurate, and sensitive testing. The adoption of automated systems and AI-powered data analysis further enhances efficiency and reduces human error. Consumer preferences are shifting towards detailed product information, including terpene profiles and cannabinoid potency, driving the demand for comprehensive testing services. Competitive dynamics are characterized by both fierce competition and strategic collaborations among players seeking to expand their market reach and technological capabilities. Market penetration rates are increasing across different regions, driven by favorable regulatory changes and growing industry awareness of the importance of accurate testing.
Dominant Markets & Segments in Cannabis Testing Lab Market
Dominant Region: North America currently holds the largest market share, driven by early legalization and robust regulatory frameworks in countries such as Canada and the United States. Europe is also emerging as a significant market, with increasing legalization and growing demand for cannabis-related products.
Dominant Type Segment: Potency testing is currently the largest segment, driven by the need to verify the cannabinoid content of cannabis products. However, the demand for terpene profiling and residual solvent screening is rapidly increasing, indicating a shift towards more comprehensive testing solutions.
Dominant End-User Segment: Laboratories remain the dominant end-user segment due to their role in providing testing services to cannabis producers and dispensaries. However, the increasing in-house testing capabilities of larger cannabis manufacturers and dispensaries indicate a potential shift in the end-user landscape.
Dominant Product/Service Segment: Analytical instruments, specifically chromatography systems, hold the largest market share. This is followed by consumables and cannabis testing software and services, which are experiencing increasing demand as testing technologies become more sophisticated.
Key Drivers for Dominance:
- North America: Early legalization, robust regulatory frameworks, significant investments in cannabis infrastructure, and high consumer demand.
- Potency Testing: Stringent regulations regarding cannabinoid content, consumer demand for accurate product information.
- Laboratories: Expertise in conducting complex tests, access to advanced technology, and established infrastructure.
- Analytical Instruments: Accuracy, precision, and speed of analysis provided by advanced chromatography systems.
Cannabis Testing Lab Market Product Developments
Recent innovations focus on enhancing testing speed, accuracy, and efficiency. This includes advancements in analytical instruments, automation technologies, and software solutions. These innovations are driven by the demand for faster turnaround times, improved data analysis, and cost-effective solutions. The integration of AI and machine learning is improving data interpretation and streamlining workflows. Companies are focusing on developing user-friendly software and comprehensive data management systems to meet the increasing demand for detailed and easily accessible test results. These technological advancements ensure greater compliance with stringent regulations and meet the growing market needs for high-quality cannabis products.
Report Scope & Segmentation Analysis
This report provides a comprehensive segmentation analysis of the Cannabis Testing Lab market across various parameters, including:
Type: Potency Testing, Terpene Profiling, Residual Solvent Screening, Heavy Metal Testing, Mycotoxin Testing, Other Types. Each segment's growth trajectory is analyzed, considering its current market size, future growth projections, and the competitive dynamics within each segment.
End User: Laboratories, Cannabis Drug Manufacturers and Dispensaries, Other End Users. Market size and growth potential for each end-user segment are detailed, taking into account their unique needs and testing requirements.
Product and Software/Service: Analytical Instruments (including HPLC, GC-MS, and LC-MS), Spectroscopy Instruments, Consumables, Cannabis Testing Software and Services. The report explores the market dynamics within each product/service segment, emphasizing growth opportunities and technological advancements.
Key Drivers of Cannabis Testing Lab Market Growth
The Cannabis Testing Lab market’s growth is driven by several factors: increasing legalization of cannabis in various regions globally, stringent regulatory requirements mandating quality control and safety testing, rising consumer demand for safe and high-quality products, and continuous technological advancements leading to faster, more accurate, and cost-effective testing solutions. The expanding cannabis industry, coupled with the need for ensuring product safety and compliance, creates a strong foundation for consistent market growth.
Challenges in the Cannabis Testing Lab Market Sector
The Cannabis Testing Lab market faces challenges including stringent regulations and licensing requirements across various jurisdictions, creating barriers to entry and impacting market expansion. Supply chain disruptions can also affect the availability of essential testing equipment and consumables, impacting testing capacity and potentially driving up costs. Finally, intense competition among established players and new entrants is impacting pricing strategies and profit margins. These factors represent significant hurdles for companies operating in this market.
Emerging Opportunities in Cannabis Testing Lab Market
Emerging opportunities include expansion into new markets with emerging cannabis legalization, development of innovative testing methods addressing evolving regulatory requirements, and the integration of advanced technologies like AI and machine learning for more efficient and accurate analysis. The growing demand for comprehensive testing solutions, including terpene profiling and advanced contaminant analysis, presents further opportunities for innovation and market expansion. Furthermore, the development of standardized testing protocols and accreditation processes will further enhance market growth and consumer confidence.
Leading Players in the Cannabis Testing Lab Market
- Shimadzu Scientific Instruments
- Merck KGaA (Sigma Aldrich)
- Restek Corporation
- Digipath Inc
- Steep Hill Halent Laboratories Inc
- Sartorius AG
- Danaher Corporation
- Agilent Technologies Inc
- AB Sciex Pte Ltd
- Accelerated Technology Laboratories Inc
- Pharmlabs LLC
- PerkinElmer Inc
Key Developments in Cannabis Testing Lab Market Industry
- August 2022: ACS Laboratory launched a national hemp compliance testing panel, expanding its testing capabilities significantly.
- July 2022: Green Scientific Labs introduced new cannabis testing software, enhancing efficiency and data analysis.
Strategic Outlook for Cannabis Testing Lab Market
The Cannabis Testing Lab market is poised for significant growth in the coming years, driven by continued legalization efforts globally, increased focus on product safety and quality, and technological advancements. Companies with a focus on innovation, strategic partnerships, and adaptability will be best positioned to capitalize on the emerging opportunities within this dynamic market. The expansion into new geographic markets and the development of advanced testing solutions addressing emerging regulatory requirements will be critical for future success.
Cannabis Testing Lab Market Segmentation
-
1. Product and Software/Service
- 1.1. Analytical Instruments
- 1.2. Spectroscopy Instruments
- 1.3. Consumables
- 1.4. Cannabis Testing Software and Services
-
2. Type
- 2.1. Potency Testing
- 2.2. Terpene Profiling
- 2.3. Residual Solvent Screening
- 2.4. Heavy Metal Testing
- 2.5. Mycotoxin Testing
- 2.6. Other Types
-
3. End User
- 3.1. Laboratories
- 3.2. Cannabis Drug Manufacturers and Dispensaries
- 3.3. Other End Users
Cannabis Testing Lab Market Segmentation By Geography
-
1. North America
- 1.1. United States
- 1.2. Canada
- 1.3. Mexico
-
2. Europe
- 2.1. Germany
- 2.2. United Kingdom
- 2.3. France
- 2.4. Italy
- 2.5. Spain
- 2.6. Rest of Europe
-
3. Asia Pacific
- 3.1. China
- 3.2. Japan
- 3.3. India
- 3.4. Australia
- 3.5. South Korea
- 3.6. Rest of Asia Pacific
-
4. Middle East and Africa
- 4.1. GCC
- 4.2. South Africa
- 4.3. Rest of Middle East and Africa
-
5. South America
- 5.1. Brazil
- 5.2. Argentina
- 5.3. Rest of South America
Cannabis Testing Lab Market REPORT HIGHLIGHTS
| Aspects | Details |
|---|---|
| Study Period | 2019-2033 |
| Base Year | 2024 |
| Estimated Year | 2025 |
| Forecast Period | 2025-2033 |
| Historical Period | 2019-2024 |
| Growth Rate | CAGR of 13.12% from 2019-2033 |
| Segmentation |
|
Table of Contents
- 1. Introduction
- 1.1. Research Scope
- 1.2. Market Segmentation
- 1.3. Research Methodology
- 1.4. Definitions and Assumptions
- 2. Executive Summary
- 2.1. Introduction
- 3. Market Dynamics
- 3.1. Introduction
- 3.2. Market Drivers
- 3.2.1. Legalization of Cannabis for Various Medical Purposes; Increasing Awareness regarding Cannabis for Treating Neurological Diseases
- 3.3. Market Restrains
- 3.3.1. High Cost of Analytical Instruments
- 3.4. Market Trends
- 3.4.1. The Analytical Instruments Segment is Dominating the Market
- 4. Market Factor Analysis
- 4.1. Porters Five Forces
- 4.2. Supply/Value Chain
- 4.3. PESTEL analysis
- 4.4. Market Entropy
- 4.5. Patent/Trademark Analysis
- 5. Global Cannabis Testing Lab Market Analysis, Insights and Forecast, 2019-2031
- 5.1. Market Analysis, Insights and Forecast - by Product and Software/Service
- 5.1.1. Analytical Instruments
- 5.1.2. Spectroscopy Instruments
- 5.1.3. Consumables
- 5.1.4. Cannabis Testing Software and Services
- 5.2. Market Analysis, Insights and Forecast - by Type
- 5.2.1. Potency Testing
- 5.2.2. Terpene Profiling
- 5.2.3. Residual Solvent Screening
- 5.2.4. Heavy Metal Testing
- 5.2.5. Mycotoxin Testing
- 5.2.6. Other Types
- 5.3. Market Analysis, Insights and Forecast - by End User
- 5.3.1. Laboratories
- 5.3.2. Cannabis Drug Manufacturers and Dispensaries
- 5.3.3. Other End Users
- 5.4. Market Analysis, Insights and Forecast - by Region
- 5.4.1. North America
- 5.4.2. Europe
- 5.4.3. Asia Pacific
- 5.4.4. Middle East and Africa
- 5.4.5. South America
- 5.1. Market Analysis, Insights and Forecast - by Product and Software/Service
- 6. North America Cannabis Testing Lab Market Analysis, Insights and Forecast, 2019-2031
- 6.1. Market Analysis, Insights and Forecast - by Product and Software/Service
- 6.1.1. Analytical Instruments
- 6.1.2. Spectroscopy Instruments
- 6.1.3. Consumables
- 6.1.4. Cannabis Testing Software and Services
- 6.2. Market Analysis, Insights and Forecast - by Type
- 6.2.1. Potency Testing
- 6.2.2. Terpene Profiling
- 6.2.3. Residual Solvent Screening
- 6.2.4. Heavy Metal Testing
- 6.2.5. Mycotoxin Testing
- 6.2.6. Other Types
- 6.3. Market Analysis, Insights and Forecast - by End User
- 6.3.1. Laboratories
- 6.3.2. Cannabis Drug Manufacturers and Dispensaries
- 6.3.3. Other End Users
- 6.1. Market Analysis, Insights and Forecast - by Product and Software/Service
- 7. Europe Cannabis Testing Lab Market Analysis, Insights and Forecast, 2019-2031
- 7.1. Market Analysis, Insights and Forecast - by Product and Software/Service
- 7.1.1. Analytical Instruments
- 7.1.2. Spectroscopy Instruments
- 7.1.3. Consumables
- 7.1.4. Cannabis Testing Software and Services
- 7.2. Market Analysis, Insights and Forecast - by Type
- 7.2.1. Potency Testing
- 7.2.2. Terpene Profiling
- 7.2.3. Residual Solvent Screening
- 7.2.4. Heavy Metal Testing
- 7.2.5. Mycotoxin Testing
- 7.2.6. Other Types
- 7.3. Market Analysis, Insights and Forecast - by End User
- 7.3.1. Laboratories
- 7.3.2. Cannabis Drug Manufacturers and Dispensaries
- 7.3.3. Other End Users
- 7.1. Market Analysis, Insights and Forecast - by Product and Software/Service
- 8. Asia Pacific Cannabis Testing Lab Market Analysis, Insights and Forecast, 2019-2031
- 8.1. Market Analysis, Insights and Forecast - by Product and Software/Service
- 8.1.1. Analytical Instruments
- 8.1.2. Spectroscopy Instruments
- 8.1.3. Consumables
- 8.1.4. Cannabis Testing Software and Services
- 8.2. Market Analysis, Insights and Forecast - by Type
- 8.2.1. Potency Testing
- 8.2.2. Terpene Profiling
- 8.2.3. Residual Solvent Screening
- 8.2.4. Heavy Metal Testing
- 8.2.5. Mycotoxin Testing
- 8.2.6. Other Types
- 8.3. Market Analysis, Insights and Forecast - by End User
- 8.3.1. Laboratories
- 8.3.2. Cannabis Drug Manufacturers and Dispensaries
- 8.3.3. Other End Users
- 8.1. Market Analysis, Insights and Forecast - by Product and Software/Service
- 9. Middle East and Africa Cannabis Testing Lab Market Analysis, Insights and Forecast, 2019-2031
- 9.1. Market Analysis, Insights and Forecast - by Product and Software/Service
- 9.1.1. Analytical Instruments
- 9.1.2. Spectroscopy Instruments
- 9.1.3. Consumables
- 9.1.4. Cannabis Testing Software and Services
- 9.2. Market Analysis, Insights and Forecast - by Type
- 9.2.1. Potency Testing
- 9.2.2. Terpene Profiling
- 9.2.3. Residual Solvent Screening
- 9.2.4. Heavy Metal Testing
- 9.2.5. Mycotoxin Testing
- 9.2.6. Other Types
- 9.3. Market Analysis, Insights and Forecast - by End User
- 9.3.1. Laboratories
- 9.3.2. Cannabis Drug Manufacturers and Dispensaries
- 9.3.3. Other End Users
- 9.1. Market Analysis, Insights and Forecast - by Product and Software/Service
- 10. South America Cannabis Testing Lab Market Analysis, Insights and Forecast, 2019-2031
- 10.1. Market Analysis, Insights and Forecast - by Product and Software/Service
- 10.1.1. Analytical Instruments
- 10.1.2. Spectroscopy Instruments
- 10.1.3. Consumables
- 10.1.4. Cannabis Testing Software and Services
- 10.2. Market Analysis, Insights and Forecast - by Type
- 10.2.1. Potency Testing
- 10.2.2. Terpene Profiling
- 10.2.3. Residual Solvent Screening
- 10.2.4. Heavy Metal Testing
- 10.2.5. Mycotoxin Testing
- 10.2.6. Other Types
- 10.3. Market Analysis, Insights and Forecast - by End User
- 10.3.1. Laboratories
- 10.3.2. Cannabis Drug Manufacturers and Dispensaries
- 10.3.3. Other End Users
- 10.1. Market Analysis, Insights and Forecast - by Product and Software/Service
- 11. North America Cannabis Testing Lab Market Analysis, Insights and Forecast, 2019-2031
- 11.1. Market Analysis, Insights and Forecast - By Country/Sub-region
- 11.1.1 United States
- 11.1.2 Canada
- 11.1.3 Mexico
- 12. Europe Cannabis Testing Lab Market Analysis, Insights and Forecast, 2019-2031
- 12.1. Market Analysis, Insights and Forecast - By Country/Sub-region
- 12.1.1 Germany
- 12.1.2 United Kingdom
- 12.1.3 France
- 12.1.4 Italy
- 12.1.5 Spain
- 12.1.6 Rest of Europe
- 13. Asia Pacific Cannabis Testing Lab Market Analysis, Insights and Forecast, 2019-2031
- 13.1. Market Analysis, Insights and Forecast - By Country/Sub-region
- 13.1.1 China
- 13.1.2 Japan
- 13.1.3 India
- 13.1.4 Australia
- 13.1.5 South Korea
- 13.1.6 Rest of Asia Pacific
- 14. Middle East and Africa Cannabis Testing Lab Market Analysis, Insights and Forecast, 2019-2031
- 14.1. Market Analysis, Insights and Forecast - By Country/Sub-region
- 14.1.1 GCC
- 14.1.2 South Africa
- 14.1.3 Rest of Middle East and Africa
- 15. South America Cannabis Testing Lab Market Analysis, Insights and Forecast, 2019-2031
- 15.1. Market Analysis, Insights and Forecast - By Country/Sub-region
- 15.1.1 Brazil
- 15.1.2 Argentina
- 15.1.3 Rest of South America
- 16. Competitive Analysis
- 16.1. Global Market Share Analysis 2024
- 16.2. Company Profiles
- 16.2.1 Shimadzu Scientific Instruments
- 16.2.1.1. Overview
- 16.2.1.2. Products
- 16.2.1.3. SWOT Analysis
- 16.2.1.4. Recent Developments
- 16.2.1.5. Financials (Based on Availability)
- 16.2.2 Merck KGaA (Sigma Aldrich)
- 16.2.2.1. Overview
- 16.2.2.2. Products
- 16.2.2.3. SWOT Analysis
- 16.2.2.4. Recent Developments
- 16.2.2.5. Financials (Based on Availability)
- 16.2.3 Restek Corporation
- 16.2.3.1. Overview
- 16.2.3.2. Products
- 16.2.3.3. SWOT Analysis
- 16.2.3.4. Recent Developments
- 16.2.3.5. Financials (Based on Availability)
- 16.2.4 Digipath Inc
- 16.2.4.1. Overview
- 16.2.4.2. Products
- 16.2.4.3. SWOT Analysis
- 16.2.4.4. Recent Developments
- 16.2.4.5. Financials (Based on Availability)
- 16.2.5 Steep Hill Halent Laboratories Inc
- 16.2.5.1. Overview
- 16.2.5.2. Products
- 16.2.5.3. SWOT Analysis
- 16.2.5.4. Recent Developments
- 16.2.5.5. Financials (Based on Availability)
- 16.2.6 Sartorius AG
- 16.2.6.1. Overview
- 16.2.6.2. Products
- 16.2.6.3. SWOT Analysis
- 16.2.6.4. Recent Developments
- 16.2.6.5. Financials (Based on Availability)
- 16.2.7 Danaher Corporation
- 16.2.7.1. Overview
- 16.2.7.2. Products
- 16.2.7.3. SWOT Analysis
- 16.2.7.4. Recent Developments
- 16.2.7.5. Financials (Based on Availability)
- 16.2.8 Agilent Technologies Inc
- 16.2.8.1. Overview
- 16.2.8.2. Products
- 16.2.8.3. SWOT Analysis
- 16.2.8.4. Recent Developments
- 16.2.8.5. Financials (Based on Availability)
- 16.2.9 AB Sciex Pte Ltd
- 16.2.9.1. Overview
- 16.2.9.2. Products
- 16.2.9.3. SWOT Analysis
- 16.2.9.4. Recent Developments
- 16.2.9.5. Financials (Based on Availability)
- 16.2.10 Accelerated Technology Laboratories Inc
- 16.2.10.1. Overview
- 16.2.10.2. Products
- 16.2.10.3. SWOT Analysis
- 16.2.10.4. Recent Developments
- 16.2.10.5. Financials (Based on Availability)
- 16.2.11 Pharmlabs LLC
- 16.2.11.1. Overview
- 16.2.11.2. Products
- 16.2.11.3. SWOT Analysis
- 16.2.11.4. Recent Developments
- 16.2.11.5. Financials (Based on Availability)
- 16.2.12 PerkinElmer Inc
- 16.2.12.1. Overview
- 16.2.12.2. Products
- 16.2.12.3. SWOT Analysis
- 16.2.12.4. Recent Developments
- 16.2.12.5. Financials (Based on Availability)
- 16.2.1 Shimadzu Scientific Instruments
List of Figures
- Figure 1: Global Cannabis Testing Lab Market Revenue Breakdown (Million, %) by Region 2024 & 2032
- Figure 2: Global Cannabis Testing Lab Market Volume Breakdown (K Unit, %) by Region 2024 & 2032
- Figure 3: North America Cannabis Testing Lab Market Revenue (Million), by Country 2024 & 2032
- Figure 4: North America Cannabis Testing Lab Market Volume (K Unit), by Country 2024 & 2032
- Figure 5: North America Cannabis Testing Lab Market Revenue Share (%), by Country 2024 & 2032
- Figure 6: North America Cannabis Testing Lab Market Volume Share (%), by Country 2024 & 2032
- Figure 7: Europe Cannabis Testing Lab Market Revenue (Million), by Country 2024 & 2032
- Figure 8: Europe Cannabis Testing Lab Market Volume (K Unit), by Country 2024 & 2032
- Figure 9: Europe Cannabis Testing Lab Market Revenue Share (%), by Country 2024 & 2032
- Figure 10: Europe Cannabis Testing Lab Market Volume Share (%), by Country 2024 & 2032
- Figure 11: Asia Pacific Cannabis Testing Lab Market Revenue (Million), by Country 2024 & 2032
- Figure 12: Asia Pacific Cannabis Testing Lab Market Volume (K Unit), by Country 2024 & 2032
- Figure 13: Asia Pacific Cannabis Testing Lab Market Revenue Share (%), by Country 2024 & 2032
- Figure 14: Asia Pacific Cannabis Testing Lab Market Volume Share (%), by Country 2024 & 2032
- Figure 15: Middle East and Africa Cannabis Testing Lab Market Revenue (Million), by Country 2024 & 2032
- Figure 16: Middle East and Africa Cannabis Testing Lab Market Volume (K Unit), by Country 2024 & 2032
- Figure 17: Middle East and Africa Cannabis Testing Lab Market Revenue Share (%), by Country 2024 & 2032
- Figure 18: Middle East and Africa Cannabis Testing Lab Market Volume Share (%), by Country 2024 & 2032
- Figure 19: South America Cannabis Testing Lab Market Revenue (Million), by Country 2024 & 2032
- Figure 20: South America Cannabis Testing Lab Market Volume (K Unit), by Country 2024 & 2032
- Figure 21: South America Cannabis Testing Lab Market Revenue Share (%), by Country 2024 & 2032
- Figure 22: South America Cannabis Testing Lab Market Volume Share (%), by Country 2024 & 2032
- Figure 23: North America Cannabis Testing Lab Market Revenue (Million), by Product and Software/Service 2024 & 2032
- Figure 24: North America Cannabis Testing Lab Market Volume (K Unit), by Product and Software/Service 2024 & 2032
- Figure 25: North America Cannabis Testing Lab Market Revenue Share (%), by Product and Software/Service 2024 & 2032
- Figure 26: North America Cannabis Testing Lab Market Volume Share (%), by Product and Software/Service 2024 & 2032
- Figure 27: North America Cannabis Testing Lab Market Revenue (Million), by Type 2024 & 2032
- Figure 28: North America Cannabis Testing Lab Market Volume (K Unit), by Type 2024 & 2032
- Figure 29: North America Cannabis Testing Lab Market Revenue Share (%), by Type 2024 & 2032
- Figure 30: North America Cannabis Testing Lab Market Volume Share (%), by Type 2024 & 2032
- Figure 31: North America Cannabis Testing Lab Market Revenue (Million), by End User 2024 & 2032
- Figure 32: North America Cannabis Testing Lab Market Volume (K Unit), by End User 2024 & 2032
- Figure 33: North America Cannabis Testing Lab Market Revenue Share (%), by End User 2024 & 2032
- Figure 34: North America Cannabis Testing Lab Market Volume Share (%), by End User 2024 & 2032
- Figure 35: North America Cannabis Testing Lab Market Revenue (Million), by Country 2024 & 2032
- Figure 36: North America Cannabis Testing Lab Market Volume (K Unit), by Country 2024 & 2032
- Figure 37: North America Cannabis Testing Lab Market Revenue Share (%), by Country 2024 & 2032
- Figure 38: North America Cannabis Testing Lab Market Volume Share (%), by Country 2024 & 2032
- Figure 39: Europe Cannabis Testing Lab Market Revenue (Million), by Product and Software/Service 2024 & 2032
- Figure 40: Europe Cannabis Testing Lab Market Volume (K Unit), by Product and Software/Service 2024 & 2032
- Figure 41: Europe Cannabis Testing Lab Market Revenue Share (%), by Product and Software/Service 2024 & 2032
- Figure 42: Europe Cannabis Testing Lab Market Volume Share (%), by Product and Software/Service 2024 & 2032
- Figure 43: Europe Cannabis Testing Lab Market Revenue (Million), by Type 2024 & 2032
- Figure 44: Europe Cannabis Testing Lab Market Volume (K Unit), by Type 2024 & 2032
- Figure 45: Europe Cannabis Testing Lab Market Revenue Share (%), by Type 2024 & 2032
- Figure 46: Europe Cannabis Testing Lab Market Volume Share (%), by Type 2024 & 2032
- Figure 47: Europe Cannabis Testing Lab Market Revenue (Million), by End User 2024 & 2032
- Figure 48: Europe Cannabis Testing Lab Market Volume (K Unit), by End User 2024 & 2032
- Figure 49: Europe Cannabis Testing Lab Market Revenue Share (%), by End User 2024 & 2032
- Figure 50: Europe Cannabis Testing Lab Market Volume Share (%), by End User 2024 & 2032
- Figure 51: Europe Cannabis Testing Lab Market Revenue (Million), by Country 2024 & 2032
- Figure 52: Europe Cannabis Testing Lab Market Volume (K Unit), by Country 2024 & 2032
- Figure 53: Europe Cannabis Testing Lab Market Revenue Share (%), by Country 2024 & 2032
- Figure 54: Europe Cannabis Testing Lab Market Volume Share (%), by Country 2024 & 2032
- Figure 55: Asia Pacific Cannabis Testing Lab Market Revenue (Million), by Product and Software/Service 2024 & 2032
- Figure 56: Asia Pacific Cannabis Testing Lab Market Volume (K Unit), by Product and Software/Service 2024 & 2032
- Figure 57: Asia Pacific Cannabis Testing Lab Market Revenue Share (%), by Product and Software/Service 2024 & 2032
- Figure 58: Asia Pacific Cannabis Testing Lab Market Volume Share (%), by Product and Software/Service 2024 & 2032
- Figure 59: Asia Pacific Cannabis Testing Lab Market Revenue (Million), by Type 2024 & 2032
- Figure 60: Asia Pacific Cannabis Testing Lab Market Volume (K Unit), by Type 2024 & 2032
- Figure 61: Asia Pacific Cannabis Testing Lab Market Revenue Share (%), by Type 2024 & 2032
- Figure 62: Asia Pacific Cannabis Testing Lab Market Volume Share (%), by Type 2024 & 2032
- Figure 63: Asia Pacific Cannabis Testing Lab Market Revenue (Million), by End User 2024 & 2032
- Figure 64: Asia Pacific Cannabis Testing Lab Market Volume (K Unit), by End User 2024 & 2032
- Figure 65: Asia Pacific Cannabis Testing Lab Market Revenue Share (%), by End User 2024 & 2032
- Figure 66: Asia Pacific Cannabis Testing Lab Market Volume Share (%), by End User 2024 & 2032
- Figure 67: Asia Pacific Cannabis Testing Lab Market Revenue (Million), by Country 2024 & 2032
- Figure 68: Asia Pacific Cannabis Testing Lab Market Volume (K Unit), by Country 2024 & 2032
- Figure 69: Asia Pacific Cannabis Testing Lab Market Revenue Share (%), by Country 2024 & 2032
- Figure 70: Asia Pacific Cannabis Testing Lab Market Volume Share (%), by Country 2024 & 2032
- Figure 71: Middle East and Africa Cannabis Testing Lab Market Revenue (Million), by Product and Software/Service 2024 & 2032
- Figure 72: Middle East and Africa Cannabis Testing Lab Market Volume (K Unit), by Product and Software/Service 2024 & 2032
- Figure 73: Middle East and Africa Cannabis Testing Lab Market Revenue Share (%), by Product and Software/Service 2024 & 2032
- Figure 74: Middle East and Africa Cannabis Testing Lab Market Volume Share (%), by Product and Software/Service 2024 & 2032
- Figure 75: Middle East and Africa Cannabis Testing Lab Market Revenue (Million), by Type 2024 & 2032
- Figure 76: Middle East and Africa Cannabis Testing Lab Market Volume (K Unit), by Type 2024 & 2032
- Figure 77: Middle East and Africa Cannabis Testing Lab Market Revenue Share (%), by Type 2024 & 2032
- Figure 78: Middle East and Africa Cannabis Testing Lab Market Volume Share (%), by Type 2024 & 2032
- Figure 79: Middle East and Africa Cannabis Testing Lab Market Revenue (Million), by End User 2024 & 2032
- Figure 80: Middle East and Africa Cannabis Testing Lab Market Volume (K Unit), by End User 2024 & 2032
- Figure 81: Middle East and Africa Cannabis Testing Lab Market Revenue Share (%), by End User 2024 & 2032
- Figure 82: Middle East and Africa Cannabis Testing Lab Market Volume Share (%), by End User 2024 & 2032
- Figure 83: Middle East and Africa Cannabis Testing Lab Market Revenue (Million), by Country 2024 & 2032
- Figure 84: Middle East and Africa Cannabis Testing Lab Market Volume (K Unit), by Country 2024 & 2032
- Figure 85: Middle East and Africa Cannabis Testing Lab Market Revenue Share (%), by Country 2024 & 2032
- Figure 86: Middle East and Africa Cannabis Testing Lab Market Volume Share (%), by Country 2024 & 2032
- Figure 87: South America Cannabis Testing Lab Market Revenue (Million), by Product and Software/Service 2024 & 2032
- Figure 88: South America Cannabis Testing Lab Market Volume (K Unit), by Product and Software/Service 2024 & 2032
- Figure 89: South America Cannabis Testing Lab Market Revenue Share (%), by Product and Software/Service 2024 & 2032
- Figure 90: South America Cannabis Testing Lab Market Volume Share (%), by Product and Software/Service 2024 & 2032
- Figure 91: South America Cannabis Testing Lab Market Revenue (Million), by Type 2024 & 2032
- Figure 92: South America Cannabis Testing Lab Market Volume (K Unit), by Type 2024 & 2032
- Figure 93: South America Cannabis Testing Lab Market Revenue Share (%), by Type 2024 & 2032
- Figure 94: South America Cannabis Testing Lab Market Volume Share (%), by Type 2024 & 2032
- Figure 95: South America Cannabis Testing Lab Market Revenue (Million), by End User 2024 & 2032
- Figure 96: South America Cannabis Testing Lab Market Volume (K Unit), by End User 2024 & 2032
- Figure 97: South America Cannabis Testing Lab Market Revenue Share (%), by End User 2024 & 2032
- Figure 98: South America Cannabis Testing Lab Market Volume Share (%), by End User 2024 & 2032
- Figure 99: South America Cannabis Testing Lab Market Revenue (Million), by Country 2024 & 2032
- Figure 100: South America Cannabis Testing Lab Market Volume (K Unit), by Country 2024 & 2032
- Figure 101: South America Cannabis Testing Lab Market Revenue Share (%), by Country 2024 & 2032
- Figure 102: South America Cannabis Testing Lab Market Volume Share (%), by Country 2024 & 2032
List of Tables
- Table 1: Global Cannabis Testing Lab Market Revenue Million Forecast, by Region 2019 & 2032
- Table 2: Global Cannabis Testing Lab Market Volume K Unit Forecast, by Region 2019 & 2032
- Table 3: Global Cannabis Testing Lab Market Revenue Million Forecast, by Product and Software/Service 2019 & 2032
- Table 4: Global Cannabis Testing Lab Market Volume K Unit Forecast, by Product and Software/Service 2019 & 2032
- Table 5: Global Cannabis Testing Lab Market Revenue Million Forecast, by Type 2019 & 2032
- Table 6: Global Cannabis Testing Lab Market Volume K Unit Forecast, by Type 2019 & 2032
- Table 7: Global Cannabis Testing Lab Market Revenue Million Forecast, by End User 2019 & 2032
- Table 8: Global Cannabis Testing Lab Market Volume K Unit Forecast, by End User 2019 & 2032
- Table 9: Global Cannabis Testing Lab Market Revenue Million Forecast, by Region 2019 & 2032
- Table 10: Global Cannabis Testing Lab Market Volume K Unit Forecast, by Region 2019 & 2032
- Table 11: Global Cannabis Testing Lab Market Revenue Million Forecast, by Country 2019 & 2032
- Table 12: Global Cannabis Testing Lab Market Volume K Unit Forecast, by Country 2019 & 2032
- Table 13: United States Cannabis Testing Lab Market Revenue (Million) Forecast, by Application 2019 & 2032
- Table 14: United States Cannabis Testing Lab Market Volume (K Unit) Forecast, by Application 2019 & 2032
- Table 15: Canada Cannabis Testing Lab Market Revenue (Million) Forecast, by Application 2019 & 2032
- Table 16: Canada Cannabis Testing Lab Market Volume (K Unit) Forecast, by Application 2019 & 2032
- Table 17: Mexico Cannabis Testing Lab Market Revenue (Million) Forecast, by Application 2019 & 2032
- Table 18: Mexico Cannabis Testing Lab Market Volume (K Unit) Forecast, by Application 2019 & 2032
- Table 19: Global Cannabis Testing Lab Market Revenue Million Forecast, by Country 2019 & 2032
- Table 20: Global Cannabis Testing Lab Market Volume K Unit Forecast, by Country 2019 & 2032
- Table 21: Germany Cannabis Testing Lab Market Revenue (Million) Forecast, by Application 2019 & 2032
- Table 22: Germany Cannabis Testing Lab Market Volume (K Unit) Forecast, by Application 2019 & 2032
- Table 23: United Kingdom Cannabis Testing Lab Market Revenue (Million) Forecast, by Application 2019 & 2032
- Table 24: United Kingdom Cannabis Testing Lab Market Volume (K Unit) Forecast, by Application 2019 & 2032
- Table 25: France Cannabis Testing Lab Market Revenue (Million) Forecast, by Application 2019 & 2032
- Table 26: France Cannabis Testing Lab Market Volume (K Unit) Forecast, by Application 2019 & 2032
- Table 27: Italy Cannabis Testing Lab Market Revenue (Million) Forecast, by Application 2019 & 2032
- Table 28: Italy Cannabis Testing Lab Market Volume (K Unit) Forecast, by Application 2019 & 2032
- Table 29: Spain Cannabis Testing Lab Market Revenue (Million) Forecast, by Application 2019 & 2032
- Table 30: Spain Cannabis Testing Lab Market Volume (K Unit) Forecast, by Application 2019 & 2032
- Table 31: Rest of Europe Cannabis Testing Lab Market Revenue (Million) Forecast, by Application 2019 & 2032
- Table 32: Rest of Europe Cannabis Testing Lab Market Volume (K Unit) Forecast, by Application 2019 & 2032
- Table 33: Global Cannabis Testing Lab Market Revenue Million Forecast, by Country 2019 & 2032
- Table 34: Global Cannabis Testing Lab Market Volume K Unit Forecast, by Country 2019 & 2032
- Table 35: China Cannabis Testing Lab Market Revenue (Million) Forecast, by Application 2019 & 2032
- Table 36: China Cannabis Testing Lab Market Volume (K Unit) Forecast, by Application 2019 & 2032
- Table 37: Japan Cannabis Testing Lab Market Revenue (Million) Forecast, by Application 2019 & 2032
- Table 38: Japan Cannabis Testing Lab Market Volume (K Unit) Forecast, by Application 2019 & 2032
- Table 39: India Cannabis Testing Lab Market Revenue (Million) Forecast, by Application 2019 & 2032
- Table 40: India Cannabis Testing Lab Market Volume (K Unit) Forecast, by Application 2019 & 2032
- Table 41: Australia Cannabis Testing Lab Market Revenue (Million) Forecast, by Application 2019 & 2032
- Table 42: Australia Cannabis Testing Lab Market Volume (K Unit) Forecast, by Application 2019 & 2032
- Table 43: South Korea Cannabis Testing Lab Market Revenue (Million) Forecast, by Application 2019 & 2032
- Table 44: South Korea Cannabis Testing Lab Market Volume (K Unit) Forecast, by Application 2019 & 2032
- Table 45: Rest of Asia Pacific Cannabis Testing Lab Market Revenue (Million) Forecast, by Application 2019 & 2032
- Table 46: Rest of Asia Pacific Cannabis Testing Lab Market Volume (K Unit) Forecast, by Application 2019 & 2032
- Table 47: Global Cannabis Testing Lab Market Revenue Million Forecast, by Country 2019 & 2032
- Table 48: Global Cannabis Testing Lab Market Volume K Unit Forecast, by Country 2019 & 2032
- Table 49: GCC Cannabis Testing Lab Market Revenue (Million) Forecast, by Application 2019 & 2032
- Table 50: GCC Cannabis Testing Lab Market Volume (K Unit) Forecast, by Application 2019 & 2032
- Table 51: South Africa Cannabis Testing Lab Market Revenue (Million) Forecast, by Application 2019 & 2032
- Table 52: South Africa Cannabis Testing Lab Market Volume (K Unit) Forecast, by Application 2019 & 2032
- Table 53: Rest of Middle East and Africa Cannabis Testing Lab Market Revenue (Million) Forecast, by Application 2019 & 2032
- Table 54: Rest of Middle East and Africa Cannabis Testing Lab Market Volume (K Unit) Forecast, by Application 2019 & 2032
- Table 55: Global Cannabis Testing Lab Market Revenue Million Forecast, by Country 2019 & 2032
- Table 56: Global Cannabis Testing Lab Market Volume K Unit Forecast, by Country 2019 & 2032
- Table 57: Brazil Cannabis Testing Lab Market Revenue (Million) Forecast, by Application 2019 & 2032
- Table 58: Brazil Cannabis Testing Lab Market Volume (K Unit) Forecast, by Application 2019 & 2032
- Table 59: Argentina Cannabis Testing Lab Market Revenue (Million) Forecast, by Application 2019 & 2032
- Table 60: Argentina Cannabis Testing Lab Market Volume (K Unit) Forecast, by Application 2019 & 2032
- Table 61: Rest of South America Cannabis Testing Lab Market Revenue (Million) Forecast, by Application 2019 & 2032
- Table 62: Rest of South America Cannabis Testing Lab Market Volume (K Unit) Forecast, by Application 2019 & 2032
- Table 63: Global Cannabis Testing Lab Market Revenue Million Forecast, by Product and Software/Service 2019 & 2032
- Table 64: Global Cannabis Testing Lab Market Volume K Unit Forecast, by Product and Software/Service 2019 & 2032
- Table 65: Global Cannabis Testing Lab Market Revenue Million Forecast, by Type 2019 & 2032
- Table 66: Global Cannabis Testing Lab Market Volume K Unit Forecast, by Type 2019 & 2032
- Table 67: Global Cannabis Testing Lab Market Revenue Million Forecast, by End User 2019 & 2032
- Table 68: Global Cannabis Testing Lab Market Volume K Unit Forecast, by End User 2019 & 2032
- Table 69: Global Cannabis Testing Lab Market Revenue Million Forecast, by Country 2019 & 2032
- Table 70: Global Cannabis Testing Lab Market Volume K Unit Forecast, by Country 2019 & 2032
- Table 71: United States Cannabis Testing Lab Market Revenue (Million) Forecast, by Application 2019 & 2032
- Table 72: United States Cannabis Testing Lab Market Volume (K Unit) Forecast, by Application 2019 & 2032
- Table 73: Canada Cannabis Testing Lab Market Revenue (Million) Forecast, by Application 2019 & 2032
- Table 74: Canada Cannabis Testing Lab Market Volume (K Unit) Forecast, by Application 2019 & 2032
- Table 75: Mexico Cannabis Testing Lab Market Revenue (Million) Forecast, by Application 2019 & 2032
- Table 76: Mexico Cannabis Testing Lab Market Volume (K Unit) Forecast, by Application 2019 & 2032
- Table 77: Global Cannabis Testing Lab Market Revenue Million Forecast, by Product and Software/Service 2019 & 2032
- Table 78: Global Cannabis Testing Lab Market Volume K Unit Forecast, by Product and Software/Service 2019 & 2032
- Table 79: Global Cannabis Testing Lab Market Revenue Million Forecast, by Type 2019 & 2032
- Table 80: Global Cannabis Testing Lab Market Volume K Unit Forecast, by Type 2019 & 2032
- Table 81: Global Cannabis Testing Lab Market Revenue Million Forecast, by End User 2019 & 2032
- Table 82: Global Cannabis Testing Lab Market Volume K Unit Forecast, by End User 2019 & 2032
- Table 83: Global Cannabis Testing Lab Market Revenue Million Forecast, by Country 2019 & 2032
- Table 84: Global Cannabis Testing Lab Market Volume K Unit Forecast, by Country 2019 & 2032
- Table 85: Germany Cannabis Testing Lab Market Revenue (Million) Forecast, by Application 2019 & 2032
- Table 86: Germany Cannabis Testing Lab Market Volume (K Unit) Forecast, by Application 2019 & 2032
- Table 87: United Kingdom Cannabis Testing Lab Market Revenue (Million) Forecast, by Application 2019 & 2032
- Table 88: United Kingdom Cannabis Testing Lab Market Volume (K Unit) Forecast, by Application 2019 & 2032
- Table 89: France Cannabis Testing Lab Market Revenue (Million) Forecast, by Application 2019 & 2032
- Table 90: France Cannabis Testing Lab Market Volume (K Unit) Forecast, by Application 2019 & 2032
- Table 91: Italy Cannabis Testing Lab Market Revenue (Million) Forecast, by Application 2019 & 2032
- Table 92: Italy Cannabis Testing Lab Market Volume (K Unit) Forecast, by Application 2019 & 2032
- Table 93: Spain Cannabis Testing Lab Market Revenue (Million) Forecast, by Application 2019 & 2032
- Table 94: Spain Cannabis Testing Lab Market Volume (K Unit) Forecast, by Application 2019 & 2032
- Table 95: Rest of Europe Cannabis Testing Lab Market Revenue (Million) Forecast, by Application 2019 & 2032
- Table 96: Rest of Europe Cannabis Testing Lab Market Volume (K Unit) Forecast, by Application 2019 & 2032
- Table 97: Global Cannabis Testing Lab Market Revenue Million Forecast, by Product and Software/Service 2019 & 2032
- Table 98: Global Cannabis Testing Lab Market Volume K Unit Forecast, by Product and Software/Service 2019 & 2032
- Table 99: Global Cannabis Testing Lab Market Revenue Million Forecast, by Type 2019 & 2032
- Table 100: Global Cannabis Testing Lab Market Volume K Unit Forecast, by Type 2019 & 2032
- Table 101: Global Cannabis Testing Lab Market Revenue Million Forecast, by End User 2019 & 2032
- Table 102: Global Cannabis Testing Lab Market Volume K Unit Forecast, by End User 2019 & 2032
- Table 103: Global Cannabis Testing Lab Market Revenue Million Forecast, by Country 2019 & 2032
- Table 104: Global Cannabis Testing Lab Market Volume K Unit Forecast, by Country 2019 & 2032
- Table 105: China Cannabis Testing Lab Market Revenue (Million) Forecast, by Application 2019 & 2032
- Table 106: China Cannabis Testing Lab Market Volume (K Unit) Forecast, by Application 2019 & 2032
- Table 107: Japan Cannabis Testing Lab Market Revenue (Million) Forecast, by Application 2019 & 2032
- Table 108: Japan Cannabis Testing Lab Market Volume (K Unit) Forecast, by Application 2019 & 2032
- Table 109: India Cannabis Testing Lab Market Revenue (Million) Forecast, by Application 2019 & 2032
- Table 110: India Cannabis Testing Lab Market Volume (K Unit) Forecast, by Application 2019 & 2032
- Table 111: Australia Cannabis Testing Lab Market Revenue (Million) Forecast, by Application 2019 & 2032
- Table 112: Australia Cannabis Testing Lab Market Volume (K Unit) Forecast, by Application 2019 & 2032
- Table 113: South Korea Cannabis Testing Lab Market Revenue (Million) Forecast, by Application 2019 & 2032
- Table 114: South Korea Cannabis Testing Lab Market Volume (K Unit) Forecast, by Application 2019 & 2032
- Table 115: Rest of Asia Pacific Cannabis Testing Lab Market Revenue (Million) Forecast, by Application 2019 & 2032
- Table 116: Rest of Asia Pacific Cannabis Testing Lab Market Volume (K Unit) Forecast, by Application 2019 & 2032
- Table 117: Global Cannabis Testing Lab Market Revenue Million Forecast, by Product and Software/Service 2019 & 2032
- Table 118: Global Cannabis Testing Lab Market Volume K Unit Forecast, by Product and Software/Service 2019 & 2032
- Table 119: Global Cannabis Testing Lab Market Revenue Million Forecast, by Type 2019 & 2032
- Table 120: Global Cannabis Testing Lab Market Volume K Unit Forecast, by Type 2019 & 2032
- Table 121: Global Cannabis Testing Lab Market Revenue Million Forecast, by End User 2019 & 2032
- Table 122: Global Cannabis Testing Lab Market Volume K Unit Forecast, by End User 2019 & 2032
- Table 123: Global Cannabis Testing Lab Market Revenue Million Forecast, by Country 2019 & 2032
- Table 124: Global Cannabis Testing Lab Market Volume K Unit Forecast, by Country 2019 & 2032
- Table 125: GCC Cannabis Testing Lab Market Revenue (Million) Forecast, by Application 2019 & 2032
- Table 126: GCC Cannabis Testing Lab Market Volume (K Unit) Forecast, by Application 2019 & 2032
- Table 127: South Africa Cannabis Testing Lab Market Revenue (Million) Forecast, by Application 2019 & 2032
- Table 128: South Africa Cannabis Testing Lab Market Volume (K Unit) Forecast, by Application 2019 & 2032
- Table 129: Rest of Middle East and Africa Cannabis Testing Lab Market Revenue (Million) Forecast, by Application 2019 & 2032
- Table 130: Rest of Middle East and Africa Cannabis Testing Lab Market Volume (K Unit) Forecast, by Application 2019 & 2032
- Table 131: Global Cannabis Testing Lab Market Revenue Million Forecast, by Product and Software/Service 2019 & 2032
- Table 132: Global Cannabis Testing Lab Market Volume K Unit Forecast, by Product and Software/Service 2019 & 2032
- Table 133: Global Cannabis Testing Lab Market Revenue Million Forecast, by Type 2019 & 2032
- Table 134: Global Cannabis Testing Lab Market Volume K Unit Forecast, by Type 2019 & 2032
- Table 135: Global Cannabis Testing Lab Market Revenue Million Forecast, by End User 2019 & 2032
- Table 136: Global Cannabis Testing Lab Market Volume K Unit Forecast, by End User 2019 & 2032
- Table 137: Global Cannabis Testing Lab Market Revenue Million Forecast, by Country 2019 & 2032
- Table 138: Global Cannabis Testing Lab Market Volume K Unit Forecast, by Country 2019 & 2032
- Table 139: Brazil Cannabis Testing Lab Market Revenue (Million) Forecast, by Application 2019 & 2032
- Table 140: Brazil Cannabis Testing Lab Market Volume (K Unit) Forecast, by Application 2019 & 2032
- Table 141: Argentina Cannabis Testing Lab Market Revenue (Million) Forecast, by Application 2019 & 2032
- Table 142: Argentina Cannabis Testing Lab Market Volume (K Unit) Forecast, by Application 2019 & 2032
- Table 143: Rest of South America Cannabis Testing Lab Market Revenue (Million) Forecast, by Application 2019 & 2032
- Table 144: Rest of South America Cannabis Testing Lab Market Volume (K Unit) Forecast, by Application 2019 & 2032
Frequently Asked Questions
1. What is the projected Compound Annual Growth Rate (CAGR) of the Cannabis Testing Lab Market?
The projected CAGR is approximately 13.12%.
2. Which companies are prominent players in the Cannabis Testing Lab Market?
Key companies in the market include Shimadzu Scientific Instruments, Merck KGaA (Sigma Aldrich), Restek Corporation, Digipath Inc, Steep Hill Halent Laboratories Inc, Sartorius AG, Danaher Corporation, Agilent Technologies Inc, AB Sciex Pte Ltd, Accelerated Technology Laboratories Inc, Pharmlabs LLC, PerkinElmer Inc.
3. What are the main segments of the Cannabis Testing Lab Market?
The market segments include Product and Software/Service, Type, End User.
4. Can you provide details about the market size?
The market size is estimated to be USD 1.11 Million as of 2022.
5. What are some drivers contributing to market growth?
Legalization of Cannabis for Various Medical Purposes; Increasing Awareness regarding Cannabis for Treating Neurological Diseases.
6. What are the notable trends driving market growth?
The Analytical Instruments Segment is Dominating the Market.
7. Are there any restraints impacting market growth?
High Cost of Analytical Instruments.
8. Can you provide examples of recent developments in the market?
In August 2022, Florida-based cannabis testing company ACS Laboratory launched its own national hemp compliance testing panel. The panel aids in testing hemp samples for 18 cannabinoids, 105 pesticides, 24 heavy metals, 55 potential residual solvents, 17 different microorganisms, and every required mycotoxin to detect parts per billion, as well as for moisture content, water activity, and terpenes.
9. What pricing options are available for accessing the report?
Pricing options include single-user, multi-user, and enterprise licenses priced at USD 4750, USD 5250, and USD 8750 respectively.
10. Is the market size provided in terms of value or volume?
The market size is provided in terms of value, measured in Million and volume, measured in K Unit.
11. Are there any specific market keywords associated with the report?
Yes, the market keyword associated with the report is "Cannabis Testing Lab Market," which aids in identifying and referencing the specific market segment covered.
12. How do I determine which pricing option suits my needs best?
The pricing options vary based on user requirements and access needs. Individual users may opt for single-user licenses, while businesses requiring broader access may choose multi-user or enterprise licenses for cost-effective access to the report.
13. Are there any additional resources or data provided in the Cannabis Testing Lab Market report?
While the report offers comprehensive insights, it's advisable to review the specific contents or supplementary materials provided to ascertain if additional resources or data are available.
14. How can I stay updated on further developments or reports in the Cannabis Testing Lab Market?
To stay informed about further developments, trends, and reports in the Cannabis Testing Lab Market, consider subscribing to industry newsletters, following relevant companies and organizations, or regularly checking reputable industry news sources and publications.
Methodology
Step 1 - Identification of Relevant Samples Size from Population Database


Step 2 - Approaches for Defining Global Market Size (Value, Volume* & Price*)

Note*: In applicable scenarios
Step 3 - Data Sources
Primary Research
- Web Analytics
- Survey Reports
- Research Institute
- Latest Research Reports
- Opinion Leaders
Secondary Research
- Annual Reports
- White Paper
- Latest Press Release
- Industry Association
- Paid Database
- Investor Presentations

Step 4 - Data Triangulation
Involves using different sources of information in order to increase the validity of a study
These sources are likely to be stakeholders in a program - participants, other researchers, program staff, other community members, and so on.
Then we put all data in single framework & apply various statistical tools to find out the dynamic on the market.
During the analysis stage, feedback from the stakeholder groups would be compared to determine areas of agreement as well as areas of divergence


