
Key Insights
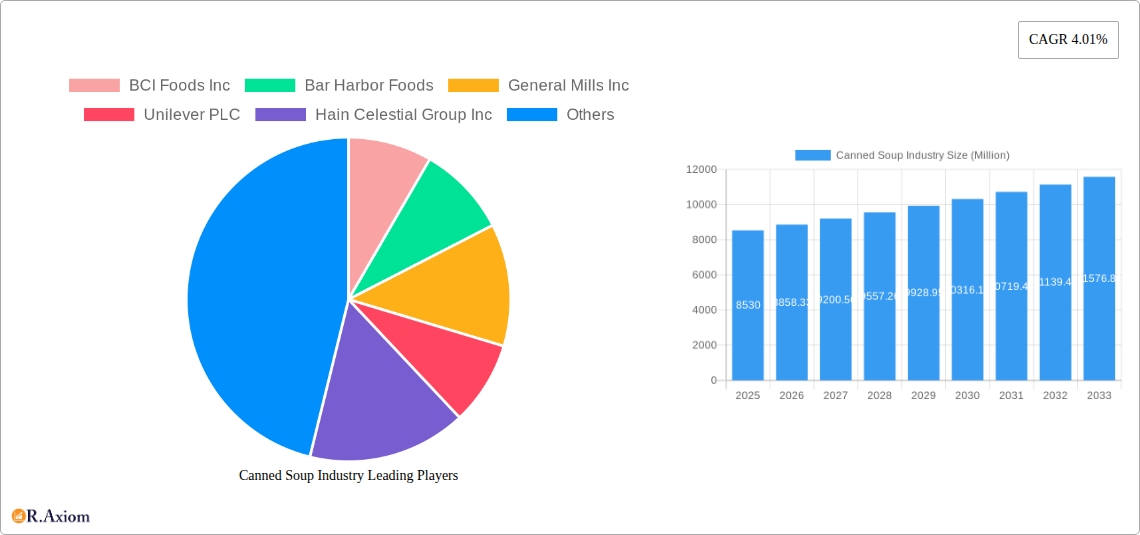
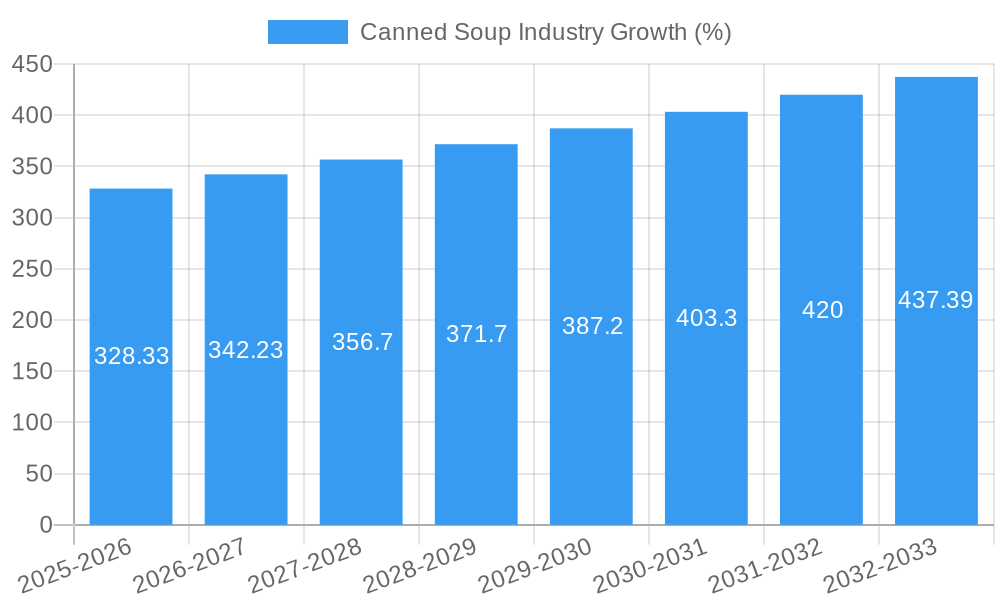
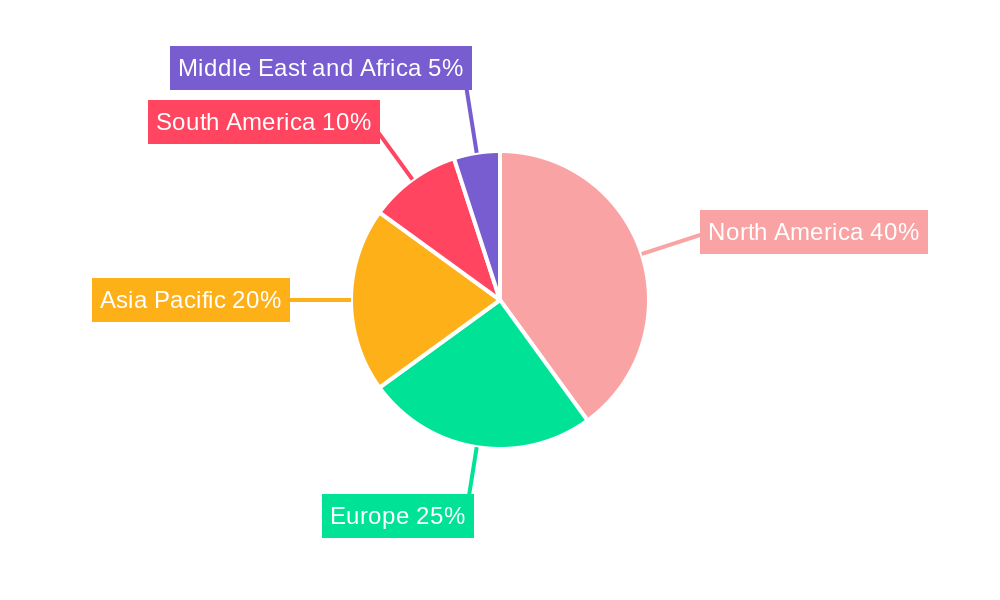
The global canned soup market, valued at $8.53 billion in 2025, is projected to experience steady growth, exhibiting a compound annual growth rate (CAGR) of 4.01% from 2025 to 2033. This growth is fueled by several key market drivers. The increasing demand for convenient and ready-to-eat meals, particularly among busy professionals and single-person households, significantly contributes to market expansion. Furthermore, the rising popularity of organic and health-conscious food choices is driving the growth of the organic canned soup segment. Strategic product diversification by major players, incorporating innovative flavors and healthier ingredients, also contributes positively. However, the market faces certain restraints. Fluctuations in raw material prices, particularly agricultural produce, can impact production costs and profitability. Additionally, growing consumer preference for fresh and homemade soups presents a challenge to the canned soup industry. The market is segmented by type (condensed, ready-to-eat), category (conventional, organic), and distribution channel (supermarkets/hypermarkets, convenience/grocery stores, food specialty stores, online retail stores, and other channels). North America currently holds a significant market share due to high per capita consumption and established distribution networks. However, Asia Pacific is expected to witness considerable growth in the forecast period, driven by increasing urbanization and rising disposable incomes. Key players like Campbell Soup Company, General Mills, and Unilever are actively engaged in expanding their product lines and geographical reach to maintain a competitive edge.
The competitive landscape is characterized by established multinational corporations and smaller regional players. The presence of both large and small companies fosters innovation and caters to a diverse range of consumer preferences. The industry is witnessing a gradual shift towards healthier options, with an emphasis on reducing sodium content and utilizing natural ingredients. The online retail channel is experiencing substantial growth, offering convenient purchasing options and wider product availability. Future market growth will largely depend on successful adaptation to evolving consumer trends, including a heightened focus on sustainability and ethical sourcing practices. Companies investing in research and development to create innovative and healthier canned soup varieties are expected to thrive in the coming years. Continued expansion into emerging markets, especially in developing economies with growing populations, presents substantial opportunities for growth.
Canned Soup Industry: A Comprehensive Market Analysis (2019-2033)
This comprehensive report provides a detailed analysis of the canned soup industry, covering market size, segmentation, key players, trends, and future outlook. The study period spans from 2019 to 2033, with 2025 serving as the base and estimated year. This report is crucial for industry stakeholders, investors, and businesses seeking to understand and navigate this dynamic market.
Study Period: 2019-2033 Base Year: 2025 Estimated Year: 2025 Forecast Period: 2025-2033 Historical Period: 2019-2024
Canned Soup Industry Market Concentration & Innovation
The canned soup industry exhibits a moderately concentrated market structure, with a few dominant players holding significant market share. Companies like Campbell Soup Company, The Kraft Heinz Company, and Unilever PLC command a considerable portion, while other players compete for the remaining market share. Innovation within the sector is driven by consumer demand for healthier options, such as organic and plant-based soups, and convenience factors. Regulatory frameworks focusing on food safety and labeling practices significantly influence product development. Furthermore, the industry is seeing increasing competition from fresh and frozen soup alternatives, while M&A activities are not prominent, with an estimated total deal value of xx Million in the last 5 years. Key metrics include:
- Market Concentration: xx% held by top 5 players (2024)
- M&A Deal Value (2019-2024): xx Million
- Innovation Focus: Organic, plant-based, and convenient formats.
Canned Soup Industry Industry Trends & Insights
The canned soup market is witnessing a complex interplay of factors impacting its growth trajectory. The overall market exhibits a Compound Annual Growth Rate (CAGR) of xx% during the forecast period (2025-2033). Market penetration of organic and ready-to-eat segments is steadily increasing. Consumer preferences are shifting toward healthier, more convenient, and diverse flavor profiles. Technological advancements such as improved packaging and processing techniques are streamlining production and enhancing product shelf life. Competitive dynamics are characterized by both price competition and product differentiation strategies, with established players leveraging their brand recognition while newer entrants focus on niche markets and innovative product offerings.
Dominant Markets & Segments in Canned Soup Industry
The North American region holds the largest market share in the canned soup industry, driven by high consumption rates and established distribution networks. Within the segment breakdown:
- Type: Ready-to-eat soup is experiencing faster growth than condensed soup, reflecting changing consumer preferences.
- Category: The organic segment is witnessing rapid growth, driven by increasing health consciousness.
- Distribution Channel: Supermarkets/hypermarkets remain the dominant distribution channel, however, online retail stores are showing significant growth potential.
Key Drivers for North American Dominance:
- Strong established retail infrastructure.
- High disposable income.
- Established brand presence of major players.
Canned Soup Industry Product Developments
Recent product innovations highlight a strong trend towards healthier and more diverse product offerings. The introduction of plant-based soups, organic options, and unique flavor profiles addresses evolving consumer demands. Technological advancements focus on optimizing packaging for extended shelf life and enhanced convenience, exemplified by ready-to-eat options. These innovations aim to enhance product appeal, capture new market segments, and compete effectively in a dynamic market.
Report Scope & Segmentation Analysis
This report segments the canned soup market based on Type (Condensed, Ready-to-Eat), Category (Conventional, Organic), and Distribution Channel (Supermarkets/Hypermarkets, Convenience/Grocery Stores, Food Specialty Stores, Online Retail Stores, Other Distribution Channels). Each segment's growth projections, market sizes, and competitive dynamics are analyzed in detail, providing a holistic view of the market landscape. The market size for each segment is projected to reach xx Million by 2033.
Key Drivers of Canned Soup Industry Growth
Several factors fuel the canned soup industry's growth. These include:
- Convenience: Canned soups offer a quick and easy meal option.
- Affordability: Canned soups are a cost-effective food choice for many consumers.
- Shelf Life: Long shelf life makes them ideal for pantry stocking.
- Technological Advancements: Enhanced packaging and processing techniques.
- Healthier Options: Growing demand for organic and plant-based options.
Challenges in the Canned Soup Industry Sector
The industry faces several challenges, including:
- Competition from Fresh/Frozen Soups: Healthier alternatives are gaining popularity.
- Supply Chain Disruptions: Global events can impact ingredient sourcing and production.
- Changing Consumer Preferences: Demand for organic and specialized flavors necessitates adaptation.
- Increased Input Costs: Rising prices for raw materials impact profit margins.
Emerging Opportunities in Canned Soup Industry
Significant opportunities exist within the industry:
- Expansion into New Markets: Developing regions offer untapped potential.
- Product Diversification: Innovative flavors, functional ingredients, and premium options.
- Sustainability Initiatives: Eco-friendly packaging and sustainable sourcing.
- E-commerce Growth: Leveraging online channels for sales expansion.
Leading Players in the Canned Soup Industry Market
- BCI Foods Inc
- Bar Harbor Foods
- General Mills Inc
- Unilever PLC
- Hain Celestial Group Inc
- F Whitlock & Sons
- The Kraft Heinz Company
- Baxters Food Group Limited
- Amy's Kitchen Inc
- Campbell Soup Company
- Sprague Foods Ltd
Key Developments in Canned Soup Industry Industry
- January 2023: Campbell Soup Company launched Chunky Ghost pepper chicken noodle soup.
- January 2023: Heinz UK launched plant-based canned soups (Creamy Tomato Soup and Beanz & Sausages).
- April 2023: F Whitlock & Sons launched a new range of canned soups with three unique flavors (peri-peri chicken, Moroccan spiced carrot and lentil soup, and Louisiana-style tomato, capsicum, and corn gumbo).
Strategic Outlook for Canned Soup Industry Market
The canned soup market presents significant growth potential, driven by ongoing innovation, expanding consumer base, and the continued importance of convenience foods. Focusing on healthier ingredients, diverse flavors, and convenient packaging will be critical for success. Furthermore, leveraging e-commerce channels and expanding into new geographic markets will offer further opportunities for market penetration and revenue growth. The market is expected to see a steady increase in value, reaching an estimated xx Million by 2033.
Canned Soup Industry Segmentation
-
1. Type
- 1.1. Condensed
- 1.2. Ready-to-Eat
-
2. Category
- 2.1. Conventional
- 2.2. Organic
-
3. Distribution Channel
- 3.1. Supermarkets/Hypermarkets
- 3.2. Convenience/Grocery Stores
- 3.3. Food Specialty Stores
- 3.4. Online Retail Stores
- 3.5. Other Distribution Channels
Canned Soup Industry Segmentation By Geography
-
1. North America
- 1.1. United States
- 1.2. Canada
- 1.3. Mexico
- 1.4. Rest of North America
-
2. Europe
- 2.1. Spain
- 2.2. United Kingdom
- 2.3. Germany
- 2.4. France
- 2.5. Italy
- 2.6. Russia
- 2.7. Rest of Europe
-
3. Asia Pacific
- 3.1. China
- 3.2. Japan
- 3.3. India
- 3.4. Australia
- 3.5. Rest of Asia Pacific
-
4. South America
- 4.1. Brazil
- 4.2. Argentina
- 4.3. Rest of South America
-
5. Middle East and Africa
- 5.1. South Africa
- 5.2. United Arab Emirates
- 5.3. Rest of Middle East and Africa
Canned Soup Industry REPORT HIGHLIGHTS
| Aspects | Details |
|---|---|
| Study Period | 2019-2033 |
| Base Year | 2024 |
| Estimated Year | 2025 |
| Forecast Period | 2025-2033 |
| Historical Period | 2019-2024 |
| Growth Rate | CAGR of 4.01% from 2019-2033 |
| Segmentation |
|
Table of Contents
- 1. Introduction
- 1.1. Research Scope
- 1.2. Market Segmentation
- 1.3. Research Methodology
- 1.4. Definitions and Assumptions
- 2. Executive Summary
- 2.1. Introduction
- 3. Market Dynamics
- 3.1. Introduction
- 3.2. Market Drivers
- 3.2.1. Increasing Expenditure on Convenience Food Products; The Growing Trend of Vegan Food Products Drives the Market of Plant-based Canned Soup Market
- 3.3. Market Restrains
- 3.3.1. Food additives present in Canned Soup products can hinder the market growth
- 3.4. Market Trends
- 3.4.1. Rise in Spending on Convenience Products
- 4. Market Factor Analysis
- 4.1. Porters Five Forces
- 4.2. Supply/Value Chain
- 4.3. PESTEL analysis
- 4.4. Market Entropy
- 4.5. Patent/Trademark Analysis
- 5. Global Canned Soup Industry Analysis, Insights and Forecast, 2019-2031
- 5.1. Market Analysis, Insights and Forecast - by Type
- 5.1.1. Condensed
- 5.1.2. Ready-to-Eat
- 5.2. Market Analysis, Insights and Forecast - by Category
- 5.2.1. Conventional
- 5.2.2. Organic
- 5.3. Market Analysis, Insights and Forecast - by Distribution Channel
- 5.3.1. Supermarkets/Hypermarkets
- 5.3.2. Convenience/Grocery Stores
- 5.3.3. Food Specialty Stores
- 5.3.4. Online Retail Stores
- 5.3.5. Other Distribution Channels
- 5.4. Market Analysis, Insights and Forecast - by Region
- 5.4.1. North America
- 5.4.2. Europe
- 5.4.3. Asia Pacific
- 5.4.4. South America
- 5.4.5. Middle East and Africa
- 5.1. Market Analysis, Insights and Forecast - by Type
- 6. North America Canned Soup Industry Analysis, Insights and Forecast, 2019-2031
- 6.1. Market Analysis, Insights and Forecast - by Type
- 6.1.1. Condensed
- 6.1.2. Ready-to-Eat
- 6.2. Market Analysis, Insights and Forecast - by Category
- 6.2.1. Conventional
- 6.2.2. Organic
- 6.3. Market Analysis, Insights and Forecast - by Distribution Channel
- 6.3.1. Supermarkets/Hypermarkets
- 6.3.2. Convenience/Grocery Stores
- 6.3.3. Food Specialty Stores
- 6.3.4. Online Retail Stores
- 6.3.5. Other Distribution Channels
- 6.1. Market Analysis, Insights and Forecast - by Type
- 7. Europe Canned Soup Industry Analysis, Insights and Forecast, 2019-2031
- 7.1. Market Analysis, Insights and Forecast - by Type
- 7.1.1. Condensed
- 7.1.2. Ready-to-Eat
- 7.2. Market Analysis, Insights and Forecast - by Category
- 7.2.1. Conventional
- 7.2.2. Organic
- 7.3. Market Analysis, Insights and Forecast - by Distribution Channel
- 7.3.1. Supermarkets/Hypermarkets
- 7.3.2. Convenience/Grocery Stores
- 7.3.3. Food Specialty Stores
- 7.3.4. Online Retail Stores
- 7.3.5. Other Distribution Channels
- 7.1. Market Analysis, Insights and Forecast - by Type
- 8. Asia Pacific Canned Soup Industry Analysis, Insights and Forecast, 2019-2031
- 8.1. Market Analysis, Insights and Forecast - by Type
- 8.1.1. Condensed
- 8.1.2. Ready-to-Eat
- 8.2. Market Analysis, Insights and Forecast - by Category
- 8.2.1. Conventional
- 8.2.2. Organic
- 8.3. Market Analysis, Insights and Forecast - by Distribution Channel
- 8.3.1. Supermarkets/Hypermarkets
- 8.3.2. Convenience/Grocery Stores
- 8.3.3. Food Specialty Stores
- 8.3.4. Online Retail Stores
- 8.3.5. Other Distribution Channels
- 8.1. Market Analysis, Insights and Forecast - by Type
- 9. South America Canned Soup Industry Analysis, Insights and Forecast, 2019-2031
- 9.1. Market Analysis, Insights and Forecast - by Type
- 9.1.1. Condensed
- 9.1.2. Ready-to-Eat
- 9.2. Market Analysis, Insights and Forecast - by Category
- 9.2.1. Conventional
- 9.2.2. Organic
- 9.3. Market Analysis, Insights and Forecast - by Distribution Channel
- 9.3.1. Supermarkets/Hypermarkets
- 9.3.2. Convenience/Grocery Stores
- 9.3.3. Food Specialty Stores
- 9.3.4. Online Retail Stores
- 9.3.5. Other Distribution Channels
- 9.1. Market Analysis, Insights and Forecast - by Type
- 10. Middle East and Africa Canned Soup Industry Analysis, Insights and Forecast, 2019-2031
- 10.1. Market Analysis, Insights and Forecast - by Type
- 10.1.1. Condensed
- 10.1.2. Ready-to-Eat
- 10.2. Market Analysis, Insights and Forecast - by Category
- 10.2.1. Conventional
- 10.2.2. Organic
- 10.3. Market Analysis, Insights and Forecast - by Distribution Channel
- 10.3.1. Supermarkets/Hypermarkets
- 10.3.2. Convenience/Grocery Stores
- 10.3.3. Food Specialty Stores
- 10.3.4. Online Retail Stores
- 10.3.5. Other Distribution Channels
- 10.1. Market Analysis, Insights and Forecast - by Type
- 11. North America Canned Soup Industry Analysis, Insights and Forecast, 2019-2031
- 11.1. Market Analysis, Insights and Forecast - By Country/Sub-region
- 11.1.1 United States
- 11.1.2 Canada
- 11.1.3 Mexico
- 11.1.4 Rest of North America
- 12. Europe Canned Soup Industry Analysis, Insights and Forecast, 2019-2031
- 12.1. Market Analysis, Insights and Forecast - By Country/Sub-region
- 12.1.1 Spain
- 12.1.2 United Kingdom
- 12.1.3 Germany
- 12.1.4 France
- 12.1.5 Italy
- 12.1.6 Russia
- 12.1.7 Rest of Europe
- 13. Asia Pacific Canned Soup Industry Analysis, Insights and Forecast, 2019-2031
- 13.1. Market Analysis, Insights and Forecast - By Country/Sub-region
- 13.1.1 China
- 13.1.2 Japan
- 13.1.3 India
- 13.1.4 Australia
- 13.1.5 Rest of Asia Pacific
- 14. South America Canned Soup Industry Analysis, Insights and Forecast, 2019-2031
- 14.1. Market Analysis, Insights and Forecast - By Country/Sub-region
- 14.1.1 Brazil
- 14.1.2 Argentina
- 14.1.3 Rest of South America
- 15. Middle East and Africa Canned Soup Industry Analysis, Insights and Forecast, 2019-2031
- 15.1. Market Analysis, Insights and Forecast - By Country/Sub-region
- 15.1.1 South Africa
- 15.1.2 United Arab Emirates
- 15.1.3 Rest of Middle East and Africa
- 16. Competitive Analysis
- 16.1. Global Market Share Analysis 2024
- 16.2. Company Profiles
- 16.2.1 BCI Foods Inc
- 16.2.1.1. Overview
- 16.2.1.2. Products
- 16.2.1.3. SWOT Analysis
- 16.2.1.4. Recent Developments
- 16.2.1.5. Financials (Based on Availability)
- 16.2.2 Bar Harbor Foods
- 16.2.2.1. Overview
- 16.2.2.2. Products
- 16.2.2.3. SWOT Analysis
- 16.2.2.4. Recent Developments
- 16.2.2.5. Financials (Based on Availability)
- 16.2.3 General Mills Inc
- 16.2.3.1. Overview
- 16.2.3.2. Products
- 16.2.3.3. SWOT Analysis
- 16.2.3.4. Recent Developments
- 16.2.3.5. Financials (Based on Availability)
- 16.2.4 Unilever PLC
- 16.2.4.1. Overview
- 16.2.4.2. Products
- 16.2.4.3. SWOT Analysis
- 16.2.4.4. Recent Developments
- 16.2.4.5. Financials (Based on Availability)
- 16.2.5 Hain Celestial Group Inc
- 16.2.5.1. Overview
- 16.2.5.2. Products
- 16.2.5.3. SWOT Analysis
- 16.2.5.4. Recent Developments
- 16.2.5.5. Financials (Based on Availability)
- 16.2.6 F Whitlock & Sons
- 16.2.6.1. Overview
- 16.2.6.2. Products
- 16.2.6.3. SWOT Analysis
- 16.2.6.4. Recent Developments
- 16.2.6.5. Financials (Based on Availability)
- 16.2.7 The Kraft Heinz Company
- 16.2.7.1. Overview
- 16.2.7.2. Products
- 16.2.7.3. SWOT Analysis
- 16.2.7.4. Recent Developments
- 16.2.7.5. Financials (Based on Availability)
- 16.2.8 Baxters Food Group Limited
- 16.2.8.1. Overview
- 16.2.8.2. Products
- 16.2.8.3. SWOT Analysis
- 16.2.8.4. Recent Developments
- 16.2.8.5. Financials (Based on Availability)
- 16.2.9 Amy's Kitchen Inc
- 16.2.9.1. Overview
- 16.2.9.2. Products
- 16.2.9.3. SWOT Analysis
- 16.2.9.4. Recent Developments
- 16.2.9.5. Financials (Based on Availability)
- 16.2.10 Campbell Soup Company
- 16.2.10.1. Overview
- 16.2.10.2. Products
- 16.2.10.3. SWOT Analysis
- 16.2.10.4. Recent Developments
- 16.2.10.5. Financials (Based on Availability)
- 16.2.11 Sprague Foods Ltd
- 16.2.11.1. Overview
- 16.2.11.2. Products
- 16.2.11.3. SWOT Analysis
- 16.2.11.4. Recent Developments
- 16.2.11.5. Financials (Based on Availability)
- 16.2.1 BCI Foods Inc
List of Figures
- Figure 1: Global Canned Soup Industry Revenue Breakdown (Million, %) by Region 2024 & 2032
- Figure 2: North America Canned Soup Industry Revenue (Million), by Country 2024 & 2032
- Figure 3: North America Canned Soup Industry Revenue Share (%), by Country 2024 & 2032
- Figure 4: Europe Canned Soup Industry Revenue (Million), by Country 2024 & 2032
- Figure 5: Europe Canned Soup Industry Revenue Share (%), by Country 2024 & 2032
- Figure 6: Asia Pacific Canned Soup Industry Revenue (Million), by Country 2024 & 2032
- Figure 7: Asia Pacific Canned Soup Industry Revenue Share (%), by Country 2024 & 2032
- Figure 8: South America Canned Soup Industry Revenue (Million), by Country 2024 & 2032
- Figure 9: South America Canned Soup Industry Revenue Share (%), by Country 2024 & 2032
- Figure 10: Middle East and Africa Canned Soup Industry Revenue (Million), by Country 2024 & 2032
- Figure 11: Middle East and Africa Canned Soup Industry Revenue Share (%), by Country 2024 & 2032
- Figure 12: North America Canned Soup Industry Revenue (Million), by Type 2024 & 2032
- Figure 13: North America Canned Soup Industry Revenue Share (%), by Type 2024 & 2032
- Figure 14: North America Canned Soup Industry Revenue (Million), by Category 2024 & 2032
- Figure 15: North America Canned Soup Industry Revenue Share (%), by Category 2024 & 2032
- Figure 16: North America Canned Soup Industry Revenue (Million), by Distribution Channel 2024 & 2032
- Figure 17: North America Canned Soup Industry Revenue Share (%), by Distribution Channel 2024 & 2032
- Figure 18: North America Canned Soup Industry Revenue (Million), by Country 2024 & 2032
- Figure 19: North America Canned Soup Industry Revenue Share (%), by Country 2024 & 2032
- Figure 20: Europe Canned Soup Industry Revenue (Million), by Type 2024 & 2032
- Figure 21: Europe Canned Soup Industry Revenue Share (%), by Type 2024 & 2032
- Figure 22: Europe Canned Soup Industry Revenue (Million), by Category 2024 & 2032
- Figure 23: Europe Canned Soup Industry Revenue Share (%), by Category 2024 & 2032
- Figure 24: Europe Canned Soup Industry Revenue (Million), by Distribution Channel 2024 & 2032
- Figure 25: Europe Canned Soup Industry Revenue Share (%), by Distribution Channel 2024 & 2032
- Figure 26: Europe Canned Soup Industry Revenue (Million), by Country 2024 & 2032
- Figure 27: Europe Canned Soup Industry Revenue Share (%), by Country 2024 & 2032
- Figure 28: Asia Pacific Canned Soup Industry Revenue (Million), by Type 2024 & 2032
- Figure 29: Asia Pacific Canned Soup Industry Revenue Share (%), by Type 2024 & 2032
- Figure 30: Asia Pacific Canned Soup Industry Revenue (Million), by Category 2024 & 2032
- Figure 31: Asia Pacific Canned Soup Industry Revenue Share (%), by Category 2024 & 2032
- Figure 32: Asia Pacific Canned Soup Industry Revenue (Million), by Distribution Channel 2024 & 2032
- Figure 33: Asia Pacific Canned Soup Industry Revenue Share (%), by Distribution Channel 2024 & 2032
- Figure 34: Asia Pacific Canned Soup Industry Revenue (Million), by Country 2024 & 2032
- Figure 35: Asia Pacific Canned Soup Industry Revenue Share (%), by Country 2024 & 2032
- Figure 36: South America Canned Soup Industry Revenue (Million), by Type 2024 & 2032
- Figure 37: South America Canned Soup Industry Revenue Share (%), by Type 2024 & 2032
- Figure 38: South America Canned Soup Industry Revenue (Million), by Category 2024 & 2032
- Figure 39: South America Canned Soup Industry Revenue Share (%), by Category 2024 & 2032
- Figure 40: South America Canned Soup Industry Revenue (Million), by Distribution Channel 2024 & 2032
- Figure 41: South America Canned Soup Industry Revenue Share (%), by Distribution Channel 2024 & 2032
- Figure 42: South America Canned Soup Industry Revenue (Million), by Country 2024 & 2032
- Figure 43: South America Canned Soup Industry Revenue Share (%), by Country 2024 & 2032
- Figure 44: Middle East and Africa Canned Soup Industry Revenue (Million), by Type 2024 & 2032
- Figure 45: Middle East and Africa Canned Soup Industry Revenue Share (%), by Type 2024 & 2032
- Figure 46: Middle East and Africa Canned Soup Industry Revenue (Million), by Category 2024 & 2032
- Figure 47: Middle East and Africa Canned Soup Industry Revenue Share (%), by Category 2024 & 2032
- Figure 48: Middle East and Africa Canned Soup Industry Revenue (Million), by Distribution Channel 2024 & 2032
- Figure 49: Middle East and Africa Canned Soup Industry Revenue Share (%), by Distribution Channel 2024 & 2032
- Figure 50: Middle East and Africa Canned Soup Industry Revenue (Million), by Country 2024 & 2032
- Figure 51: Middle East and Africa Canned Soup Industry Revenue Share (%), by Country 2024 & 2032
List of Tables
- Table 1: Global Canned Soup Industry Revenue Million Forecast, by Region 2019 & 2032
- Table 2: Global Canned Soup Industry Revenue Million Forecast, by Type 2019 & 2032
- Table 3: Global Canned Soup Industry Revenue Million Forecast, by Category 2019 & 2032
- Table 4: Global Canned Soup Industry Revenue Million Forecast, by Distribution Channel 2019 & 2032
- Table 5: Global Canned Soup Industry Revenue Million Forecast, by Region 2019 & 2032
- Table 6: Global Canned Soup Industry Revenue Million Forecast, by Country 2019 & 2032
- Table 7: United States Canned Soup Industry Revenue (Million) Forecast, by Application 2019 & 2032
- Table 8: Canada Canned Soup Industry Revenue (Million) Forecast, by Application 2019 & 2032
- Table 9: Mexico Canned Soup Industry Revenue (Million) Forecast, by Application 2019 & 2032
- Table 10: Rest of North America Canned Soup Industry Revenue (Million) Forecast, by Application 2019 & 2032
- Table 11: Global Canned Soup Industry Revenue Million Forecast, by Country 2019 & 2032
- Table 12: Spain Canned Soup Industry Revenue (Million) Forecast, by Application 2019 & 2032
- Table 13: United Kingdom Canned Soup Industry Revenue (Million) Forecast, by Application 2019 & 2032
- Table 14: Germany Canned Soup Industry Revenue (Million) Forecast, by Application 2019 & 2032
- Table 15: France Canned Soup Industry Revenue (Million) Forecast, by Application 2019 & 2032
- Table 16: Italy Canned Soup Industry Revenue (Million) Forecast, by Application 2019 & 2032
- Table 17: Russia Canned Soup Industry Revenue (Million) Forecast, by Application 2019 & 2032
- Table 18: Rest of Europe Canned Soup Industry Revenue (Million) Forecast, by Application 2019 & 2032
- Table 19: Global Canned Soup Industry Revenue Million Forecast, by Country 2019 & 2032
- Table 20: China Canned Soup Industry Revenue (Million) Forecast, by Application 2019 & 2032
- Table 21: Japan Canned Soup Industry Revenue (Million) Forecast, by Application 2019 & 2032
- Table 22: India Canned Soup Industry Revenue (Million) Forecast, by Application 2019 & 2032
- Table 23: Australia Canned Soup Industry Revenue (Million) Forecast, by Application 2019 & 2032
- Table 24: Rest of Asia Pacific Canned Soup Industry Revenue (Million) Forecast, by Application 2019 & 2032
- Table 25: Global Canned Soup Industry Revenue Million Forecast, by Country 2019 & 2032
- Table 26: Brazil Canned Soup Industry Revenue (Million) Forecast, by Application 2019 & 2032
- Table 27: Argentina Canned Soup Industry Revenue (Million) Forecast, by Application 2019 & 2032
- Table 28: Rest of South America Canned Soup Industry Revenue (Million) Forecast, by Application 2019 & 2032
- Table 29: Global Canned Soup Industry Revenue Million Forecast, by Country 2019 & 2032
- Table 30: South Africa Canned Soup Industry Revenue (Million) Forecast, by Application 2019 & 2032
- Table 31: United Arab Emirates Canned Soup Industry Revenue (Million) Forecast, by Application 2019 & 2032
- Table 32: Rest of Middle East and Africa Canned Soup Industry Revenue (Million) Forecast, by Application 2019 & 2032
- Table 33: Global Canned Soup Industry Revenue Million Forecast, by Type 2019 & 2032
- Table 34: Global Canned Soup Industry Revenue Million Forecast, by Category 2019 & 2032
- Table 35: Global Canned Soup Industry Revenue Million Forecast, by Distribution Channel 2019 & 2032
- Table 36: Global Canned Soup Industry Revenue Million Forecast, by Country 2019 & 2032
- Table 37: United States Canned Soup Industry Revenue (Million) Forecast, by Application 2019 & 2032
- Table 38: Canada Canned Soup Industry Revenue (Million) Forecast, by Application 2019 & 2032
- Table 39: Mexico Canned Soup Industry Revenue (Million) Forecast, by Application 2019 & 2032
- Table 40: Rest of North America Canned Soup Industry Revenue (Million) Forecast, by Application 2019 & 2032
- Table 41: Global Canned Soup Industry Revenue Million Forecast, by Type 2019 & 2032
- Table 42: Global Canned Soup Industry Revenue Million Forecast, by Category 2019 & 2032
- Table 43: Global Canned Soup Industry Revenue Million Forecast, by Distribution Channel 2019 & 2032
- Table 44: Global Canned Soup Industry Revenue Million Forecast, by Country 2019 & 2032
- Table 45: Spain Canned Soup Industry Revenue (Million) Forecast, by Application 2019 & 2032
- Table 46: United Kingdom Canned Soup Industry Revenue (Million) Forecast, by Application 2019 & 2032
- Table 47: Germany Canned Soup Industry Revenue (Million) Forecast, by Application 2019 & 2032
- Table 48: France Canned Soup Industry Revenue (Million) Forecast, by Application 2019 & 2032
- Table 49: Italy Canned Soup Industry Revenue (Million) Forecast, by Application 2019 & 2032
- Table 50: Russia Canned Soup Industry Revenue (Million) Forecast, by Application 2019 & 2032
- Table 51: Rest of Europe Canned Soup Industry Revenue (Million) Forecast, by Application 2019 & 2032
- Table 52: Global Canned Soup Industry Revenue Million Forecast, by Type 2019 & 2032
- Table 53: Global Canned Soup Industry Revenue Million Forecast, by Category 2019 & 2032
- Table 54: Global Canned Soup Industry Revenue Million Forecast, by Distribution Channel 2019 & 2032
- Table 55: Global Canned Soup Industry Revenue Million Forecast, by Country 2019 & 2032
- Table 56: China Canned Soup Industry Revenue (Million) Forecast, by Application 2019 & 2032
- Table 57: Japan Canned Soup Industry Revenue (Million) Forecast, by Application 2019 & 2032
- Table 58: India Canned Soup Industry Revenue (Million) Forecast, by Application 2019 & 2032
- Table 59: Australia Canned Soup Industry Revenue (Million) Forecast, by Application 2019 & 2032
- Table 60: Rest of Asia Pacific Canned Soup Industry Revenue (Million) Forecast, by Application 2019 & 2032
- Table 61: Global Canned Soup Industry Revenue Million Forecast, by Type 2019 & 2032
- Table 62: Global Canned Soup Industry Revenue Million Forecast, by Category 2019 & 2032
- Table 63: Global Canned Soup Industry Revenue Million Forecast, by Distribution Channel 2019 & 2032
- Table 64: Global Canned Soup Industry Revenue Million Forecast, by Country 2019 & 2032
- Table 65: Brazil Canned Soup Industry Revenue (Million) Forecast, by Application 2019 & 2032
- Table 66: Argentina Canned Soup Industry Revenue (Million) Forecast, by Application 2019 & 2032
- Table 67: Rest of South America Canned Soup Industry Revenue (Million) Forecast, by Application 2019 & 2032
- Table 68: Global Canned Soup Industry Revenue Million Forecast, by Type 2019 & 2032
- Table 69: Global Canned Soup Industry Revenue Million Forecast, by Category 2019 & 2032
- Table 70: Global Canned Soup Industry Revenue Million Forecast, by Distribution Channel 2019 & 2032
- Table 71: Global Canned Soup Industry Revenue Million Forecast, by Country 2019 & 2032
- Table 72: South Africa Canned Soup Industry Revenue (Million) Forecast, by Application 2019 & 2032
- Table 73: United Arab Emirates Canned Soup Industry Revenue (Million) Forecast, by Application 2019 & 2032
- Table 74: Rest of Middle East and Africa Canned Soup Industry Revenue (Million) Forecast, by Application 2019 & 2032
Frequently Asked Questions
1. What is the projected Compound Annual Growth Rate (CAGR) of the Canned Soup Industry?
The projected CAGR is approximately 4.01%.
2. Which companies are prominent players in the Canned Soup Industry?
Key companies in the market include BCI Foods Inc, Bar Harbor Foods, General Mills Inc, Unilever PLC, Hain Celestial Group Inc, F Whitlock & Sons, The Kraft Heinz Company, Baxters Food Group Limited, Amy's Kitchen Inc, Campbell Soup Company, Sprague Foods Ltd.
3. What are the main segments of the Canned Soup Industry?
The market segments include Type, Category, Distribution Channel.
4. Can you provide details about the market size?
The market size is estimated to be USD 8.53 Million as of 2022.
5. What are some drivers contributing to market growth?
Increasing Expenditure on Convenience Food Products; The Growing Trend of Vegan Food Products Drives the Market of Plant-based Canned Soup Market.
6. What are the notable trends driving market growth?
Rise in Spending on Convenience Products.
7. Are there any restraints impacting market growth?
Food additives present in Canned Soup products can hinder the market growth.
8. Can you provide examples of recent developments in the market?
April 2023: F Whitlock & Sons announced the launch of its new range of canned soups in three flavors. The launch includes new flavors such as peri-peri chicken, Moroccan spiced carrot and lentil soup, Louisiana-style tomato, capsicum, and corn gumbo. The company also claims that the range has no artificial colors, preservatives, or flavors.
9. What pricing options are available for accessing the report?
Pricing options include single-user, multi-user, and enterprise licenses priced at USD 4750, USD 5250, and USD 8750 respectively.
10. Is the market size provided in terms of value or volume?
The market size is provided in terms of value, measured in Million.
11. Are there any specific market keywords associated with the report?
Yes, the market keyword associated with the report is "Canned Soup Industry," which aids in identifying and referencing the specific market segment covered.
12. How do I determine which pricing option suits my needs best?
The pricing options vary based on user requirements and access needs. Individual users may opt for single-user licenses, while businesses requiring broader access may choose multi-user or enterprise licenses for cost-effective access to the report.
13. Are there any additional resources or data provided in the Canned Soup Industry report?
While the report offers comprehensive insights, it's advisable to review the specific contents or supplementary materials provided to ascertain if additional resources or data are available.
14. How can I stay updated on further developments or reports in the Canned Soup Industry?
To stay informed about further developments, trends, and reports in the Canned Soup Industry, consider subscribing to industry newsletters, following relevant companies and organizations, or regularly checking reputable industry news sources and publications.
Methodology
Step 1 - Identification of Relevant Samples Size from Population Database


Step 2 - Approaches for Defining Global Market Size (Value, Volume* & Price*)

Note*: In applicable scenarios
Step 3 - Data Sources
Primary Research
- Web Analytics
- Survey Reports
- Research Institute
- Latest Research Reports
- Opinion Leaders
Secondary Research
- Annual Reports
- White Paper
- Latest Press Release
- Industry Association
- Paid Database
- Investor Presentations

Step 4 - Data Triangulation
Involves using different sources of information in order to increase the validity of a study
These sources are likely to be stakeholders in a program - participants, other researchers, program staff, other community members, and so on.
Then we put all data in single framework & apply various statistical tools to find out the dynamic on the market.
During the analysis stage, feedback from the stakeholder groups would be compared to determine areas of agreement as well as areas of divergence


