

Key Insights
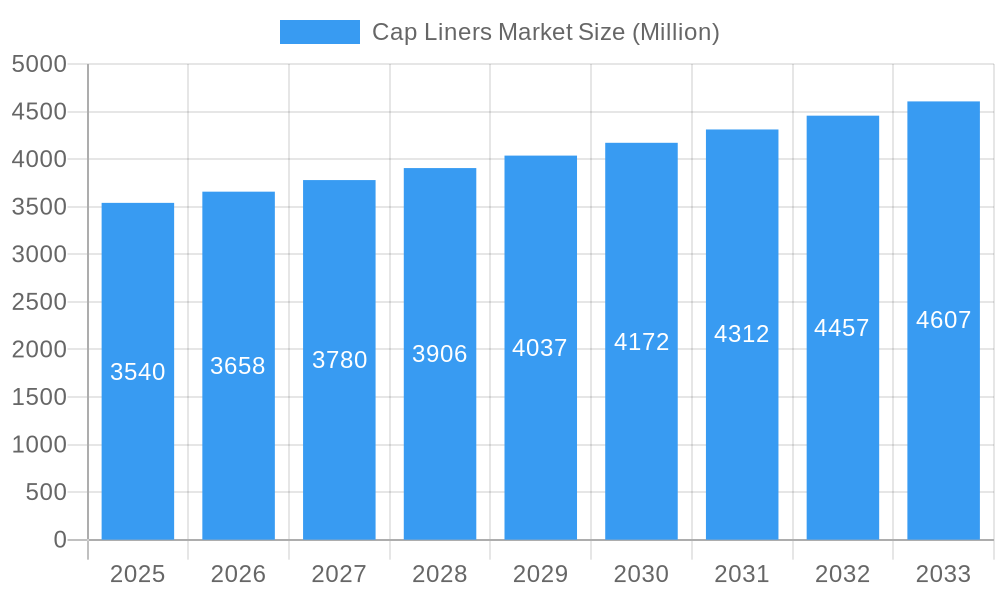
The global cap liners market, valued at approximately $3.54 billion in 2025, is projected to experience steady growth, driven by the expanding food and beverage, pharmaceutical, and personal care industries. A Compound Annual Growth Rate (CAGR) of 3.43% from 2025 to 2033 indicates a robust, albeit moderate, expansion. This growth is fueled by increasing consumer demand for convenient and tamper-evident packaging, coupled with a rising focus on product safety and hygiene across various sectors. The market's segmentation, though unspecified, likely includes material types (e.g., foam, paper, plastic), liner types (e.g., induction seals, heat seals), and application-based segments (e.g., bottles, jars, tubs). Key players like Meyer Seals GmbH and Tekni-Plex Inc. are leveraging innovation in material science and manufacturing to cater to evolving industry needs, while smaller regional players are focusing on niche applications. Competitive pressures are likely moderate, characterized by a mix of established multinational corporations and regional specialists. Potential restraints could include fluctuating raw material prices and the emergence of sustainable and eco-friendly alternatives to traditional cap liners.
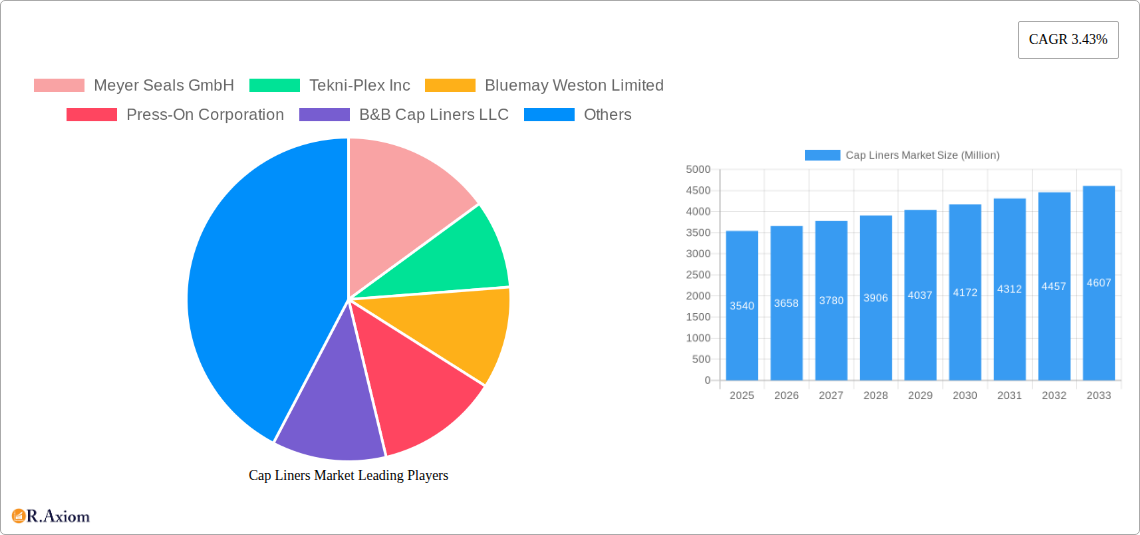
Cap Liners Market Market Size (In Billion)
The forecast for the cap liners market from 2025 to 2033 points to a continued, albeit gradual, expansion. Sustained growth in the food and beverage sector, particularly in developing economies, will be a primary driver. The pharmaceutical industry's stringent quality control measures and increasing demand for tamper-evident packaging will also contribute significantly. However, factors such as regulatory changes related to packaging materials and increasing consumer awareness of environmental impact will necessitate strategic adaptation by market players. The focus will likely shift towards developing sustainable and biodegradable cap liner materials while maintaining the functional properties required for effective sealing and product protection. This will necessitate substantial R&D investment and strategic partnerships across the value chain.
Cap Liners Market Company Market Share
This detailed report provides a comprehensive analysis of the global Cap Liners Market, covering market size, growth projections, competitive landscape, and key industry trends from 2019 to 2033. The report leverages extensive primary and secondary research to deliver actionable insights for industry stakeholders, including manufacturers, distributors, and investors. With a focus on market concentration, innovation, and emerging opportunities, this report is an essential resource for navigating the evolving Cap Liners Market landscape. The base year for this analysis is 2025, with the forecast period extending from 2025 to 2033. The historical period covered is 2019-2024. The total market size is estimated at xx Million in 2025 and projected to reach xx Million by 2033.
Cap Liners Market Concentration & Innovation
The Cap Liners Market exhibits a moderately concentrated structure, with a few major players holding significant market share. However, the presence of numerous smaller companies and regional players indicates a competitive landscape. Market share data for 2024 reveals that the top five players collectively hold approximately xx% of the market. Recent years have witnessed several mergers and acquisitions (M&A) activities, with deal values totaling approximately xx Million in the past five years. These activities aim to enhance market share, expand product portfolios, and access new technologies.
Key factors influencing market concentration and innovation:
- Technological Advancements: The industry is driven by continuous innovation in materials, designs, and manufacturing processes, leading to improved performance, sustainability, and cost-effectiveness.
- Regulatory Landscape: Regulations concerning food safety, environmental protection, and recyclability are shaping the market, influencing product development and manufacturing practices.
- Product Substitution: The market experiences some pressure from substitute products, primarily in niche applications. However, the unique properties of cap liners, such as their ability to maintain product integrity and extend shelf life, provide a strong competitive advantage.
- End-User Trends: Growing consumer demand for convenience, sustainability, and improved product safety are driving the adoption of advanced cap liners. For instance, the increasing demand for recyclable and compostable packaging is driving innovation in sustainable cap liner materials.
- M&A Activities: Consolidation through mergers and acquisitions is reshaping the competitive landscape, leading to increased market concentration and potentially higher barriers to entry.
Cap Liners Market Industry Trends & Insights
The global Cap Liners Market is experiencing robust and sustained growth, a trend projected to continue with a Compound Annual Growth Rate (CAGR) of approximately 6.5% to 7.5% during the forecast period (2025-2033). This upward trajectory is propelled by a dynamic interplay of escalating demand from diverse end-use industries, significant technological advancements, and evolving consumer expectations. The market's penetration is steadily increasing across pivotal sectors, including but not limited to food and beverages, pharmaceuticals, agrochemicals, and personal care products.
- Key Market Growth Accelerators: The escalating demand for securely packaged goods across a multitude of industries, coupled with the paramount importance of tamper-evident and leak-proof sealing solutions, are primary catalysts for market expansion. The rise in e-commerce and direct-to-consumer sales further amplifies the need for reliable packaging integrity.
- Transformative Technological Advancements: The market is witnessing a significant shift towards the development and adoption of sustainable and environmentally friendly cap liners. Innovations in biodegradable polymers, recycled materials, and reduced material usage are transforming manufacturing practices and offering eco-conscious alternatives.
- Evolving Consumer Demands: Modern consumers are increasingly vocal about their preference for sustainable packaging solutions. This growing environmental consciousness is compelling manufacturers to prioritize the development of eco-friendly cap liners, including those made from renewable resources and those that are easily recyclable. Furthermore, the emphasis on product safety and hygiene is intensifying the demand for advanced tamper-evident and hermetic sealing capabilities.
- Competitive Landscape Dynamics: The Cap Liners Market is characterized by intense competition, fostering an environment of continuous innovation. Leading players are strategically focusing on product differentiation through enhanced functionalities, superior material science, and cost-effectiveness. Strategic alliances, mergers, and acquisitions are also key strategies employed to broaden market reach and technological capabilities.
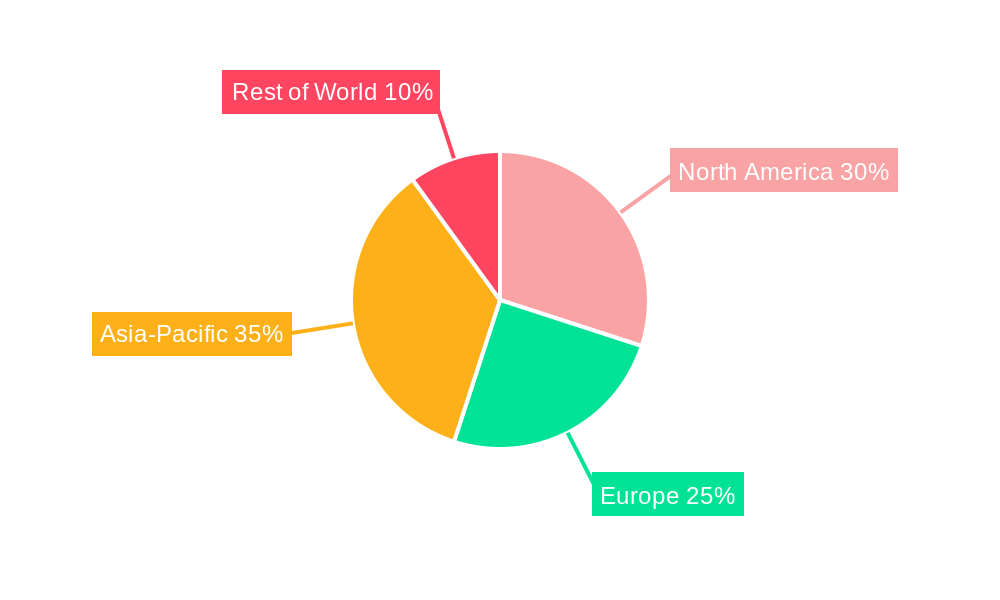
Dominant Markets & Segments in Cap Liners Market
North America currently commands the largest share of the global Cap Liners Market, closely followed by Europe and the Asia-Pacific region. This regional dominance is attributable to a confluence of factors, including high per capita consumption of packaged goods, a sophisticated and well-established manufacturing and distribution infrastructure, and a supportive regulatory framework that encourages innovation and product safety.
Key drivers underpinning market dominance in North America:
- Robust Economic Landscape: The region's strong economic growth and high disposable incomes translate into sustained and increasing demand for a wide array of packaged consumer goods, directly benefiting the cap liners market.
- Advanced Industrial Infrastructure: The presence of a mature and highly efficient manufacturing ecosystem, coupled with extensive logistics and distribution networks, facilitates seamless production, supply chain management, and timely delivery of cap liner solutions.
- Pro-Innovation Regulatory Environment: Favorable governmental policies and stringent quality control standards in North America encourage and support the adoption of cutting-edge cap liner technologies that enhance product safety, shelf life, and consumer trust.
Cap Liners Market Product Developments
Recent years have witnessed significant innovations in cap liner technology. The focus has been on developing sustainable materials, improved barrier properties, and enhanced functionality. These developments address growing consumer demand for eco-friendly packaging and improved product safety. For instance, the introduction of recyclable paper-based induction heat seal liners demonstrates the industry’s commitment to sustainability. Furthermore, new cap liners with enhanced chemical resistance cater to the demands of the chemical industry. The incorporation of intelligent features, such as sensors and indicators, is also gaining traction. This trend aims at enhancing product traceability and integrity.
Report Scope & Segmentation Analysis
This report segments the Cap Liners Market based on material type (e.g., foam, paper, plastic), application (e.g., food & beverage, pharmaceuticals, chemicals), and region (North America, Europe, Asia-Pacific, etc.). Each segment's market size, growth projections, and competitive dynamics are analyzed in detail. The report also provides a granular overview of the various types of cap liners available in the market such as induction heat seal liners, pressure-sensitive liners, and others. Specific forecasts are offered for each segment's future market size and potential growth.
Key Drivers of Cap Liners Market Growth
The Cap Liners Market is experiencing substantial growth fueled by a multifaceted set of drivers. The ever-increasing global demand for packaged goods, spurred by urbanization and evolving lifestyles, is a primary contributor. Simultaneously, rising disposable incomes in emerging economies are enabling greater consumer spending on packaged products. Continuous innovation in cap liner technologies, leading to improved functionality, enhanced barrier properties, and greater convenience, is also a significant growth factor. Furthermore, stringent international and national food safety regulations and hygiene standards are compelling manufacturers across various sectors to implement advanced cap liners to ensure product integrity and prevent contamination. The growing consumer awareness and demand for sustainable packaging solutions are also a powerful force, driving the development and adoption of eco-friendly and recyclable cap liner materials.
Challenges in the Cap Liners Market Sector
The Cap Liners Market faces several challenges, including the increasing cost of raw materials, fluctuations in the price of oil-based polymers, and intense competition from substitute products. Furthermore, strict environmental regulations are putting pressure on manufacturers to switch to sustainable materials, adding cost to the manufacturing process. Supply chain disruptions also pose a significant challenge, impacting the timely delivery of cap liners and causing fluctuations in prices. The need for constant product innovation to meet evolving consumer preferences and regulations adds to the operational complexity.
Emerging Opportunities in Cap Liners Market
Significant opportunities exist in the Cap Liners Market, particularly in the areas of sustainable and eco-friendly packaging solutions. The growing demand for recyclable and compostable cap liners presents a significant growth opportunity. Furthermore, the expansion into emerging markets with high population growth rates and increasing consumption of packaged goods provides fertile ground for market expansion. The development of advanced cap liners with enhanced functionality, such as intelligent sensors and tamper-evident features, also represents a significant opportunity.
Leading Players in the Cap Liners Market Market
- Meyer Seals GmbH
- Tekni-Plex Inc
- Bluemay Weston Limited
- Press-On Corporation
- B&B Cap Liners LLC
- Low's Cap Seal Sdn Bhd
- Tien Lik Cap Seal Sdn Bhd
- Captel International Pvt Ltd
- The Cary Company
- Selig UK Limited
- M F I Capliners
- *List Not Exhaustive
Key Developments in Cap Liners Market Industry
January 2024: TekniPlex launched a new series of recyclable, paper-based induction heat seal liners designed to seal dry pharma, nutrition, and food products. This launch reflects the growing demand for sustainable packaging solutions and positions TekniPlex as a leader in eco-friendly cap liner technology.
August 2024: W. L. Gore & Associates introduced two new 3FL (Full Face Foam Liner) cap liners engineered for chemical containers used in agricultural and household applications. These new liners offer superior chemical resistance and breathability, enhancing product performance and market competitiveness.
Strategic Outlook for Cap Liners Market Market
The Cap Liners Market is strategically positioned for sustained and accelerated growth in the coming years. This expansion will be largely propelled by the burgeoning demand from critical end-use sectors, particularly food & beverage, pharmaceutical, and personal care. The overarching emphasis on eco-friendly and sustainable product development will continue to be a paramount focus, driving significant innovation in material science, manufacturing processes, and product design. Key strategies for future market success will include proactive expansion into promising emerging markets with growing consumer bases and developing economies. Furthermore, the formation of strategic partnerships, joint ventures, and collaborations will be crucial for gaining market access, sharing technological expertise, and achieving economies of scale. The consistent development of novel technologies and the exploration of new applications for cap liners will undoubtedly ensure robust market expansion throughout the projected forecast period.
Cap Liners Market Segmentation
-
1. Material Type
- 1.1. Rubber
- 1.2. Metal
- 1.3. Plastic
- 1.4. Paper
-
2. Application
- 2.1. Bottles
- 2.2. Jars & Containers
-
3. Product Type
-
3.1. Heat-induction Cap Liners
- 3.1.1. One-piece
- 3.1.2. Two-piece
- 3.1.3. Halfmoon Liner
- 3.1.4. Other Heat-induction Cap Liners
- 3.2. Pressure Sensitive Liners
- 3.3. Other Product Types
-
3.1. Heat-induction Cap Liners
-
4. End-user Industry
- 4.1. Food
- 4.2. Beverage
- 4.3. Personal Care & Cosmetics
- 4.4. Chemicals & Fertilizers
- 4.5. Oil, Lubricants, and Grease
- 4.6. Home Care
- 4.7. Other End-user Industries
Cap Liners Market Segmentation By Geography
-
1. North America
- 1.1. United States
- 1.2. Canada
-
2. Europe
- 2.1. France
- 2.2. Germany
- 2.3. Spain
- 2.4. United Kingdom
- 2.5. Turkey
-
3. Asia Pacific
- 3.1. China
- 3.2. India
- 3.3. Japan
- 3.4. Thailand
- 3.5. Australia and New Zealand
-
4. Latin America
- 4.1. Brazil
- 4.2. Mexico
-
5. Middle East and Africa
- 5.1. United Arab Emirates
- 5.2. Saudi Arabia
- 5.3. Egypt
- 5.4. South Africa
Cap Liners Market Regional Market Share
Geographic Coverage of Cap Liners Market
Cap Liners Market REPORT HIGHLIGHTS
| Aspects | Details |
|---|---|
| Study Period | 2020-2034 |
| Base Year | 2025 |
| Estimated Year | 2026 |
| Forecast Period | 2026-2034 |
| Historical Period | 2020-2025 |
| Growth Rate | CAGR of 3.43% from 2020-2034 |
| Segmentation |
|
Table of Contents
- 1. Introduction
- 1.1. Research Scope
- 1.2. Market Segmentation
- 1.3. Research Objective
- 1.4. Definitions and Assumptions
- 2. Executive Summary
- 2.1. Market Snapshot
- 3. Market Dynamics
- 3.1. Market Drivers
- 3.2. Market Restrains
- 3.3. Market Trends
- 3.4. Market Opportunities
- 4. Market Factor Analysis
- 4.1. Porters Five Forces
- 4.1.1. Bargaining Power of Suppliers
- 4.1.2. Bargaining Power of Buyers
- 4.1.3. Threat of New Entrants
- 4.1.4. Threat of Substitutes
- 4.1.5. Competitive Rivalry
- 4.2. PESTEL analysis
- 4.3. BCG Analysis
- 4.3.1. Stars (High Growth, High Market Share)
- 4.3.2. Cash Cows (Low Growth, High Market Share)
- 4.3.3. Question Mark (High Growth, Low Market Share)
- 4.3.4. Dogs (Low Growth, Low Market Share)
- 4.4. Ansoff Matrix Analysis
- 4.5. Supply Chain Analysis
- 4.6. Regulatory Landscape
- 4.7. Current Market Potential and Opportunity Assessment (TAM–SAM–SOM Framework)
- 4.8. RAX Analyst Note
- 4.1. Porters Five Forces
- 5. Market Analysis, Insights and Forecast 2021-2033
- 5.1. Market Analysis, Insights and Forecast - by Material Type
- 5.1.1. Rubber
- 5.1.2. Metal
- 5.1.3. Plastic
- 5.1.4. Paper
- 5.2. Market Analysis, Insights and Forecast - by Application
- 5.2.1. Bottles
- 5.2.2. Jars & Containers
- 5.3. Market Analysis, Insights and Forecast - by Product Type
- 5.3.1. Heat-induction Cap Liners
- 5.3.1.1. One-piece
- 5.3.1.2. Two-piece
- 5.3.1.3. Halfmoon Liner
- 5.3.1.4. Other Heat-induction Cap Liners
- 5.3.2. Pressure Sensitive Liners
- 5.3.3. Other Product Types
- 5.3.1. Heat-induction Cap Liners
- 5.4. Market Analysis, Insights and Forecast - by End-user Industry
- 5.4.1. Food
- 5.4.2. Beverage
- 5.4.3. Personal Care & Cosmetics
- 5.4.4. Chemicals & Fertilizers
- 5.4.5. Oil, Lubricants, and Grease
- 5.4.6. Home Care
- 5.4.7. Other End-user Industries
- 5.5. Market Analysis, Insights and Forecast - by Region
- 5.5.1. North America
- 5.5.2. Europe
- 5.5.3. Asia Pacific
- 5.5.4. Latin America
- 5.5.5. Middle East and Africa
- 5.1. Market Analysis, Insights and Forecast - by Material Type
- 6. Global Cap Liners Market Analysis, Insights and Forecast, 2021-2033
- 6.1. Market Analysis, Insights and Forecast - by Material Type
- 6.1.1. Rubber
- 6.1.2. Metal
- 6.1.3. Plastic
- 6.1.4. Paper
- 6.2. Market Analysis, Insights and Forecast - by Application
- 6.2.1. Bottles
- 6.2.2. Jars & Containers
- 6.3. Market Analysis, Insights and Forecast - by Product Type
- 6.3.1. Heat-induction Cap Liners
- 6.3.1.1. One-piece
- 6.3.1.2. Two-piece
- 6.3.1.3. Halfmoon Liner
- 6.3.1.4. Other Heat-induction Cap Liners
- 6.3.2. Pressure Sensitive Liners
- 6.3.3. Other Product Types
- 6.3.1. Heat-induction Cap Liners
- 6.4. Market Analysis, Insights and Forecast - by End-user Industry
- 6.4.1. Food
- 6.4.2. Beverage
- 6.4.3. Personal Care & Cosmetics
- 6.4.4. Chemicals & Fertilizers
- 6.4.5. Oil, Lubricants, and Grease
- 6.4.6. Home Care
- 6.4.7. Other End-user Industries
- 6.1. Market Analysis, Insights and Forecast - by Material Type
- 7. North America Cap Liners Market Analysis, Insights and Forecast, 2020-2032
- 7.1. Market Analysis, Insights and Forecast - by Material Type
- 7.1.1. Rubber
- 7.1.2. Metal
- 7.1.3. Plastic
- 7.1.4. Paper
- 7.2. Market Analysis, Insights and Forecast - by Application
- 7.2.1. Bottles
- 7.2.2. Jars & Containers
- 7.3. Market Analysis, Insights and Forecast - by Product Type
- 7.3.1. Heat-induction Cap Liners
- 7.3.1.1. One-piece
- 7.3.1.2. Two-piece
- 7.3.1.3. Halfmoon Liner
- 7.3.1.4. Other Heat-induction Cap Liners
- 7.3.2. Pressure Sensitive Liners
- 7.3.3. Other Product Types
- 7.3.1. Heat-induction Cap Liners
- 7.4. Market Analysis, Insights and Forecast - by End-user Industry
- 7.4.1. Food
- 7.4.2. Beverage
- 7.4.3. Personal Care & Cosmetics
- 7.4.4. Chemicals & Fertilizers
- 7.4.5. Oil, Lubricants, and Grease
- 7.4.6. Home Care
- 7.4.7. Other End-user Industries
- 7.1. Market Analysis, Insights and Forecast - by Material Type
- 8. Europe Cap Liners Market Analysis, Insights and Forecast, 2020-2032
- 8.1. Market Analysis, Insights and Forecast - by Material Type
- 8.1.1. Rubber
- 8.1.2. Metal
- 8.1.3. Plastic
- 8.1.4. Paper
- 8.2. Market Analysis, Insights and Forecast - by Application
- 8.2.1. Bottles
- 8.2.2. Jars & Containers
- 8.3. Market Analysis, Insights and Forecast - by Product Type
- 8.3.1. Heat-induction Cap Liners
- 8.3.1.1. One-piece
- 8.3.1.2. Two-piece
- 8.3.1.3. Halfmoon Liner
- 8.3.1.4. Other Heat-induction Cap Liners
- 8.3.2. Pressure Sensitive Liners
- 8.3.3. Other Product Types
- 8.3.1. Heat-induction Cap Liners
- 8.4. Market Analysis, Insights and Forecast - by End-user Industry
- 8.4.1. Food
- 8.4.2. Beverage
- 8.4.3. Personal Care & Cosmetics
- 8.4.4. Chemicals & Fertilizers
- 8.4.5. Oil, Lubricants, and Grease
- 8.4.6. Home Care
- 8.4.7. Other End-user Industries
- 8.1. Market Analysis, Insights and Forecast - by Material Type
- 9. Asia Pacific Cap Liners Market Analysis, Insights and Forecast, 2020-2032
- 9.1. Market Analysis, Insights and Forecast - by Material Type
- 9.1.1. Rubber
- 9.1.2. Metal
- 9.1.3. Plastic
- 9.1.4. Paper
- 9.2. Market Analysis, Insights and Forecast - by Application
- 9.2.1. Bottles
- 9.2.2. Jars & Containers
- 9.3. Market Analysis, Insights and Forecast - by Product Type
- 9.3.1. Heat-induction Cap Liners
- 9.3.1.1. One-piece
- 9.3.1.2. Two-piece
- 9.3.1.3. Halfmoon Liner
- 9.3.1.4. Other Heat-induction Cap Liners
- 9.3.2. Pressure Sensitive Liners
- 9.3.3. Other Product Types
- 9.3.1. Heat-induction Cap Liners
- 9.4. Market Analysis, Insights and Forecast - by End-user Industry
- 9.4.1. Food
- 9.4.2. Beverage
- 9.4.3. Personal Care & Cosmetics
- 9.4.4. Chemicals & Fertilizers
- 9.4.5. Oil, Lubricants, and Grease
- 9.4.6. Home Care
- 9.4.7. Other End-user Industries
- 9.1. Market Analysis, Insights and Forecast - by Material Type
- 10. Latin America Cap Liners Market Analysis, Insights and Forecast, 2020-2032
- 10.1. Market Analysis, Insights and Forecast - by Material Type
- 10.1.1. Rubber
- 10.1.2. Metal
- 10.1.3. Plastic
- 10.1.4. Paper
- 10.2. Market Analysis, Insights and Forecast - by Application
- 10.2.1. Bottles
- 10.2.2. Jars & Containers
- 10.3. Market Analysis, Insights and Forecast - by Product Type
- 10.3.1. Heat-induction Cap Liners
- 10.3.1.1. One-piece
- 10.3.1.2. Two-piece
- 10.3.1.3. Halfmoon Liner
- 10.3.1.4. Other Heat-induction Cap Liners
- 10.3.2. Pressure Sensitive Liners
- 10.3.3. Other Product Types
- 10.3.1. Heat-induction Cap Liners
- 10.4. Market Analysis, Insights and Forecast - by End-user Industry
- 10.4.1. Food
- 10.4.2. Beverage
- 10.4.3. Personal Care & Cosmetics
- 10.4.4. Chemicals & Fertilizers
- 10.4.5. Oil, Lubricants, and Grease
- 10.4.6. Home Care
- 10.4.7. Other End-user Industries
- 10.1. Market Analysis, Insights and Forecast - by Material Type
- 11. Middle East and Africa Cap Liners Market Analysis, Insights and Forecast, 2020-2032
- 11.1. Market Analysis, Insights and Forecast - by Material Type
- 11.1.1. Rubber
- 11.1.2. Metal
- 11.1.3. Plastic
- 11.1.4. Paper
- 11.2. Market Analysis, Insights and Forecast - by Application
- 11.2.1. Bottles
- 11.2.2. Jars & Containers
- 11.3. Market Analysis, Insights and Forecast - by Product Type
- 11.3.1. Heat-induction Cap Liners
- 11.3.1.1. One-piece
- 11.3.1.2. Two-piece
- 11.3.1.3. Halfmoon Liner
- 11.3.1.4. Other Heat-induction Cap Liners
- 11.3.2. Pressure Sensitive Liners
- 11.3.3. Other Product Types
- 11.3.1. Heat-induction Cap Liners
- 11.4. Market Analysis, Insights and Forecast - by End-user Industry
- 11.4.1. Food
- 11.4.2. Beverage
- 11.4.3. Personal Care & Cosmetics
- 11.4.4. Chemicals & Fertilizers
- 11.4.5. Oil, Lubricants, and Grease
- 11.4.6. Home Care
- 11.4.7. Other End-user Industries
- 11.1. Market Analysis, Insights and Forecast - by Material Type
- 12. Competitive Analysis
- 12.1. Company Profiles
- 12.1.1 Meyer Seals GmbH
- 12.1.1.1. Company Overview
- 12.1.1.2. Products
- 12.1.1.3. Company Financials
- 12.1.1.4. SWOT Analysis
- 12.1.2 Tekni-Plex Inc
- 12.1.2.1. Company Overview
- 12.1.2.2. Products
- 12.1.2.3. Company Financials
- 12.1.2.4. SWOT Analysis
- 12.1.3 Bluemay Weston Limited
- 12.1.3.1. Company Overview
- 12.1.3.2. Products
- 12.1.3.3. Company Financials
- 12.1.3.4. SWOT Analysis
- 12.1.4 Press-On Corporation
- 12.1.4.1. Company Overview
- 12.1.4.2. Products
- 12.1.4.3. Company Financials
- 12.1.4.4. SWOT Analysis
- 12.1.5 B&B Cap Liners LLC
- 12.1.5.1. Company Overview
- 12.1.5.2. Products
- 12.1.5.3. Company Financials
- 12.1.5.4. SWOT Analysis
- 12.1.6 Low's Cap Seal Sdn Bhd
- 12.1.6.1. Company Overview
- 12.1.6.2. Products
- 12.1.6.3. Company Financials
- 12.1.6.4. SWOT Analysis
- 12.1.7 Tien Lik Cap Seal Sdn Bhd
- 12.1.7.1. Company Overview
- 12.1.7.2. Products
- 12.1.7.3. Company Financials
- 12.1.7.4. SWOT Analysis
- 12.1.8 Captel International Pvt Ltd
- 12.1.8.1. Company Overview
- 12.1.8.2. Products
- 12.1.8.3. Company Financials
- 12.1.8.4. SWOT Analysis
- 12.1.9 The Cary Company
- 12.1.9.1. Company Overview
- 12.1.9.2. Products
- 12.1.9.3. Company Financials
- 12.1.9.4. SWOT Analysis
- 12.1.10 Selig UK Limited
- 12.1.10.1. Company Overview
- 12.1.10.2. Products
- 12.1.10.3. Company Financials
- 12.1.10.4. SWOT Analysis
- 12.1.11 M F I Capliners*List Not Exhaustive
- 12.1.11.1. Company Overview
- 12.1.11.2. Products
- 12.1.11.3. Company Financials
- 12.1.11.4. SWOT Analysis
- 12.1.1 Meyer Seals GmbH
- 12.2. Market Entropy
- 12.2.1 Company's Key Areas Served
- 12.2.2 Recent Developments
- 12.3. Company Market Share Analysis 2025
- 12.3.1 Top 5 Companies Market Share Analysis
- 12.3.2 Top 3 Companies Market Share Analysis
- 12.4. List of Potential Customers
- 13. Research Methodology
List of Figures
- Figure 1: Global Cap Liners Market Revenue Breakdown (Million, %) by Region 2025 & 2033
- Figure 2: Global Cap Liners Market Volume Breakdown (Billion, %) by Region 2025 & 2033
- Figure 3: North America Cap Liners Market Revenue (Million), by Material Type 2025 & 2033
- Figure 4: North America Cap Liners Market Volume (Billion), by Material Type 2025 & 2033
- Figure 5: North America Cap Liners Market Revenue Share (%), by Material Type 2025 & 2033
- Figure 6: North America Cap Liners Market Volume Share (%), by Material Type 2025 & 2033
- Figure 7: North America Cap Liners Market Revenue (Million), by Application 2025 & 2033
- Figure 8: North America Cap Liners Market Volume (Billion), by Application 2025 & 2033
- Figure 9: North America Cap Liners Market Revenue Share (%), by Application 2025 & 2033
- Figure 10: North America Cap Liners Market Volume Share (%), by Application 2025 & 2033
- Figure 11: North America Cap Liners Market Revenue (Million), by Product Type 2025 & 2033
- Figure 12: North America Cap Liners Market Volume (Billion), by Product Type 2025 & 2033
- Figure 13: North America Cap Liners Market Revenue Share (%), by Product Type 2025 & 2033
- Figure 14: North America Cap Liners Market Volume Share (%), by Product Type 2025 & 2033
- Figure 15: North America Cap Liners Market Revenue (Million), by End-user Industry 2025 & 2033
- Figure 16: North America Cap Liners Market Volume (Billion), by End-user Industry 2025 & 2033
- Figure 17: North America Cap Liners Market Revenue Share (%), by End-user Industry 2025 & 2033
- Figure 18: North America Cap Liners Market Volume Share (%), by End-user Industry 2025 & 2033
- Figure 19: North America Cap Liners Market Revenue (Million), by Country 2025 & 2033
- Figure 20: North America Cap Liners Market Volume (Billion), by Country 2025 & 2033
- Figure 21: North America Cap Liners Market Revenue Share (%), by Country 2025 & 2033
- Figure 22: North America Cap Liners Market Volume Share (%), by Country 2025 & 2033
- Figure 23: Europe Cap Liners Market Revenue (Million), by Material Type 2025 & 2033
- Figure 24: Europe Cap Liners Market Volume (Billion), by Material Type 2025 & 2033
- Figure 25: Europe Cap Liners Market Revenue Share (%), by Material Type 2025 & 2033
- Figure 26: Europe Cap Liners Market Volume Share (%), by Material Type 2025 & 2033
- Figure 27: Europe Cap Liners Market Revenue (Million), by Application 2025 & 2033
- Figure 28: Europe Cap Liners Market Volume (Billion), by Application 2025 & 2033
- Figure 29: Europe Cap Liners Market Revenue Share (%), by Application 2025 & 2033
- Figure 30: Europe Cap Liners Market Volume Share (%), by Application 2025 & 2033
- Figure 31: Europe Cap Liners Market Revenue (Million), by Product Type 2025 & 2033
- Figure 32: Europe Cap Liners Market Volume (Billion), by Product Type 2025 & 2033
- Figure 33: Europe Cap Liners Market Revenue Share (%), by Product Type 2025 & 2033
- Figure 34: Europe Cap Liners Market Volume Share (%), by Product Type 2025 & 2033
- Figure 35: Europe Cap Liners Market Revenue (Million), by End-user Industry 2025 & 2033
- Figure 36: Europe Cap Liners Market Volume (Billion), by End-user Industry 2025 & 2033
- Figure 37: Europe Cap Liners Market Revenue Share (%), by End-user Industry 2025 & 2033
- Figure 38: Europe Cap Liners Market Volume Share (%), by End-user Industry 2025 & 2033
- Figure 39: Europe Cap Liners Market Revenue (Million), by Country 2025 & 2033
- Figure 40: Europe Cap Liners Market Volume (Billion), by Country 2025 & 2033
- Figure 41: Europe Cap Liners Market Revenue Share (%), by Country 2025 & 2033
- Figure 42: Europe Cap Liners Market Volume Share (%), by Country 2025 & 2033
- Figure 43: Asia Pacific Cap Liners Market Revenue (Million), by Material Type 2025 & 2033
- Figure 44: Asia Pacific Cap Liners Market Volume (Billion), by Material Type 2025 & 2033
- Figure 45: Asia Pacific Cap Liners Market Revenue Share (%), by Material Type 2025 & 2033
- Figure 46: Asia Pacific Cap Liners Market Volume Share (%), by Material Type 2025 & 2033
- Figure 47: Asia Pacific Cap Liners Market Revenue (Million), by Application 2025 & 2033
- Figure 48: Asia Pacific Cap Liners Market Volume (Billion), by Application 2025 & 2033
- Figure 49: Asia Pacific Cap Liners Market Revenue Share (%), by Application 2025 & 2033
- Figure 50: Asia Pacific Cap Liners Market Volume Share (%), by Application 2025 & 2033
- Figure 51: Asia Pacific Cap Liners Market Revenue (Million), by Product Type 2025 & 2033
- Figure 52: Asia Pacific Cap Liners Market Volume (Billion), by Product Type 2025 & 2033
- Figure 53: Asia Pacific Cap Liners Market Revenue Share (%), by Product Type 2025 & 2033
- Figure 54: Asia Pacific Cap Liners Market Volume Share (%), by Product Type 2025 & 2033
- Figure 55: Asia Pacific Cap Liners Market Revenue (Million), by End-user Industry 2025 & 2033
- Figure 56: Asia Pacific Cap Liners Market Volume (Billion), by End-user Industry 2025 & 2033
- Figure 57: Asia Pacific Cap Liners Market Revenue Share (%), by End-user Industry 2025 & 2033
- Figure 58: Asia Pacific Cap Liners Market Volume Share (%), by End-user Industry 2025 & 2033
- Figure 59: Asia Pacific Cap Liners Market Revenue (Million), by Country 2025 & 2033
- Figure 60: Asia Pacific Cap Liners Market Volume (Billion), by Country 2025 & 2033
- Figure 61: Asia Pacific Cap Liners Market Revenue Share (%), by Country 2025 & 2033
- Figure 62: Asia Pacific Cap Liners Market Volume Share (%), by Country 2025 & 2033
- Figure 63: Latin America Cap Liners Market Revenue (Million), by Material Type 2025 & 2033
- Figure 64: Latin America Cap Liners Market Volume (Billion), by Material Type 2025 & 2033
- Figure 65: Latin America Cap Liners Market Revenue Share (%), by Material Type 2025 & 2033
- Figure 66: Latin America Cap Liners Market Volume Share (%), by Material Type 2025 & 2033
- Figure 67: Latin America Cap Liners Market Revenue (Million), by Application 2025 & 2033
- Figure 68: Latin America Cap Liners Market Volume (Billion), by Application 2025 & 2033
- Figure 69: Latin America Cap Liners Market Revenue Share (%), by Application 2025 & 2033
- Figure 70: Latin America Cap Liners Market Volume Share (%), by Application 2025 & 2033
- Figure 71: Latin America Cap Liners Market Revenue (Million), by Product Type 2025 & 2033
- Figure 72: Latin America Cap Liners Market Volume (Billion), by Product Type 2025 & 2033
- Figure 73: Latin America Cap Liners Market Revenue Share (%), by Product Type 2025 & 2033
- Figure 74: Latin America Cap Liners Market Volume Share (%), by Product Type 2025 & 2033
- Figure 75: Latin America Cap Liners Market Revenue (Million), by End-user Industry 2025 & 2033
- Figure 76: Latin America Cap Liners Market Volume (Billion), by End-user Industry 2025 & 2033
- Figure 77: Latin America Cap Liners Market Revenue Share (%), by End-user Industry 2025 & 2033
- Figure 78: Latin America Cap Liners Market Volume Share (%), by End-user Industry 2025 & 2033
- Figure 79: Latin America Cap Liners Market Revenue (Million), by Country 2025 & 2033
- Figure 80: Latin America Cap Liners Market Volume (Billion), by Country 2025 & 2033
- Figure 81: Latin America Cap Liners Market Revenue Share (%), by Country 2025 & 2033
- Figure 82: Latin America Cap Liners Market Volume Share (%), by Country 2025 & 2033
- Figure 83: Middle East and Africa Cap Liners Market Revenue (Million), by Material Type 2025 & 2033
- Figure 84: Middle East and Africa Cap Liners Market Volume (Billion), by Material Type 2025 & 2033
- Figure 85: Middle East and Africa Cap Liners Market Revenue Share (%), by Material Type 2025 & 2033
- Figure 86: Middle East and Africa Cap Liners Market Volume Share (%), by Material Type 2025 & 2033
- Figure 87: Middle East and Africa Cap Liners Market Revenue (Million), by Application 2025 & 2033
- Figure 88: Middle East and Africa Cap Liners Market Volume (Billion), by Application 2025 & 2033
- Figure 89: Middle East and Africa Cap Liners Market Revenue Share (%), by Application 2025 & 2033
- Figure 90: Middle East and Africa Cap Liners Market Volume Share (%), by Application 2025 & 2033
- Figure 91: Middle East and Africa Cap Liners Market Revenue (Million), by Product Type 2025 & 2033
- Figure 92: Middle East and Africa Cap Liners Market Volume (Billion), by Product Type 2025 & 2033
- Figure 93: Middle East and Africa Cap Liners Market Revenue Share (%), by Product Type 2025 & 2033
- Figure 94: Middle East and Africa Cap Liners Market Volume Share (%), by Product Type 2025 & 2033
- Figure 95: Middle East and Africa Cap Liners Market Revenue (Million), by End-user Industry 2025 & 2033
- Figure 96: Middle East and Africa Cap Liners Market Volume (Billion), by End-user Industry 2025 & 2033
- Figure 97: Middle East and Africa Cap Liners Market Revenue Share (%), by End-user Industry 2025 & 2033
- Figure 98: Middle East and Africa Cap Liners Market Volume Share (%), by End-user Industry 2025 & 2033
- Figure 99: Middle East and Africa Cap Liners Market Revenue (Million), by Country 2025 & 2033
- Figure 100: Middle East and Africa Cap Liners Market Volume (Billion), by Country 2025 & 2033
- Figure 101: Middle East and Africa Cap Liners Market Revenue Share (%), by Country 2025 & 2033
- Figure 102: Middle East and Africa Cap Liners Market Volume Share (%), by Country 2025 & 2033
List of Tables
- Table 1: Global Cap Liners Market Revenue Million Forecast, by Material Type 2020 & 2033
- Table 2: Global Cap Liners Market Volume Billion Forecast, by Material Type 2020 & 2033
- Table 3: Global Cap Liners Market Revenue Million Forecast, by Application 2020 & 2033
- Table 4: Global Cap Liners Market Volume Billion Forecast, by Application 2020 & 2033
- Table 5: Global Cap Liners Market Revenue Million Forecast, by Product Type 2020 & 2033
- Table 6: Global Cap Liners Market Volume Billion Forecast, by Product Type 2020 & 2033
- Table 7: Global Cap Liners Market Revenue Million Forecast, by End-user Industry 2020 & 2033
- Table 8: Global Cap Liners Market Volume Billion Forecast, by End-user Industry 2020 & 2033
- Table 9: Global Cap Liners Market Revenue Million Forecast, by Region 2020 & 2033
- Table 10: Global Cap Liners Market Volume Billion Forecast, by Region 2020 & 2033
- Table 11: Global Cap Liners Market Revenue Million Forecast, by Material Type 2020 & 2033
- Table 12: Global Cap Liners Market Volume Billion Forecast, by Material Type 2020 & 2033
- Table 13: Global Cap Liners Market Revenue Million Forecast, by Application 2020 & 2033
- Table 14: Global Cap Liners Market Volume Billion Forecast, by Application 2020 & 2033
- Table 15: Global Cap Liners Market Revenue Million Forecast, by Product Type 2020 & 2033
- Table 16: Global Cap Liners Market Volume Billion Forecast, by Product Type 2020 & 2033
- Table 17: Global Cap Liners Market Revenue Million Forecast, by End-user Industry 2020 & 2033
- Table 18: Global Cap Liners Market Volume Billion Forecast, by End-user Industry 2020 & 2033
- Table 19: Global Cap Liners Market Revenue Million Forecast, by Country 2020 & 2033
- Table 20: Global Cap Liners Market Volume Billion Forecast, by Country 2020 & 2033
- Table 21: United States Cap Liners Market Revenue (Million) Forecast, by Application 2020 & 2033
- Table 22: United States Cap Liners Market Volume (Billion) Forecast, by Application 2020 & 2033
- Table 23: Canada Cap Liners Market Revenue (Million) Forecast, by Application 2020 & 2033
- Table 24: Canada Cap Liners Market Volume (Billion) Forecast, by Application 2020 & 2033
- Table 25: Global Cap Liners Market Revenue Million Forecast, by Material Type 2020 & 2033
- Table 26: Global Cap Liners Market Volume Billion Forecast, by Material Type 2020 & 2033
- Table 27: Global Cap Liners Market Revenue Million Forecast, by Application 2020 & 2033
- Table 28: Global Cap Liners Market Volume Billion Forecast, by Application 2020 & 2033
- Table 29: Global Cap Liners Market Revenue Million Forecast, by Product Type 2020 & 2033
- Table 30: Global Cap Liners Market Volume Billion Forecast, by Product Type 2020 & 2033
- Table 31: Global Cap Liners Market Revenue Million Forecast, by End-user Industry 2020 & 2033
- Table 32: Global Cap Liners Market Volume Billion Forecast, by End-user Industry 2020 & 2033
- Table 33: Global Cap Liners Market Revenue Million Forecast, by Country 2020 & 2033
- Table 34: Global Cap Liners Market Volume Billion Forecast, by Country 2020 & 2033
- Table 35: France Cap Liners Market Revenue (Million) Forecast, by Application 2020 & 2033
- Table 36: France Cap Liners Market Volume (Billion) Forecast, by Application 2020 & 2033
- Table 37: Germany Cap Liners Market Revenue (Million) Forecast, by Application 2020 & 2033
- Table 38: Germany Cap Liners Market Volume (Billion) Forecast, by Application 2020 & 2033
- Table 39: Spain Cap Liners Market Revenue (Million) Forecast, by Application 2020 & 2033
- Table 40: Spain Cap Liners Market Volume (Billion) Forecast, by Application 2020 & 2033
- Table 41: United Kingdom Cap Liners Market Revenue (Million) Forecast, by Application 2020 & 2033
- Table 42: United Kingdom Cap Liners Market Volume (Billion) Forecast, by Application 2020 & 2033
- Table 43: Turkey Cap Liners Market Revenue (Million) Forecast, by Application 2020 & 2033
- Table 44: Turkey Cap Liners Market Volume (Billion) Forecast, by Application 2020 & 2033
- Table 45: Global Cap Liners Market Revenue Million Forecast, by Material Type 2020 & 2033
- Table 46: Global Cap Liners Market Volume Billion Forecast, by Material Type 2020 & 2033
- Table 47: Global Cap Liners Market Revenue Million Forecast, by Application 2020 & 2033
- Table 48: Global Cap Liners Market Volume Billion Forecast, by Application 2020 & 2033
- Table 49: Global Cap Liners Market Revenue Million Forecast, by Product Type 2020 & 2033
- Table 50: Global Cap Liners Market Volume Billion Forecast, by Product Type 2020 & 2033
- Table 51: Global Cap Liners Market Revenue Million Forecast, by End-user Industry 2020 & 2033
- Table 52: Global Cap Liners Market Volume Billion Forecast, by End-user Industry 2020 & 2033
- Table 53: Global Cap Liners Market Revenue Million Forecast, by Country 2020 & 2033
- Table 54: Global Cap Liners Market Volume Billion Forecast, by Country 2020 & 2033
- Table 55: China Cap Liners Market Revenue (Million) Forecast, by Application 2020 & 2033
- Table 56: China Cap Liners Market Volume (Billion) Forecast, by Application 2020 & 2033
- Table 57: India Cap Liners Market Revenue (Million) Forecast, by Application 2020 & 2033
- Table 58: India Cap Liners Market Volume (Billion) Forecast, by Application 2020 & 2033
- Table 59: Japan Cap Liners Market Revenue (Million) Forecast, by Application 2020 & 2033
- Table 60: Japan Cap Liners Market Volume (Billion) Forecast, by Application 2020 & 2033
- Table 61: Thailand Cap Liners Market Revenue (Million) Forecast, by Application 2020 & 2033
- Table 62: Thailand Cap Liners Market Volume (Billion) Forecast, by Application 2020 & 2033
- Table 63: Australia and New Zealand Cap Liners Market Revenue (Million) Forecast, by Application 2020 & 2033
- Table 64: Australia and New Zealand Cap Liners Market Volume (Billion) Forecast, by Application 2020 & 2033
- Table 65: Global Cap Liners Market Revenue Million Forecast, by Material Type 2020 & 2033
- Table 66: Global Cap Liners Market Volume Billion Forecast, by Material Type 2020 & 2033
- Table 67: Global Cap Liners Market Revenue Million Forecast, by Application 2020 & 2033
- Table 68: Global Cap Liners Market Volume Billion Forecast, by Application 2020 & 2033
- Table 69: Global Cap Liners Market Revenue Million Forecast, by Product Type 2020 & 2033
- Table 70: Global Cap Liners Market Volume Billion Forecast, by Product Type 2020 & 2033
- Table 71: Global Cap Liners Market Revenue Million Forecast, by End-user Industry 2020 & 2033
- Table 72: Global Cap Liners Market Volume Billion Forecast, by End-user Industry 2020 & 2033
- Table 73: Global Cap Liners Market Revenue Million Forecast, by Country 2020 & 2033
- Table 74: Global Cap Liners Market Volume Billion Forecast, by Country 2020 & 2033
- Table 75: Brazil Cap Liners Market Revenue (Million) Forecast, by Application 2020 & 2033
- Table 76: Brazil Cap Liners Market Volume (Billion) Forecast, by Application 2020 & 2033
- Table 77: Mexico Cap Liners Market Revenue (Million) Forecast, by Application 2020 & 2033
- Table 78: Mexico Cap Liners Market Volume (Billion) Forecast, by Application 2020 & 2033
- Table 79: Global Cap Liners Market Revenue Million Forecast, by Material Type 2020 & 2033
- Table 80: Global Cap Liners Market Volume Billion Forecast, by Material Type 2020 & 2033
- Table 81: Global Cap Liners Market Revenue Million Forecast, by Application 2020 & 2033
- Table 82: Global Cap Liners Market Volume Billion Forecast, by Application 2020 & 2033
- Table 83: Global Cap Liners Market Revenue Million Forecast, by Product Type 2020 & 2033
- Table 84: Global Cap Liners Market Volume Billion Forecast, by Product Type 2020 & 2033
- Table 85: Global Cap Liners Market Revenue Million Forecast, by End-user Industry 2020 & 2033
- Table 86: Global Cap Liners Market Volume Billion Forecast, by End-user Industry 2020 & 2033
- Table 87: Global Cap Liners Market Revenue Million Forecast, by Country 2020 & 2033
- Table 88: Global Cap Liners Market Volume Billion Forecast, by Country 2020 & 2033
- Table 89: United Arab Emirates Cap Liners Market Revenue (Million) Forecast, by Application 2020 & 2033
- Table 90: United Arab Emirates Cap Liners Market Volume (Billion) Forecast, by Application 2020 & 2033
- Table 91: Saudi Arabia Cap Liners Market Revenue (Million) Forecast, by Application 2020 & 2033
- Table 92: Saudi Arabia Cap Liners Market Volume (Billion) Forecast, by Application 2020 & 2033
- Table 93: Egypt Cap Liners Market Revenue (Million) Forecast, by Application 2020 & 2033
- Table 94: Egypt Cap Liners Market Volume (Billion) Forecast, by Application 2020 & 2033
- Table 95: South Africa Cap Liners Market Revenue (Million) Forecast, by Application 2020 & 2033
- Table 96: South Africa Cap Liners Market Volume (Billion) Forecast, by Application 2020 & 2033
Frequently Asked Questions
1. What is the projected Compound Annual Growth Rate (CAGR) of the Cap Liners Market?
The projected CAGR is approximately 3.43%.
2. Which companies are prominent players in the Cap Liners Market?
Key companies in the market include Meyer Seals GmbH, Tekni-Plex Inc, Bluemay Weston Limited, Press-On Corporation, B&B Cap Liners LLC, Low's Cap Seal Sdn Bhd, Tien Lik Cap Seal Sdn Bhd, Captel International Pvt Ltd, The Cary Company, Selig UK Limited, M F I Capliners*List Not Exhaustive.
3. What are the main segments of the Cap Liners Market?
The market segments include Material Type, Application, Product Type, End-user Industry.
4. Can you provide details about the market size?
The market size is estimated to be USD 3.54 Million as of 2022.
5. What are some drivers contributing to market growth?
Safe and Secure Handling. Storage. and Transport of Products; Increased Demand from the Pharmaceutical Industry.
6. What are the notable trends driving market growth?
Increased Use of Cap Liners in the Pharmaceutical Industry.
7. Are there any restraints impacting market growth?
Safe and Secure Handling. Storage. and Transport of Products; Increased Demand from the Pharmaceutical Industry.
8. Can you provide examples of recent developments in the market?
August 2024: Two new 3FL (Full Face Foam Liner) cap liners from W. L. Gore & Associates are engineered to maintain the structural integrity of containers of chemicals for agricultural and household uses. The 3FL-363 and 3FL-373 cap liners, the latest addition to Gore’s extensive portfolio, provide excellent breathability and are resistant to many of today’s most aggressive chemicals—toilet cleaners, stain lifters, pipe clog removers, and organic fertilizers—without necessitating any changes in formulation. This enables OEMs to get their products to market faster and possibly develop even more effective formulations.January 2024: TekniPlex launched a new series of recyclable, paper-based induction heat seal liners designed to seal dry pharma, nutrition, and food products in bottles and jars with protective properties identical to conventional solutions. The ProTecSeals Recyclable IHS Liners are made of recyclable paper from tree pulp. They offer moisture and oxygen barrier properties, resist leaks, prevent contamination, and prolong shelf life to the same standard as traditional IHS liners.
9. What pricing options are available for accessing the report?
Pricing options include single-user, multi-user, and enterprise licenses priced at USD 4750, USD 5250, and USD 8750 respectively.
10. Is the market size provided in terms of value or volume?
The market size is provided in terms of value, measured in Million and volume, measured in Billion.
11. Are there any specific market keywords associated with the report?
Yes, the market keyword associated with the report is "Cap Liners Market," which aids in identifying and referencing the specific market segment covered.
12. How do I determine which pricing option suits my needs best?
The pricing options vary based on user requirements and access needs. Individual users may opt for single-user licenses, while businesses requiring broader access may choose multi-user or enterprise licenses for cost-effective access to the report.
13. Are there any additional resources or data provided in the Cap Liners Market report?
While the report offers comprehensive insights, it's advisable to review the specific contents or supplementary materials provided to ascertain if additional resources or data are available.
14. How can I stay updated on further developments or reports in the Cap Liners Market?
To stay informed about further developments, trends, and reports in the Cap Liners Market, consider subscribing to industry newsletters, following relevant companies and organizations, or regularly checking reputable industry news sources and publications.
Methodology
Step 1 - Identification of Relevant Samples Size from Population Database


Step 2 - Approaches for Defining Global Market Size (Value, Volume* & Price*)

Note*: In applicable scenarios
Step 3 - Data Sources
Primary Research
- Web Analytics
- Survey Reports
- Research Institute
- Latest Research Reports
- Opinion Leaders
Secondary Research
- Annual Reports
- White Paper
- Latest Press Release
- Industry Association
- Paid Database
- Investor Presentations

Step 4 - Data Triangulation
Involves using different sources of information in order to increase the validity of a study
These sources are likely to be stakeholders in a program - participants, other researchers, program staff, other community members, and so on.
Then we put all data in single framework & apply various statistical tools to find out the dynamic on the market.
During the analysis stage, feedback from the stakeholder groups would be compared to determine areas of agreement as well as areas of divergence