

Key Insights
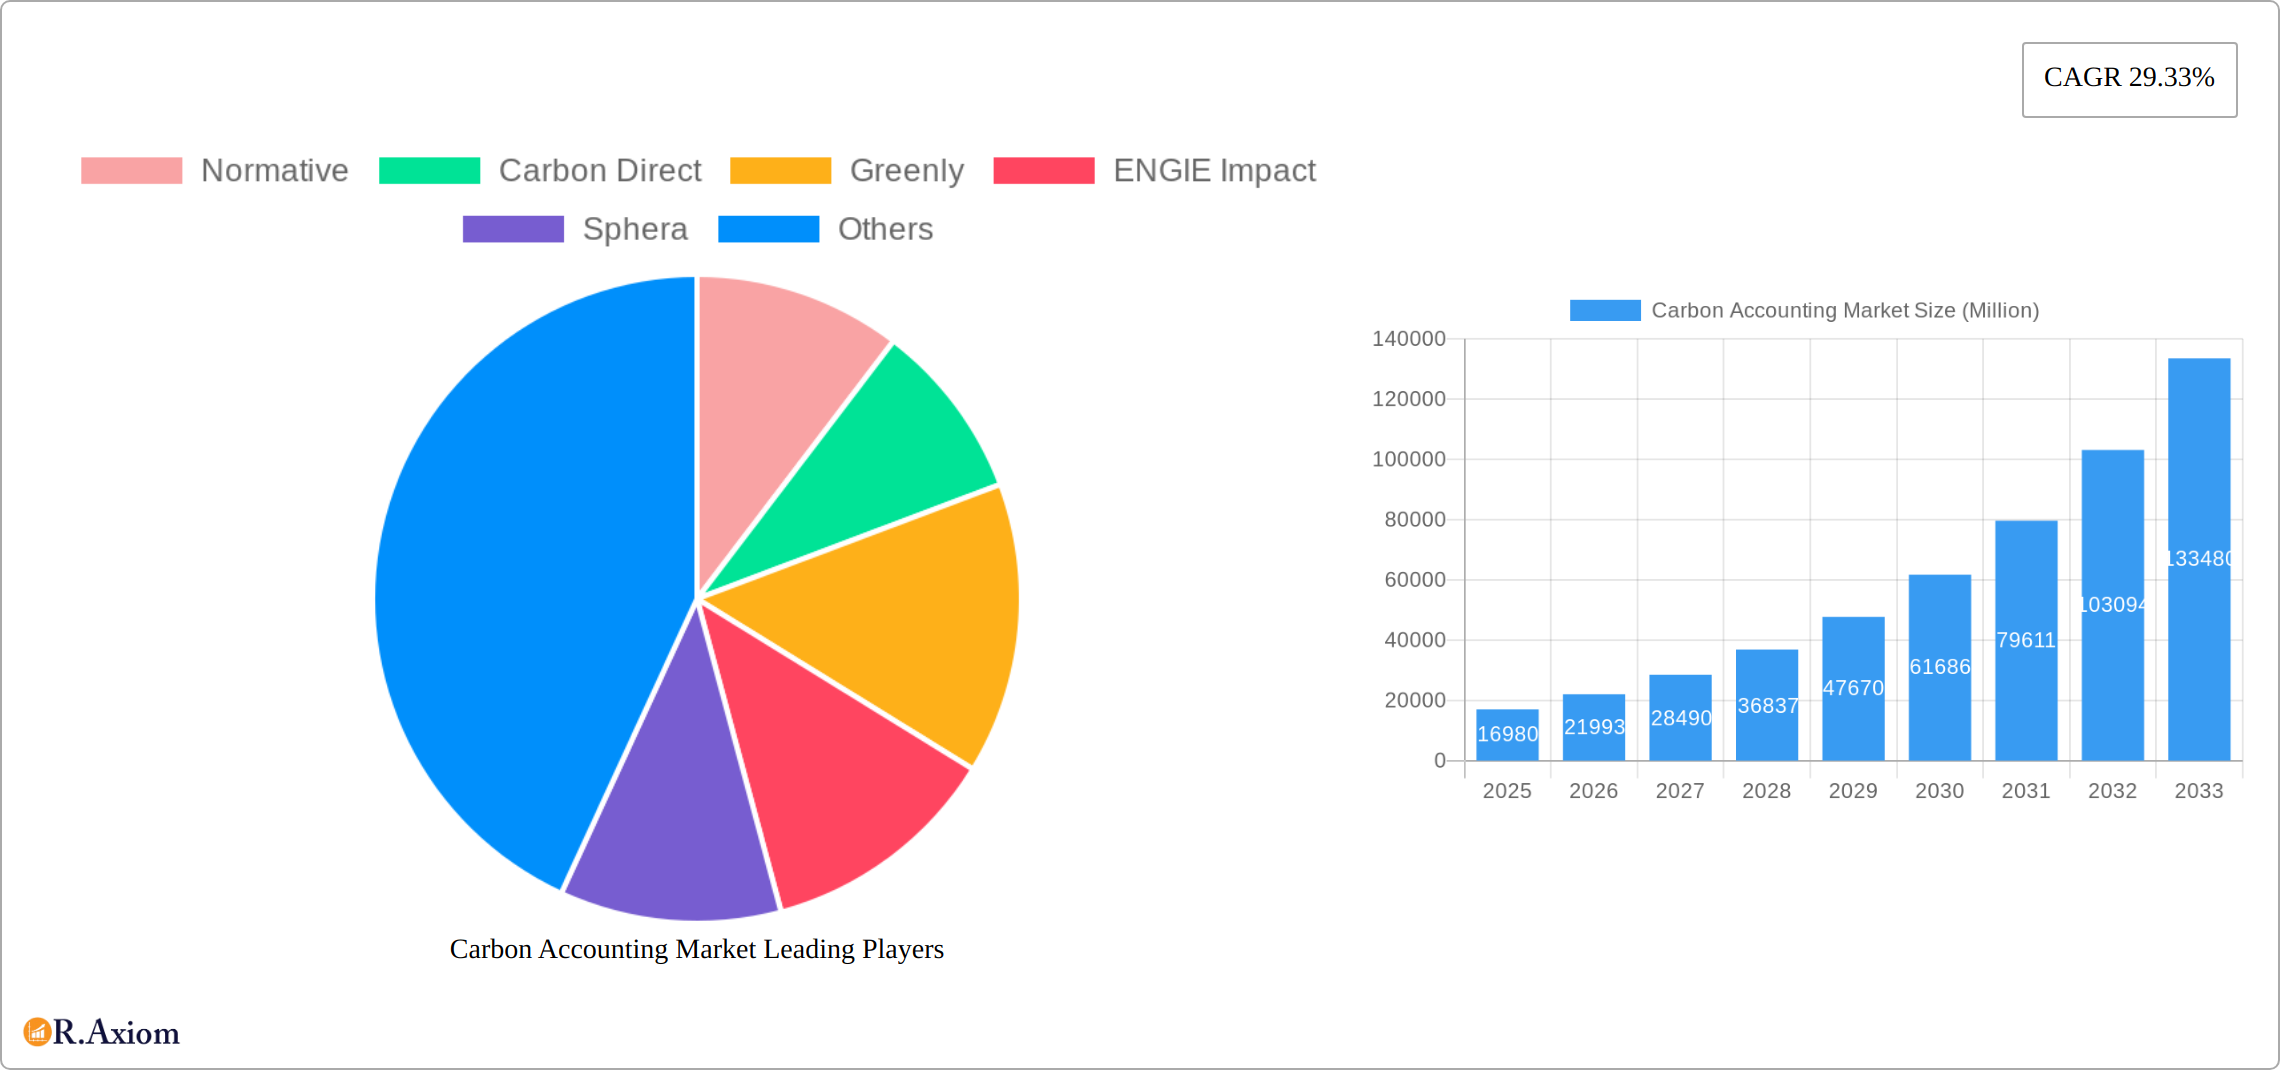
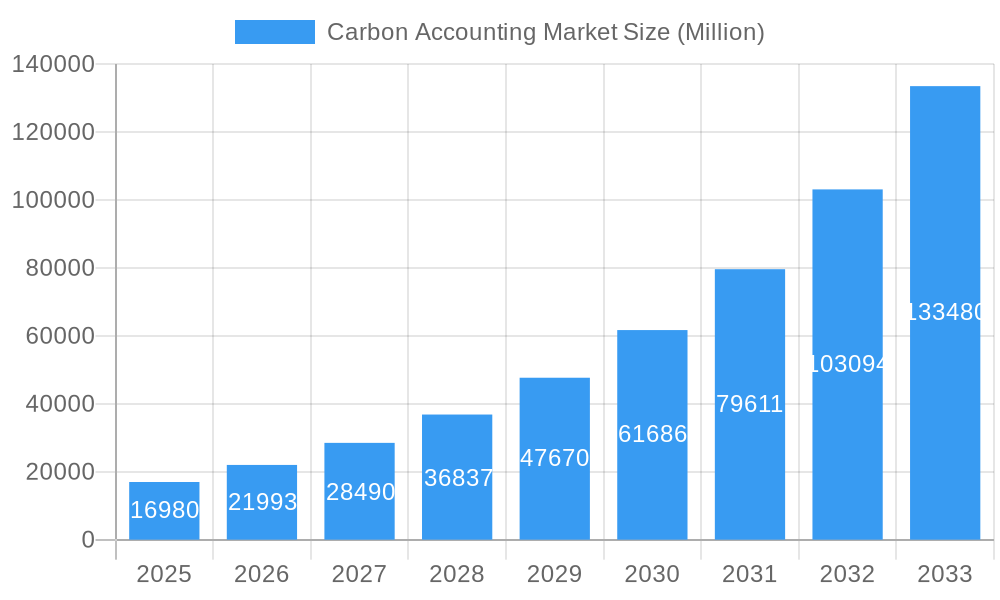
The carbon accounting market is experiencing robust growth, driven by increasing regulatory pressure, heightened corporate sustainability initiatives, and growing investor demand for transparent environmental, social, and governance (ESG) reporting. The market, valued at $16.98 billion in 2025, is projected to expand at a Compound Annual Growth Rate (CAGR) of 29.33% from 2025 to 2033. This significant growth is fueled by several key factors. Firstly, the global push towards decarbonization is mandating carbon accounting for various industries, including oil and gas, power utilities, and construction. Secondly, the increasing adoption of cloud-based solutions is streamlining processes and reducing implementation costs, making carbon accounting accessible to a wider range of businesses. Thirdly, the emergence of sophisticated AI-powered analytics is enhancing the accuracy and efficiency of carbon footprint calculations, leading to more informed decision-making. Finally, the growing number of specialized carbon accounting software and service providers is fostering market competition and driving innovation.
Carbon Accounting Market Market Size (In Billion)
The market segmentation reveals strong demand across various end-user industries. Oil and gas, power utilities, and construction & infrastructure sectors represent substantial market segments due to their significant carbon footprints and regulatory scrutiny. The cloud-based segment is experiencing rapid growth due to its scalability, flexibility, and cost-effectiveness compared to on-premise solutions. Geographically, North America and Europe currently hold significant market share, but the Asia-Pacific region is poised for substantial growth in the coming years, driven by increasing industrialization and stringent environmental regulations in rapidly developing economies like China and India. While technological advancements are driving market expansion, challenges remain. These include the complexities of accurate data collection and integration across diverse sources, the need for standardized methodologies, and the ongoing development of robust carbon accounting frameworks. The ongoing evolution of carbon accounting standards and regulations will continue to shape market dynamics and influence future growth trajectories.
Carbon Accounting Market Company Market Share
This detailed report provides a comprehensive analysis of the Carbon Accounting Market, covering market size, growth drivers, challenges, key players, and future outlook. The study period spans from 2019 to 2033, with 2025 serving as the base and estimated year. The report offers actionable insights for businesses, investors, and policymakers involved in this rapidly evolving sector.
Carbon Accounting Market Market Concentration & Innovation
The Carbon Accounting market exhibits a moderately concentrated landscape, with several key players vying for market share. While a few dominant firms hold significant positions, the market is also characterized by a dynamic competitive environment with numerous smaller players and startups driving innovation. Market concentration is further impacted by mergers and acquisitions (M&A) activity, with deal values varying significantly depending on the size and strategic importance of the acquired entity. For example, recent M&A activity shows a trend towards consolidation, with larger players acquiring smaller firms to expand their product portfolios and geographical reach. Estimated market share data for 2025 suggests that the top 5 players control approximately xx% of the market, leaving ample room for smaller players to grow and innovate.
The industry is heavily driven by innovation, particularly in areas like AI-powered data analytics, improved carbon footprint calculation methodologies, and user-friendly SaaS platforms. Stringent environmental regulations globally, such as the EU's Taxonomy Regulation and growing corporate ESG reporting mandates are significant regulatory drivers. These regulations increase the demand for accurate and transparent carbon accounting solutions. Furthermore, the rising awareness of climate change among businesses and consumers fuels market growth. While some companies are choosing to build their own internal systems, the high cost and complexity of carbon accounting often lead them to seek out external providers. Therefore, the emergence of cloud-based solutions that cater to a variety of organizational needs has become a significant factor in market growth.
Carbon Accounting Market Industry Trends & Insights
The Carbon Accounting market is experiencing robust growth, driven by a confluence of factors including intensifying regulatory pressures, the proliferation of corporate social responsibility (CSR) initiatives, and a heightened global awareness of climate change. Market analysts project a Compound Annual Growth Rate (CAGR) of xx% during the forecast period (2025-2033). This expansion is largely fueled by the increasing adoption of sophisticated carbon accounting solutions across diverse industries. Organizations are leveraging these solutions to ensure compliance with increasingly stringent environmental regulations and to demonstrably improve their environmental performance, enhancing their brand reputation and attracting environmentally conscious investors.
Technological advancements are significantly accelerating market growth. The emergence of AI-powered carbon accounting platforms offers unprecedented accuracy and efficiency in carbon data collection and analysis, streamlining processes and reducing the burden on businesses. Market penetration is rapidly increasing, reflecting a growing recognition among businesses of the critical importance of accurately measuring and managing their carbon footprint. Furthermore, evolving consumer preferences are favoring environmentally conscious products and services, creating additional pressure on businesses to enhance the transparency and accountability of their emissions. This dynamic environment fosters a highly competitive landscape, driving innovation and the development of increasingly sophisticated and user-friendly solutions to meet the evolving needs of clients.
Dominant Markets & Segments in Carbon Accounting Market
Dominant Regions/Countries: The North American and European regions are currently leading the Carbon Accounting market, driven by stringent environmental regulations and increased corporate awareness of sustainability. However, the Asia-Pacific region is expected to witness significant growth in the coming years, spurred by increasing industrialization and government initiatives aimed at combating climate change.
Dominant End-User Segments:
- Oil and Gas: This sector faces intense pressure to decarbonize, making carbon accounting crucial for compliance and sustainability reporting.
- Power Utilities: The transition to renewable energy sources is driving significant investment in carbon accounting solutions within this sector.
- Construction and Infrastructure: Growing awareness of the industry’s high carbon footprint is fostering demand for effective carbon accounting.
Dominant Type:
- Cloud Based: Cloud-based solutions offer scalability, accessibility, and cost-effectiveness, leading to their widespread adoption.
Key Drivers:
- Stringent Environmental Regulations: Compliance with regulations is a major driver.
- Growing Corporate Social Responsibility (CSR) Initiatives: Companies increasingly prioritize sustainable practices.
- Advancements in Technology: AI and machine learning are improving carbon accounting solutions.
- Economic incentives: Government programs are providing incentives for businesses to adopt sustainable practices.
Carbon Accounting Market Product Developments
Recent product developments in the carbon accounting market focus on enhancing the accuracy, efficiency, and accessibility of carbon accounting solutions. New products leverage AI and machine learning to automate data collection and analysis, resulting in more precise carbon footprint calculations. These advancements also simplify the process of integrating data from disparate sources, thus addressing the challenges businesses previously faced in this area. The integration of user-friendly interfaces and reporting dashboards enables businesses of all sizes to effectively manage their carbon footprint and achieve their sustainability goals. The market is seeing increasing competition, with companies focused on creating products that accurately reflect emission profiles and cater to diverse industry-specific requirements. This is reflected in the growing number of SaaS platforms and specialized software tools that focus on particular industries' reporting needs.
Report Scope & Segmentation Analysis
This report segments the Carbon Accounting market based on End-Users (Oil and Gas, Power Utilities, Construction and Infrastructure, Telecommunication, Food and Beverages, Other End Users) and Type (Cloud Based, On-Premise). Each segment is analyzed in detail, with projections for market size, growth rates, and competitive landscapes.
End-Users: The Oil and Gas sector currently dominates this market segment. However, significant growth is projected within the Construction and Infrastructure, and Food and Beverages sectors due to increased regulatory pressure.
Type: Cloud-based solutions are expected to maintain their dominant position due to their flexibility and accessibility. On-premise solutions are still present but are slowly losing ground to cloud-based solutions.
Key Drivers of Carbon Accounting Market Growth
The Carbon Accounting market's growth is propelled by several key factors: increasingly stringent environmental regulations globally, rising corporate social responsibility (CSR) initiatives, the growing demand for transparency and accountability regarding carbon emissions, and technological advancements enabling improved accuracy and efficiency in carbon accounting. For instance, the EU's Sustainable Finance Disclosure Regulation (SFDR) and the Corporate Sustainability Reporting Directive (CSRD) mandate enhanced sustainability reporting, fueling demand. Similarly, growing consumer awareness of climate change impacts businesses' sustainability actions, pushing for increased transparency. Finally, the development of advanced technologies, such as AI-powered data analytics, significantly improves the accuracy and efficiency of carbon accounting processes, driving market expansion.
Challenges in the Carbon Accounting Market Sector
Despite the significant growth potential, several challenges impede the Carbon Accounting market's expansion. Ensuring data accuracy and consistency remains a major hurdle, as inconsistencies in data collection methodologies can lead to inaccurate carbon footprint calculations, undermining the reliability of reports and potentially hindering effective decarbonization strategies. The substantial cost of implementation, especially for smaller businesses with limited resources, can restrict wider adoption. A lack of standardization in carbon accounting methodologies across different organizations and countries further complicates the landscape, making cross-organizational and international comparisons challenging. The competitive intensity also presents challenges, with companies constantly striving to enhance the accuracy, usability, and overall effectiveness of their offerings. The complexity of integrating data from diverse sources across various organizational levels adds another layer of difficulty.
Emerging Opportunities in Carbon Accounting Market
Despite these challenges, the Carbon Accounting market presents a wealth of exciting opportunities. The increasing adoption of blockchain technology offers a secure and transparent platform for carbon credit trading and verification, enhancing trust and efficiency in the carbon market. The development of more sophisticated carbon accounting methodologies empowers businesses to gain a deeper understanding of their emissions, enabling more effective and targeted decarbonization efforts. Significant growth is anticipated in emerging markets, where environmental regulations are rapidly evolving, and businesses are increasingly recognizing the importance of accurate carbon accounting for sustainable growth and international competitiveness. The integration of carbon accounting into broader Environmental, Social, and Governance (ESG) reporting platforms is also a key driver of growth, reflecting the growing demand for comprehensive and integrated sustainability reporting solutions.
Leading Players in the Carbon Accounting Market Market
- Normative
- Carbon Direct
- Greenly
- ENGIE Impact
- Sphera
- SINAI Technologies
- Persefoni AI
- Emitwise
- International Business Machines Corporation
- Diligent Corporation
Key Developments in Carbon Accounting Market Industry
- March 2024: Greenly secured USD 52 Million in Series B funding to significantly enhance its carbon accounting methodologies and expand its global market presence.
- March 2024: Green Project Technologies launched its Green Project White Label solution, strategically targeting the burgeoning ESG service market by offering a customizable carbon accounting platform designed for various service providers.
Strategic Outlook for Carbon Accounting Market Market
The Carbon Accounting market is poised for considerable growth in the coming years. The widespread adoption of sustainable practices by businesses across diverse sectors is expected to be a key driver of market expansion. Ongoing technological advancements, particularly the increased application of AI and machine learning, will continue to enhance the accuracy and efficiency of carbon accounting solutions, making them more accessible and cost-effective for a wider range of organizations. Government regulations and initiatives aimed at mitigating climate change will remain crucial catalysts, driving market growth and maturity. This expansion is projected to be particularly pronounced in emerging markets, where the adoption of carbon accounting is still in its nascent stages but holds immense potential for future growth.
Carbon Accounting Market Segmentation
-
1. Type
- 1.1. Cloud Based
- 1.2. On Premise
-
2. End Users
- 2.1. Oil and Gas
- 2.2. Power Utilities
- 2.3. Construction and Infrastructure
- 2.4. Telecommunication
- 2.5. Food and Beverages
- 2.6. Other End Users
Carbon Accounting Market Segmentation By Geography
-
1. North America
- 1.1. United States
- 1.2. Canada
- 1.3. Rest of North America
-
2. Europe
- 2.1. Germany
- 2.2. France
- 2.3. United Kingdom
- 2.4. Italy
- 2.5. Spain
- 2.6. NORDIC
- 2.7. Russia
- 2.8. Turkey
- 2.9. Rest of Europe
-
3. Asia Pacific
- 3.1. China
- 3.2. India
- 3.3. Australia
- 3.4. Japan
- 3.5. South Korea
- 3.6. Malaysia
- 3.7. Thailand
- 3.8. Indonesia
- 3.9. Vietnam
- 3.10. Rest of Asia Pacific
-
4. Middle East and Africa
- 4.1. Saudi Arabia
- 4.2. United Arab Emirates
- 4.3. Nigeria
- 4.4. Egypt
- 4.5. Qatar
- 4.6. South Africa
- 4.7. Rest of Middle East and Africa
-
5. South America
- 5.1. Brazil
- 5.2. Argentina
- 5.3. Colombia
- 5.4. Rest of South America
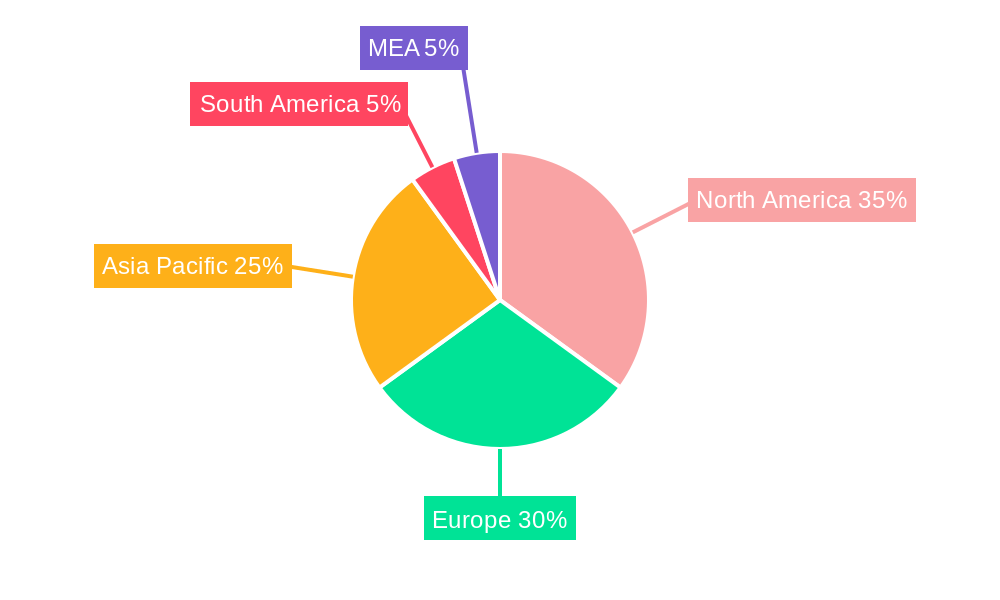
Carbon Accounting Market Regional Market Share
Geographic Coverage of Carbon Accounting Market
Carbon Accounting Market REPORT HIGHLIGHTS
| Aspects | Details |
|---|---|
| Study Period | 2020-2034 |
| Base Year | 2025 |
| Estimated Year | 2026 |
| Forecast Period | 2026-2034 |
| Historical Period | 2020-2025 |
| Growth Rate | CAGR of 29.33% from 2020-2034 |
| Segmentation |
|
Table of Contents
- 1. Introduction
- 1.1. Research Scope
- 1.2. Market Segmentation
- 1.3. Research Objective
- 1.4. Definitions and Assumptions
- 2. Executive Summary
- 2.1. Market Snapshot
- 3. Market Dynamics
- 3.1. Market Drivers
- 3.2. Market Restrains
- 3.3. Market Trends
- 3.4. Market Opportunities
- 4. Market Factor Analysis
- 4.1. Porters Five Forces
- 4.1.1. Bargaining Power of Suppliers
- 4.1.2. Bargaining Power of Buyers
- 4.1.3. Threat of New Entrants
- 4.1.4. Threat of Substitutes
- 4.1.5. Competitive Rivalry
- 4.2. PESTEL analysis
- 4.3. BCG Analysis
- 4.3.1. Stars (High Growth, High Market Share)
- 4.3.2. Cash Cows (Low Growth, High Market Share)
- 4.3.3. Question Mark (High Growth, Low Market Share)
- 4.3.4. Dogs (Low Growth, Low Market Share)
- 4.4. Ansoff Matrix Analysis
- 4.5. Supply Chain Analysis
- 4.6. Regulatory Landscape
- 4.7. Current Market Potential and Opportunity Assessment (TAM–SAM–SOM Framework)
- 4.8. RAX Analyst Note
- 4.1. Porters Five Forces
- 5. Market Analysis, Insights and Forecast 2021-2033
- 5.1. Market Analysis, Insights and Forecast - by Type
- 5.1.1. Cloud Based
- 5.1.2. On Premise
- 5.2. Market Analysis, Insights and Forecast - by End Users
- 5.2.1. Oil and Gas
- 5.2.2. Power Utilities
- 5.2.3. Construction and Infrastructure
- 5.2.4. Telecommunication
- 5.2.5. Food and Beverages
- 5.2.6. Other End Users
- 5.3. Market Analysis, Insights and Forecast - by Region
- 5.3.1. North America
- 5.3.2. Europe
- 5.3.3. Asia Pacific
- 5.3.4. Middle East and Africa
- 5.3.5. South America
- 5.1. Market Analysis, Insights and Forecast - by Type
- 6. Global Carbon Accounting Market Analysis, Insights and Forecast, 2021-2033
- 6.1. Market Analysis, Insights and Forecast - by Type
- 6.1.1. Cloud Based
- 6.1.2. On Premise
- 6.2. Market Analysis, Insights and Forecast - by End Users
- 6.2.1. Oil and Gas
- 6.2.2. Power Utilities
- 6.2.3. Construction and Infrastructure
- 6.2.4. Telecommunication
- 6.2.5. Food and Beverages
- 6.2.6. Other End Users
- 6.1. Market Analysis, Insights and Forecast - by Type
- 7. North America Carbon Accounting Market Analysis, Insights and Forecast, 2020-2032
- 7.1. Market Analysis, Insights and Forecast - by Type
- 7.1.1. Cloud Based
- 7.1.2. On Premise
- 7.2. Market Analysis, Insights and Forecast - by End Users
- 7.2.1. Oil and Gas
- 7.2.2. Power Utilities
- 7.2.3. Construction and Infrastructure
- 7.2.4. Telecommunication
- 7.2.5. Food and Beverages
- 7.2.6. Other End Users
- 7.1. Market Analysis, Insights and Forecast - by Type
- 8. Europe Carbon Accounting Market Analysis, Insights and Forecast, 2020-2032
- 8.1. Market Analysis, Insights and Forecast - by Type
- 8.1.1. Cloud Based
- 8.1.2. On Premise
- 8.2. Market Analysis, Insights and Forecast - by End Users
- 8.2.1. Oil and Gas
- 8.2.2. Power Utilities
- 8.2.3. Construction and Infrastructure
- 8.2.4. Telecommunication
- 8.2.5. Food and Beverages
- 8.2.6. Other End Users
- 8.1. Market Analysis, Insights and Forecast - by Type
- 9. Asia Pacific Carbon Accounting Market Analysis, Insights and Forecast, 2020-2032
- 9.1. Market Analysis, Insights and Forecast - by Type
- 9.1.1. Cloud Based
- 9.1.2. On Premise
- 9.2. Market Analysis, Insights and Forecast - by End Users
- 9.2.1. Oil and Gas
- 9.2.2. Power Utilities
- 9.2.3. Construction and Infrastructure
- 9.2.4. Telecommunication
- 9.2.5. Food and Beverages
- 9.2.6. Other End Users
- 9.1. Market Analysis, Insights and Forecast - by Type
- 10. Middle East and Africa Carbon Accounting Market Analysis, Insights and Forecast, 2020-2032
- 10.1. Market Analysis, Insights and Forecast - by Type
- 10.1.1. Cloud Based
- 10.1.2. On Premise
- 10.2. Market Analysis, Insights and Forecast - by End Users
- 10.2.1. Oil and Gas
- 10.2.2. Power Utilities
- 10.2.3. Construction and Infrastructure
- 10.2.4. Telecommunication
- 10.2.5. Food and Beverages
- 10.2.6. Other End Users
- 10.1. Market Analysis, Insights and Forecast - by Type
- 11. South America Carbon Accounting Market Analysis, Insights and Forecast, 2020-2032
- 11.1. Market Analysis, Insights and Forecast - by Type
- 11.1.1. Cloud Based
- 11.1.2. On Premise
- 11.2. Market Analysis, Insights and Forecast - by End Users
- 11.2.1. Oil and Gas
- 11.2.2. Power Utilities
- 11.2.3. Construction and Infrastructure
- 11.2.4. Telecommunication
- 11.2.5. Food and Beverages
- 11.2.6. Other End Users
- 11.1. Market Analysis, Insights and Forecast - by Type
- 12. Competitive Analysis
- 12.1. Company Profiles
- 12.1.1 Normative
- 12.1.1.1. Company Overview
- 12.1.1.2. Products
- 12.1.1.3. Company Financials
- 12.1.1.4. SWOT Analysis
- 12.1.2 Carbon Direct
- 12.1.2.1. Company Overview
- 12.1.2.2. Products
- 12.1.2.3. Company Financials
- 12.1.2.4. SWOT Analysis
- 12.1.3 Greenly
- 12.1.3.1. Company Overview
- 12.1.3.2. Products
- 12.1.3.3. Company Financials
- 12.1.3.4. SWOT Analysis
- 12.1.4 ENGIE Impact
- 12.1.4.1. Company Overview
- 12.1.4.2. Products
- 12.1.4.3. Company Financials
- 12.1.4.4. SWOT Analysis
- 12.1.5 Sphera
- 12.1.5.1. Company Overview
- 12.1.5.2. Products
- 12.1.5.3. Company Financials
- 12.1.5.4. SWOT Analysis
- 12.1.6 SINAI Technologies
- 12.1.6.1. Company Overview
- 12.1.6.2. Products
- 12.1.6.3. Company Financials
- 12.1.6.4. SWOT Analysis
- 12.1.7 Persefoni AI
- 12.1.7.1. Company Overview
- 12.1.7.2. Products
- 12.1.7.3. Company Financials
- 12.1.7.4. SWOT Analysis
- 12.1.8 Emitwise
- 12.1.8.1. Company Overview
- 12.1.8.2. Products
- 12.1.8.3. Company Financials
- 12.1.8.4. SWOT Analysis
- 12.1.9 International Business Machines Corporation
- 12.1.9.1. Company Overview
- 12.1.9.2. Products
- 12.1.9.3. Company Financials
- 12.1.9.4. SWOT Analysis
- 12.1.10 Diligent Corporation
- 12.1.10.1. Company Overview
- 12.1.10.2. Products
- 12.1.10.3. Company Financials
- 12.1.10.4. SWOT Analysis
- 12.1.1 Normative
- 12.2. Market Entropy
- 12.2.1 Company's Key Areas Served
- 12.2.2 Recent Developments
- 12.3. Company Market Share Analysis 2025
- 12.3.1 Top 5 Companies Market Share Analysis
- 12.3.2 Top 3 Companies Market Share Analysis
- 12.4. List of Potential Customers
- 13. Research Methodology
List of Figures
- Figure 1: Global Carbon Accounting Market Revenue Breakdown (Million, %) by Region 2025 & 2033
- Figure 2: North America Carbon Accounting Market Revenue (Million), by Type 2025 & 2033
- Figure 3: North America Carbon Accounting Market Revenue Share (%), by Type 2025 & 2033
- Figure 4: North America Carbon Accounting Market Revenue (Million), by End Users 2025 & 2033
- Figure 5: North America Carbon Accounting Market Revenue Share (%), by End Users 2025 & 2033
- Figure 6: North America Carbon Accounting Market Revenue (Million), by Country 2025 & 2033
- Figure 7: North America Carbon Accounting Market Revenue Share (%), by Country 2025 & 2033
- Figure 8: Europe Carbon Accounting Market Revenue (Million), by Type 2025 & 2033
- Figure 9: Europe Carbon Accounting Market Revenue Share (%), by Type 2025 & 2033
- Figure 10: Europe Carbon Accounting Market Revenue (Million), by End Users 2025 & 2033
- Figure 11: Europe Carbon Accounting Market Revenue Share (%), by End Users 2025 & 2033
- Figure 12: Europe Carbon Accounting Market Revenue (Million), by Country 2025 & 2033
- Figure 13: Europe Carbon Accounting Market Revenue Share (%), by Country 2025 & 2033
- Figure 14: Asia Pacific Carbon Accounting Market Revenue (Million), by Type 2025 & 2033
- Figure 15: Asia Pacific Carbon Accounting Market Revenue Share (%), by Type 2025 & 2033
- Figure 16: Asia Pacific Carbon Accounting Market Revenue (Million), by End Users 2025 & 2033
- Figure 17: Asia Pacific Carbon Accounting Market Revenue Share (%), by End Users 2025 & 2033
- Figure 18: Asia Pacific Carbon Accounting Market Revenue (Million), by Country 2025 & 2033
- Figure 19: Asia Pacific Carbon Accounting Market Revenue Share (%), by Country 2025 & 2033
- Figure 20: Middle East and Africa Carbon Accounting Market Revenue (Million), by Type 2025 & 2033
- Figure 21: Middle East and Africa Carbon Accounting Market Revenue Share (%), by Type 2025 & 2033
- Figure 22: Middle East and Africa Carbon Accounting Market Revenue (Million), by End Users 2025 & 2033
- Figure 23: Middle East and Africa Carbon Accounting Market Revenue Share (%), by End Users 2025 & 2033
- Figure 24: Middle East and Africa Carbon Accounting Market Revenue (Million), by Country 2025 & 2033
- Figure 25: Middle East and Africa Carbon Accounting Market Revenue Share (%), by Country 2025 & 2033
- Figure 26: South America Carbon Accounting Market Revenue (Million), by Type 2025 & 2033
- Figure 27: South America Carbon Accounting Market Revenue Share (%), by Type 2025 & 2033
- Figure 28: South America Carbon Accounting Market Revenue (Million), by End Users 2025 & 2033
- Figure 29: South America Carbon Accounting Market Revenue Share (%), by End Users 2025 & 2033
- Figure 30: South America Carbon Accounting Market Revenue (Million), by Country 2025 & 2033
- Figure 31: South America Carbon Accounting Market Revenue Share (%), by Country 2025 & 2033
List of Tables
- Table 1: Global Carbon Accounting Market Revenue Million Forecast, by Type 2020 & 2033
- Table 2: Global Carbon Accounting Market Revenue Million Forecast, by End Users 2020 & 2033
- Table 3: Global Carbon Accounting Market Revenue Million Forecast, by Region 2020 & 2033
- Table 4: Global Carbon Accounting Market Revenue Million Forecast, by Type 2020 & 2033
- Table 5: Global Carbon Accounting Market Revenue Million Forecast, by End Users 2020 & 2033
- Table 6: Global Carbon Accounting Market Revenue Million Forecast, by Country 2020 & 2033
- Table 7: United States Carbon Accounting Market Revenue (Million) Forecast, by Application 2020 & 2033
- Table 8: Canada Carbon Accounting Market Revenue (Million) Forecast, by Application 2020 & 2033
- Table 9: Rest of North America Carbon Accounting Market Revenue (Million) Forecast, by Application 2020 & 2033
- Table 10: Global Carbon Accounting Market Revenue Million Forecast, by Type 2020 & 2033
- Table 11: Global Carbon Accounting Market Revenue Million Forecast, by End Users 2020 & 2033
- Table 12: Global Carbon Accounting Market Revenue Million Forecast, by Country 2020 & 2033
- Table 13: Germany Carbon Accounting Market Revenue (Million) Forecast, by Application 2020 & 2033
- Table 14: France Carbon Accounting Market Revenue (Million) Forecast, by Application 2020 & 2033
- Table 15: United Kingdom Carbon Accounting Market Revenue (Million) Forecast, by Application 2020 & 2033
- Table 16: Italy Carbon Accounting Market Revenue (Million) Forecast, by Application 2020 & 2033
- Table 17: Spain Carbon Accounting Market Revenue (Million) Forecast, by Application 2020 & 2033
- Table 18: NORDIC Carbon Accounting Market Revenue (Million) Forecast, by Application 2020 & 2033
- Table 19: Russia Carbon Accounting Market Revenue (Million) Forecast, by Application 2020 & 2033
- Table 20: Turkey Carbon Accounting Market Revenue (Million) Forecast, by Application 2020 & 2033
- Table 21: Rest of Europe Carbon Accounting Market Revenue (Million) Forecast, by Application 2020 & 2033
- Table 22: Global Carbon Accounting Market Revenue Million Forecast, by Type 2020 & 2033
- Table 23: Global Carbon Accounting Market Revenue Million Forecast, by End Users 2020 & 2033
- Table 24: Global Carbon Accounting Market Revenue Million Forecast, by Country 2020 & 2033
- Table 25: China Carbon Accounting Market Revenue (Million) Forecast, by Application 2020 & 2033
- Table 26: India Carbon Accounting Market Revenue (Million) Forecast, by Application 2020 & 2033
- Table 27: Australia Carbon Accounting Market Revenue (Million) Forecast, by Application 2020 & 2033
- Table 28: Japan Carbon Accounting Market Revenue (Million) Forecast, by Application 2020 & 2033
- Table 29: South Korea Carbon Accounting Market Revenue (Million) Forecast, by Application 2020 & 2033
- Table 30: Malaysia Carbon Accounting Market Revenue (Million) Forecast, by Application 2020 & 2033
- Table 31: Thailand Carbon Accounting Market Revenue (Million) Forecast, by Application 2020 & 2033
- Table 32: Indonesia Carbon Accounting Market Revenue (Million) Forecast, by Application 2020 & 2033
- Table 33: Vietnam Carbon Accounting Market Revenue (Million) Forecast, by Application 2020 & 2033
- Table 34: Rest of Asia Pacific Carbon Accounting Market Revenue (Million) Forecast, by Application 2020 & 2033
- Table 35: Global Carbon Accounting Market Revenue Million Forecast, by Type 2020 & 2033
- Table 36: Global Carbon Accounting Market Revenue Million Forecast, by End Users 2020 & 2033
- Table 37: Global Carbon Accounting Market Revenue Million Forecast, by Country 2020 & 2033
- Table 38: Saudi Arabia Carbon Accounting Market Revenue (Million) Forecast, by Application 2020 & 2033
- Table 39: United Arab Emirates Carbon Accounting Market Revenue (Million) Forecast, by Application 2020 & 2033
- Table 40: Nigeria Carbon Accounting Market Revenue (Million) Forecast, by Application 2020 & 2033
- Table 41: Egypt Carbon Accounting Market Revenue (Million) Forecast, by Application 2020 & 2033
- Table 42: Qatar Carbon Accounting Market Revenue (Million) Forecast, by Application 2020 & 2033
- Table 43: South Africa Carbon Accounting Market Revenue (Million) Forecast, by Application 2020 & 2033
- Table 44: Rest of Middle East and Africa Carbon Accounting Market Revenue (Million) Forecast, by Application 2020 & 2033
- Table 45: Global Carbon Accounting Market Revenue Million Forecast, by Type 2020 & 2033
- Table 46: Global Carbon Accounting Market Revenue Million Forecast, by End Users 2020 & 2033
- Table 47: Global Carbon Accounting Market Revenue Million Forecast, by Country 2020 & 2033
- Table 48: Brazil Carbon Accounting Market Revenue (Million) Forecast, by Application 2020 & 2033
- Table 49: Argentina Carbon Accounting Market Revenue (Million) Forecast, by Application 2020 & 2033
- Table 50: Colombia Carbon Accounting Market Revenue (Million) Forecast, by Application 2020 & 2033
- Table 51: Rest of South America Carbon Accounting Market Revenue (Million) Forecast, by Application 2020 & 2033
Frequently Asked Questions
1. What is the projected Compound Annual Growth Rate (CAGR) of the Carbon Accounting Market?
The projected CAGR is approximately 29.33%.
2. Which companies are prominent players in the Carbon Accounting Market?
Key companies in the market include Normative, Carbon Direct, Greenly, ENGIE Impact, Sphera, SINAI Technologies, Persefoni AI, Emitwise, International Business Machines Corporation, Diligent Corporation.
3. What are the main segments of the Carbon Accounting Market?
The market segments include Type, End Users.
4. Can you provide details about the market size?
The market size is estimated to be USD 16.98 Million as of 2022.
5. What are some drivers contributing to market growth?
4.; Corporate Sustainability Goals4.; Stringent Regultions and Compliance.
6. What are the notable trends driving market growth?
The Power Utilities Segment to Witness Significant Growth.
7. Are there any restraints impacting market growth?
4.; High Complexity in Carbon Accounting.
8. Can you provide examples of recent developments in the market?
March 2024: Greenly, a significant carbon accounting startup, announced that it secured funding for its series B round. The company raised USD 52 million in its Series B round. Investors aim to develop more precise carbon accounting methodologies and accurately deploy these solutions to increase the company’s market share globally.
9. What pricing options are available for accessing the report?
Pricing options include single-user, multi-user, and enterprise licenses priced at USD 4750, USD 5250, and USD 8750 respectively.
10. Is the market size provided in terms of value or volume?
The market size is provided in terms of value, measured in Million.
11. Are there any specific market keywords associated with the report?
Yes, the market keyword associated with the report is "Carbon Accounting Market," which aids in identifying and referencing the specific market segment covered.
12. How do I determine which pricing option suits my needs best?
The pricing options vary based on user requirements and access needs. Individual users may opt for single-user licenses, while businesses requiring broader access may choose multi-user or enterprise licenses for cost-effective access to the report.
13. Are there any additional resources or data provided in the Carbon Accounting Market report?
While the report offers comprehensive insights, it's advisable to review the specific contents or supplementary materials provided to ascertain if additional resources or data are available.
14. How can I stay updated on further developments or reports in the Carbon Accounting Market?
To stay informed about further developments, trends, and reports in the Carbon Accounting Market, consider subscribing to industry newsletters, following relevant companies and organizations, or regularly checking reputable industry news sources and publications.
Methodology
Step 1 - Identification of Relevant Samples Size from Population Database


Step 2 - Approaches for Defining Global Market Size (Value, Volume* & Price*)

Note*: In applicable scenarios
Step 3 - Data Sources
Primary Research
- Web Analytics
- Survey Reports
- Research Institute
- Latest Research Reports
- Opinion Leaders
Secondary Research
- Annual Reports
- White Paper
- Latest Press Release
- Industry Association
- Paid Database
- Investor Presentations

Step 4 - Data Triangulation
Involves using different sources of information in order to increase the validity of a study
These sources are likely to be stakeholders in a program - participants, other researchers, program staff, other community members, and so on.
Then we put all data in single framework & apply various statistical tools to find out the dynamic on the market.
During the analysis stage, feedback from the stakeholder groups would be compared to determine areas of agreement as well as areas of divergence