
Key Insights
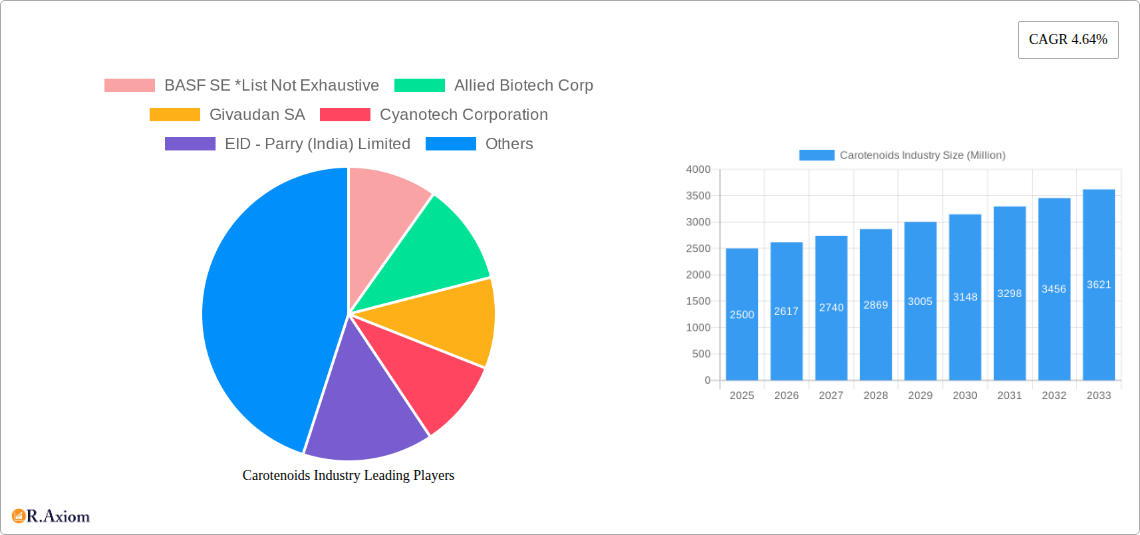
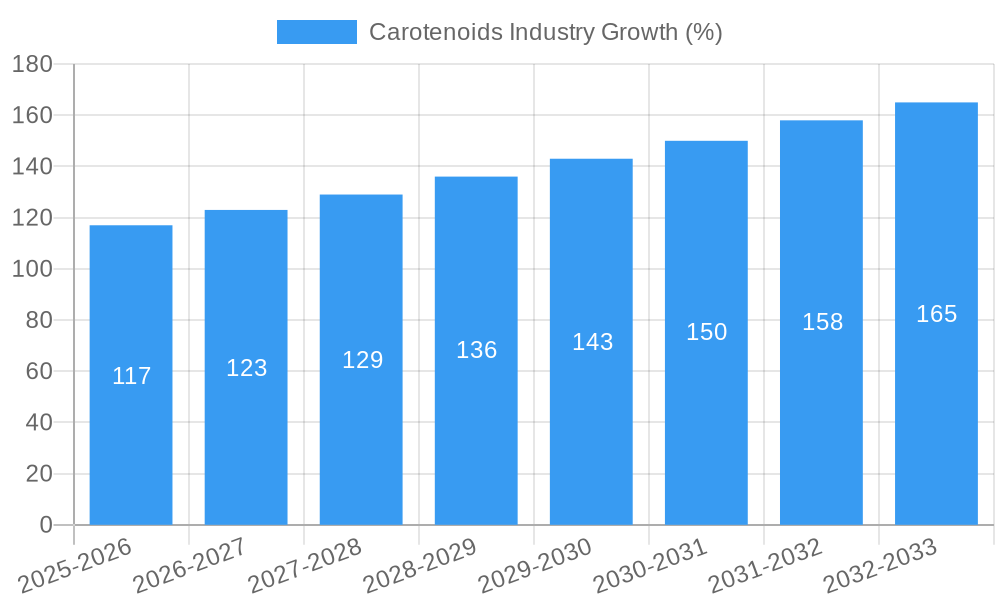
The global carotenoids market, valued at approximately $2.5 billion in 2025, is projected to experience robust growth, driven by increasing demand across diverse sectors. A Compound Annual Growth Rate (CAGR) of 4.64% from 2025 to 2033 indicates a significant expansion, reaching an estimated market value exceeding $3.8 billion by 2033. This growth is fueled by several key factors. The rising consumer awareness of the health benefits associated with carotenoids, particularly their antioxidant and immune-boosting properties, is significantly driving demand in dietary supplements. Furthermore, the expanding food and beverage industry, seeking natural colorants and functional ingredients, is a major contributor to market expansion. The cosmetics industry also utilizes carotenoids for their skin-enhancing and UV-protective capabilities, further boosting market size. Growth in the animal feed sector, driven by the need for natural pigmentation and enhanced nutritional value in animal products, adds another layer to market expansion. While the synthetic carotenoid segment currently holds a larger market share, the increasing preference for natural ingredients across various applications is expected to propel growth in the natural carotenoid segment in the coming years.
However, the market faces certain challenges. Fluctuations in raw material prices and the complexities associated with the extraction and purification of natural carotenoids can impact profitability and overall growth. Regulatory hurdles and stringent quality control measures also pose challenges. Despite these restraints, ongoing research and development efforts focusing on novel extraction techniques, improved bioavailability, and the exploration of new applications are expected to provide opportunities for market expansion. The diversification of carotenoid types, with increased use of astaxanthin, lutein, and lycopene, in addition to beta-carotene, further contributes to the dynamic nature of this market. Geographic expansion, particularly in developing economies with increasing disposable incomes and growing health consciousness, presents considerable potential for future growth. The strategic partnerships and mergers and acquisitions observed among key players indicate a competitive landscape, driving innovation and further expansion within the carotenoids market.
Carotenoids Industry: A Comprehensive Market Analysis (2019-2033)
This in-depth report provides a comprehensive analysis of the Carotenoids industry, offering crucial insights into market dynamics, competitive landscapes, and future growth prospects. Covering the period from 2019 to 2033, with a focus on 2025, this report is essential for industry stakeholders, investors, and strategic decision-makers seeking a clear understanding of this dynamic sector. The report utilizes data and projections to deliver actionable intelligence for informed business strategies.
Carotenoids Industry Market Concentration & Innovation
The global carotenoids market exhibits a moderately concentrated structure, with several multinational corporations holding significant market share. Key players like BASF SE, Koninklijke DSM NV, and Givaudan SA dominate the landscape, leveraging their established distribution networks and extensive R&D capabilities. However, smaller players and regional producers are also making inroads, particularly in the natural carotenoid segment. The market share of these leading companies fluctuates based on product innovations, strategic partnerships, and shifts in consumer demand. Several key factors drive innovation within the industry:
- Growing demand for natural and clean-label products: This pushes companies to develop sustainable and environmentally friendly extraction and production methods.
- Stringent regulatory frameworks: These require companies to demonstrate the safety and efficacy of their products, driving innovation in quality control and analytical techniques.
- Development of novel applications: Continuous research expands the use of carotenoids beyond traditional applications into new areas like pharmaceuticals and cosmetics.
- Technological advancements in extraction and synthesis: These improve efficiency, reduce costs, and enable the production of higher-quality carotenoids.
- Mergers and acquisitions (M&A): The past five years have witnessed several significant M&A activities, with deal values reaching xx Million in the aggregate, as larger players seek to expand their market presence and product portfolios.
Carotenoids Industry Industry Trends & Insights
The global carotenoids market is experiencing robust growth, with a projected Compound Annual Growth Rate (CAGR) of xx% during the forecast period (2025-2033). This growth is driven by several key factors:
- Rising consumer awareness of health and wellness: Increased demand for functional foods and dietary supplements enriched with carotenoids.
- Growing applications in the food and beverage industry: Carotenoids are increasingly used as natural colorants and antioxidants in various food products.
- Expansion of the animal feed industry: Carotenoids are essential for improving animal health, pigmentation, and productivity.
- Technological advancements in production and extraction: Leading to increased efficiency, reduced costs, and improved product quality.
- Market penetration of natural carotenoids is increasing due to consumer preference for natural ingredients. This shift is expected to significantly influence the overall market trends in the years to come. The market penetration of natural carotenoids is projected to reach xx% by 2033, driven by rising health concerns and sustainability initiatives.
Despite this positive outlook, the competitive landscape is fierce, with established players continuously innovating to maintain market share and new entrants aiming to disrupt the market with differentiated products or services. This dynamic environment necessitates strategic agility and adaptation to market changes.
Dominant Markets & Segments in Carotenoids Industry
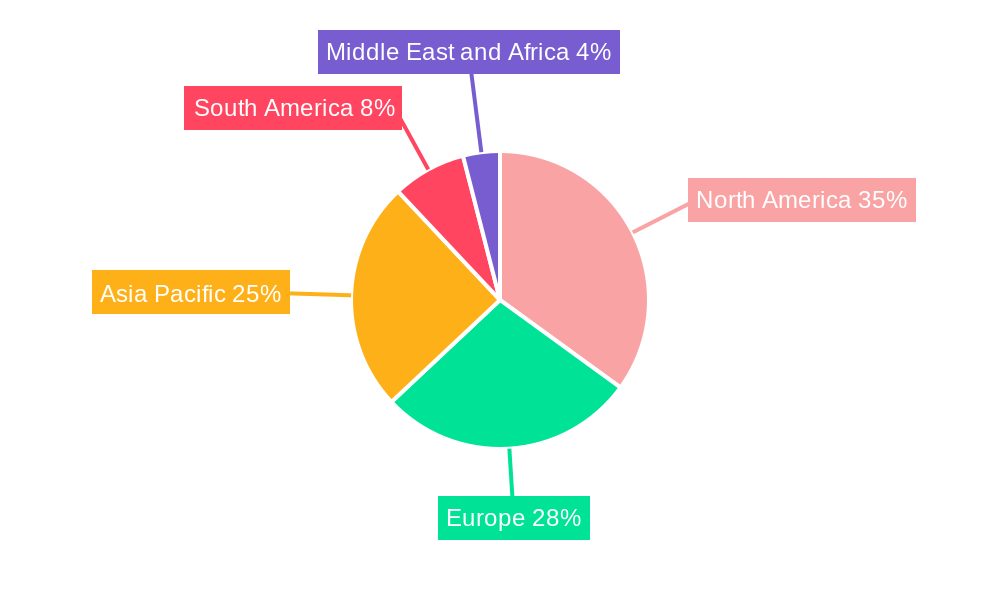
The carotenoids market is geographically diverse, with significant presence across North America, Europe, and Asia-Pacific. However, the Asia-Pacific region is expected to dominate the market due to the following reasons:
Rapidly growing economies and increasing disposable incomes: Fuelling higher demand for food and beverage products, including those enriched with carotenoids.
Expanding population and changing dietary habits: Leading to increased consumption of nutrient-rich products.
Favorable government policies and regulatory environment: Encouraging the growth of the food and beverage industry.
Leading Segment by Type: Beta-carotene holds the largest market share due to its extensive applications in food, feed, and dietary supplements.
Leading Segment by Source: The natural carotenoids segment demonstrates robust growth due to the rising demand for natural and clean-label products.
Leading Segment by Application: The Food & Beverages segment is the largest application area for carotenoids, driven by the increasing use of natural colors and antioxidants.
Carotenoids Industry Product Developments
Recent innovations focus on enhancing the bioavailability, stability, and delivery of carotenoids. New product formulations include microencapsulated and liposomal carotenoids, improving their effectiveness and shelf life. Companies are also exploring novel extraction and production methods to achieve higher purity and yield, while minimizing environmental impact. This focus on sustainability and improved product performance aligns with evolving market demands.
Report Scope & Segmentation Analysis
This report segments the carotenoids market by type (Annatto, Astaxanthin, Beta-carotene, Canthaxanthin, Lutein, Lycopene, Zeaxanthin, Other Types), source (Natural, Synthetic), and application (Animal Feed, Food & Beverages, Dietary Supplements, Cosmetics, Pharmaceuticals). Each segment is analyzed based on historical data (2019-2024), estimated values (2025), and forecast data (2025-2033), providing a comprehensive market overview. Market size, growth projections, and competitive dynamics for each segment are assessed. Growth is expected across all segments, reflecting the rising demand for carotenoids in diverse applications.
Key Drivers of Carotenoids Industry Growth
The carotenoids industry’s growth is driven by several factors: The escalating demand for natural food colorants and antioxidants, coupled with increasing health consciousness and awareness of carotenoid benefits. Technological advancements in extraction and synthesis methods are reducing production costs and improving product quality, further propelling growth. Moreover, favourable regulatory landscapes in several key markets are stimulating industry expansion. The increasing use of carotenoids in animal feed to enhance pigmentation and health also contributes to industry growth.
Challenges in the Carotenoids Industry Sector
The industry faces challenges such as fluctuating raw material prices, stringent regulatory requirements, and intense competition among players. Supply chain disruptions can impact production costs and availability. Maintaining product quality and ensuring consistent supply are critical factors for success in this sector. The competitive intensity requires constant innovation and cost optimization strategies to maintain profitability.
Emerging Opportunities in Carotenoids Industry
Emerging opportunities lie in the exploration of novel applications for carotenoids in nutraceuticals, pharmaceuticals, and cosmetics. The rising demand for personalized nutrition and targeted health solutions opens doors for innovative product development. Further research into the health benefits of carotenoids and the development of new delivery systems can expand market reach and create new revenue streams.
Leading Players in the Carotenoids Industry Market
- BASF SE
- Allied Biotech Corp
- Givaudan SA
- Cyanotech Corporation
- EID - Parry (India) Limited
- Döhler Group SE
- Sensient Technologies Co
- Koninklijke DSM NV
- The Solabia Group
- Divi's Laboratories Limited
Key Developments in Carotenoids Industry Industry
- November 2022: DSM partnered with LBB Specialties for dietary supplement distribution in North America, expanding market reach and product development.
- June 2023: Divi's Nutraceuticals launched AstaBead, a novel astaxanthin product, showcasing innovative delivery systems.
- August 2023: Divi's showcased cutting-edge novel applications at FI South America 2023, addressing consumer demand for cleaner labels.
Strategic Outlook for Carotenoids Industry Market
The carotenoids market is poised for continued growth, fueled by strong demand from diverse sectors. Innovation in product delivery, coupled with a growing emphasis on natural and sustainable sourcing, will be crucial factors in shaping future market dynamics. Expanding into new applications and geographic markets presents significant opportunities for industry players. The focus on personalized nutrition and health solutions will continue to drive product development and market expansion.
Carotenoids Industry Segmentation
-
1. Type
- 1.1. Annatto
- 1.2. Astaxanthin
- 1.3. Beta Carotene
- 1.4. Canthaxanthin
- 1.5. Lutein
- 1.6. Lycopene
- 1.7. Zeaxanthin
- 1.8. Other Types
-
2. Source
- 2.1. Natural
- 2.2. Synthetic
-
3. Application
- 3.1. Animal Feed
- 3.2. Food and Beverages
- 3.3. Dietary Supplements
- 3.4. Cosmetics
- 3.5. Pharmaceuticals
Carotenoids Industry Segmentation By Geography
-
1. North America
- 1.1. United States
- 1.2. Canada
- 1.3. Mexico
- 1.4. Rest of North America
-
2. Europe
- 2.1. United Kingdom
- 2.2. Germany
- 2.3. France
- 2.4. Russia
- 2.5. Italy
- 2.6. Spain
- 2.7. Rest of Europe
-
3. Asia Pacific
- 3.1. India
- 3.2. China
- 3.3. Japan
- 3.4. Australia
- 3.5. Rest of Asia Pacific
-
4. South America
- 4.1. Brazil
- 4.2. Argentina
- 4.3. Rest of South America
-
5. Middle East and Africa
- 5.1. South Africa
- 5.2. Saudi Arabia
- 5.3. Rest of Middle East and Africa
Carotenoids Industry REPORT HIGHLIGHTS
| Aspects | Details |
|---|---|
| Study Period | 2019-2033 |
| Base Year | 2024 |
| Estimated Year | 2025 |
| Forecast Period | 2025-2033 |
| Historical Period | 2019-2024 |
| Growth Rate | CAGR of 4.64% from 2019-2033 |
| Segmentation |
|
Table of Contents
- 1. Introduction
- 1.1. Research Scope
- 1.2. Market Segmentation
- 1.3. Research Methodology
- 1.4. Definitions and Assumptions
- 2. Executive Summary
- 2.1. Introduction
- 3. Market Dynamics
- 3.1. Introduction
- 3.2. Market Drivers
- 3.2.1. Growing Awareness of Functional Benefits of Carotenoids; Consumption of Health and Wellness Products
- 3.3. Market Restrains
- 3.3.1. High Processing Cost and Low Yield of Natural Food Colors
- 3.4. Market Trends
- 3.4.1. Rise of Health and Wellness Products
- 4. Market Factor Analysis
- 4.1. Porters Five Forces
- 4.2. Supply/Value Chain
- 4.3. PESTEL analysis
- 4.4. Market Entropy
- 4.5. Patent/Trademark Analysis
- 5. Global Carotenoids Industry Analysis, Insights and Forecast, 2019-2031
- 5.1. Market Analysis, Insights and Forecast - by Type
- 5.1.1. Annatto
- 5.1.2. Astaxanthin
- 5.1.3. Beta Carotene
- 5.1.4. Canthaxanthin
- 5.1.5. Lutein
- 5.1.6. Lycopene
- 5.1.7. Zeaxanthin
- 5.1.8. Other Types
- 5.2. Market Analysis, Insights and Forecast - by Source
- 5.2.1. Natural
- 5.2.2. Synthetic
- 5.3. Market Analysis, Insights and Forecast - by Application
- 5.3.1. Animal Feed
- 5.3.2. Food and Beverages
- 5.3.3. Dietary Supplements
- 5.3.4. Cosmetics
- 5.3.5. Pharmaceuticals
- 5.4. Market Analysis, Insights and Forecast - by Region
- 5.4.1. North America
- 5.4.2. Europe
- 5.4.3. Asia Pacific
- 5.4.4. South America
- 5.4.5. Middle East and Africa
- 5.1. Market Analysis, Insights and Forecast - by Type
- 6. North America Carotenoids Industry Analysis, Insights and Forecast, 2019-2031
- 6.1. Market Analysis, Insights and Forecast - by Type
- 6.1.1. Annatto
- 6.1.2. Astaxanthin
- 6.1.3. Beta Carotene
- 6.1.4. Canthaxanthin
- 6.1.5. Lutein
- 6.1.6. Lycopene
- 6.1.7. Zeaxanthin
- 6.1.8. Other Types
- 6.2. Market Analysis, Insights and Forecast - by Source
- 6.2.1. Natural
- 6.2.2. Synthetic
- 6.3. Market Analysis, Insights and Forecast - by Application
- 6.3.1. Animal Feed
- 6.3.2. Food and Beverages
- 6.3.3. Dietary Supplements
- 6.3.4. Cosmetics
- 6.3.5. Pharmaceuticals
- 6.1. Market Analysis, Insights and Forecast - by Type
- 7. Europe Carotenoids Industry Analysis, Insights and Forecast, 2019-2031
- 7.1. Market Analysis, Insights and Forecast - by Type
- 7.1.1. Annatto
- 7.1.2. Astaxanthin
- 7.1.3. Beta Carotene
- 7.1.4. Canthaxanthin
- 7.1.5. Lutein
- 7.1.6. Lycopene
- 7.1.7. Zeaxanthin
- 7.1.8. Other Types
- 7.2. Market Analysis, Insights and Forecast - by Source
- 7.2.1. Natural
- 7.2.2. Synthetic
- 7.3. Market Analysis, Insights and Forecast - by Application
- 7.3.1. Animal Feed
- 7.3.2. Food and Beverages
- 7.3.3. Dietary Supplements
- 7.3.4. Cosmetics
- 7.3.5. Pharmaceuticals
- 7.1. Market Analysis, Insights and Forecast - by Type
- 8. Asia Pacific Carotenoids Industry Analysis, Insights and Forecast, 2019-2031
- 8.1. Market Analysis, Insights and Forecast - by Type
- 8.1.1. Annatto
- 8.1.2. Astaxanthin
- 8.1.3. Beta Carotene
- 8.1.4. Canthaxanthin
- 8.1.5. Lutein
- 8.1.6. Lycopene
- 8.1.7. Zeaxanthin
- 8.1.8. Other Types
- 8.2. Market Analysis, Insights and Forecast - by Source
- 8.2.1. Natural
- 8.2.2. Synthetic
- 8.3. Market Analysis, Insights and Forecast - by Application
- 8.3.1. Animal Feed
- 8.3.2. Food and Beverages
- 8.3.3. Dietary Supplements
- 8.3.4. Cosmetics
- 8.3.5. Pharmaceuticals
- 8.1. Market Analysis, Insights and Forecast - by Type
- 9. South America Carotenoids Industry Analysis, Insights and Forecast, 2019-2031
- 9.1. Market Analysis, Insights and Forecast - by Type
- 9.1.1. Annatto
- 9.1.2. Astaxanthin
- 9.1.3. Beta Carotene
- 9.1.4. Canthaxanthin
- 9.1.5. Lutein
- 9.1.6. Lycopene
- 9.1.7. Zeaxanthin
- 9.1.8. Other Types
- 9.2. Market Analysis, Insights and Forecast - by Source
- 9.2.1. Natural
- 9.2.2. Synthetic
- 9.3. Market Analysis, Insights and Forecast - by Application
- 9.3.1. Animal Feed
- 9.3.2. Food and Beverages
- 9.3.3. Dietary Supplements
- 9.3.4. Cosmetics
- 9.3.5. Pharmaceuticals
- 9.1. Market Analysis, Insights and Forecast - by Type
- 10. Middle East and Africa Carotenoids Industry Analysis, Insights and Forecast, 2019-2031
- 10.1. Market Analysis, Insights and Forecast - by Type
- 10.1.1. Annatto
- 10.1.2. Astaxanthin
- 10.1.3. Beta Carotene
- 10.1.4. Canthaxanthin
- 10.1.5. Lutein
- 10.1.6. Lycopene
- 10.1.7. Zeaxanthin
- 10.1.8. Other Types
- 10.2. Market Analysis, Insights and Forecast - by Source
- 10.2.1. Natural
- 10.2.2. Synthetic
- 10.3. Market Analysis, Insights and Forecast - by Application
- 10.3.1. Animal Feed
- 10.3.2. Food and Beverages
- 10.3.3. Dietary Supplements
- 10.3.4. Cosmetics
- 10.3.5. Pharmaceuticals
- 10.1. Market Analysis, Insights and Forecast - by Type
- 11. North America Carotenoids Industry Analysis, Insights and Forecast, 2019-2031
- 11.1. Market Analysis, Insights and Forecast - By Country/Sub-region
- 11.1.1 United States
- 11.1.2 Canada
- 11.1.3 Mexico
- 11.1.4 Rest of North America
- 12. Europe Carotenoids Industry Analysis, Insights and Forecast, 2019-2031
- 12.1. Market Analysis, Insights and Forecast - By Country/Sub-region
- 12.1.1 United Kingdom
- 12.1.2 Germany
- 12.1.3 France
- 12.1.4 Russia
- 12.1.5 Italy
- 12.1.6 Spain
- 12.1.7 Rest of Europe
- 13. Asia Pacific Carotenoids Industry Analysis, Insights and Forecast, 2019-2031
- 13.1. Market Analysis, Insights and Forecast - By Country/Sub-region
- 13.1.1 India
- 13.1.2 China
- 13.1.3 Japan
- 13.1.4 Australia
- 13.1.5 Rest of Asia Pacific
- 14. South America Carotenoids Industry Analysis, Insights and Forecast, 2019-2031
- 14.1. Market Analysis, Insights and Forecast - By Country/Sub-region
- 14.1.1 Brazil
- 14.1.2 Argentina
- 14.1.3 Rest of South America
- 15. Middle East and Africa Carotenoids Industry Analysis, Insights and Forecast, 2019-2031
- 15.1. Market Analysis, Insights and Forecast - By Country/Sub-region
- 15.1.1 South Africa
- 15.1.2 Saudi Arabia
- 15.1.3 Rest of Middle East and Africa
- 16. Competitive Analysis
- 16.1. Global Market Share Analysis 2024
- 16.2. Company Profiles
- 16.2.1 BASF SE *List Not Exhaustive
- 16.2.1.1. Overview
- 16.2.1.2. Products
- 16.2.1.3. SWOT Analysis
- 16.2.1.4. Recent Developments
- 16.2.1.5. Financials (Based on Availability)
- 16.2.2 Allied Biotech Corp
- 16.2.2.1. Overview
- 16.2.2.2. Products
- 16.2.2.3. SWOT Analysis
- 16.2.2.4. Recent Developments
- 16.2.2.5. Financials (Based on Availability)
- 16.2.3 Givaudan SA
- 16.2.3.1. Overview
- 16.2.3.2. Products
- 16.2.3.3. SWOT Analysis
- 16.2.3.4. Recent Developments
- 16.2.3.5. Financials (Based on Availability)
- 16.2.4 Cyanotech Corporation
- 16.2.4.1. Overview
- 16.2.4.2. Products
- 16.2.4.3. SWOT Analysis
- 16.2.4.4. Recent Developments
- 16.2.4.5. Financials (Based on Availability)
- 16.2.5 EID - Parry (India) Limited
- 16.2.5.1. Overview
- 16.2.5.2. Products
- 16.2.5.3. SWOT Analysis
- 16.2.5.4. Recent Developments
- 16.2.5.5. Financials (Based on Availability)
- 16.2.6 Döhler Group SE
- 16.2.6.1. Overview
- 16.2.6.2. Products
- 16.2.6.3. SWOT Analysis
- 16.2.6.4. Recent Developments
- 16.2.6.5. Financials (Based on Availability)
- 16.2.7 Sensient Technologies Co
- 16.2.7.1. Overview
- 16.2.7.2. Products
- 16.2.7.3. SWOT Analysis
- 16.2.7.4. Recent Developments
- 16.2.7.5. Financials (Based on Availability)
- 16.2.8 Koninklijke DSM NV
- 16.2.8.1. Overview
- 16.2.8.2. Products
- 16.2.8.3. SWOT Analysis
- 16.2.8.4. Recent Developments
- 16.2.8.5. Financials (Based on Availability)
- 16.2.9 The Solabia Group
- 16.2.9.1. Overview
- 16.2.9.2. Products
- 16.2.9.3. SWOT Analysis
- 16.2.9.4. Recent Developments
- 16.2.9.5. Financials (Based on Availability)
- 16.2.10 Divi's Laboratories Limited
- 16.2.10.1. Overview
- 16.2.10.2. Products
- 16.2.10.3. SWOT Analysis
- 16.2.10.4. Recent Developments
- 16.2.10.5. Financials (Based on Availability)
- 16.2.1 BASF SE *List Not Exhaustive
List of Figures
- Figure 1: Global Carotenoids Industry Revenue Breakdown (Million, %) by Region 2024 & 2032
- Figure 2: North America Carotenoids Industry Revenue (Million), by Country 2024 & 2032
- Figure 3: North America Carotenoids Industry Revenue Share (%), by Country 2024 & 2032
- Figure 4: Europe Carotenoids Industry Revenue (Million), by Country 2024 & 2032
- Figure 5: Europe Carotenoids Industry Revenue Share (%), by Country 2024 & 2032
- Figure 6: Asia Pacific Carotenoids Industry Revenue (Million), by Country 2024 & 2032
- Figure 7: Asia Pacific Carotenoids Industry Revenue Share (%), by Country 2024 & 2032
- Figure 8: South America Carotenoids Industry Revenue (Million), by Country 2024 & 2032
- Figure 9: South America Carotenoids Industry Revenue Share (%), by Country 2024 & 2032
- Figure 10: Middle East and Africa Carotenoids Industry Revenue (Million), by Country 2024 & 2032
- Figure 11: Middle East and Africa Carotenoids Industry Revenue Share (%), by Country 2024 & 2032
- Figure 12: North America Carotenoids Industry Revenue (Million), by Type 2024 & 2032
- Figure 13: North America Carotenoids Industry Revenue Share (%), by Type 2024 & 2032
- Figure 14: North America Carotenoids Industry Revenue (Million), by Source 2024 & 2032
- Figure 15: North America Carotenoids Industry Revenue Share (%), by Source 2024 & 2032
- Figure 16: North America Carotenoids Industry Revenue (Million), by Application 2024 & 2032
- Figure 17: North America Carotenoids Industry Revenue Share (%), by Application 2024 & 2032
- Figure 18: North America Carotenoids Industry Revenue (Million), by Country 2024 & 2032
- Figure 19: North America Carotenoids Industry Revenue Share (%), by Country 2024 & 2032
- Figure 20: Europe Carotenoids Industry Revenue (Million), by Type 2024 & 2032
- Figure 21: Europe Carotenoids Industry Revenue Share (%), by Type 2024 & 2032
- Figure 22: Europe Carotenoids Industry Revenue (Million), by Source 2024 & 2032
- Figure 23: Europe Carotenoids Industry Revenue Share (%), by Source 2024 & 2032
- Figure 24: Europe Carotenoids Industry Revenue (Million), by Application 2024 & 2032
- Figure 25: Europe Carotenoids Industry Revenue Share (%), by Application 2024 & 2032
- Figure 26: Europe Carotenoids Industry Revenue (Million), by Country 2024 & 2032
- Figure 27: Europe Carotenoids Industry Revenue Share (%), by Country 2024 & 2032
- Figure 28: Asia Pacific Carotenoids Industry Revenue (Million), by Type 2024 & 2032
- Figure 29: Asia Pacific Carotenoids Industry Revenue Share (%), by Type 2024 & 2032
- Figure 30: Asia Pacific Carotenoids Industry Revenue (Million), by Source 2024 & 2032
- Figure 31: Asia Pacific Carotenoids Industry Revenue Share (%), by Source 2024 & 2032
- Figure 32: Asia Pacific Carotenoids Industry Revenue (Million), by Application 2024 & 2032
- Figure 33: Asia Pacific Carotenoids Industry Revenue Share (%), by Application 2024 & 2032
- Figure 34: Asia Pacific Carotenoids Industry Revenue (Million), by Country 2024 & 2032
- Figure 35: Asia Pacific Carotenoids Industry Revenue Share (%), by Country 2024 & 2032
- Figure 36: South America Carotenoids Industry Revenue (Million), by Type 2024 & 2032
- Figure 37: South America Carotenoids Industry Revenue Share (%), by Type 2024 & 2032
- Figure 38: South America Carotenoids Industry Revenue (Million), by Source 2024 & 2032
- Figure 39: South America Carotenoids Industry Revenue Share (%), by Source 2024 & 2032
- Figure 40: South America Carotenoids Industry Revenue (Million), by Application 2024 & 2032
- Figure 41: South America Carotenoids Industry Revenue Share (%), by Application 2024 & 2032
- Figure 42: South America Carotenoids Industry Revenue (Million), by Country 2024 & 2032
- Figure 43: South America Carotenoids Industry Revenue Share (%), by Country 2024 & 2032
- Figure 44: Middle East and Africa Carotenoids Industry Revenue (Million), by Type 2024 & 2032
- Figure 45: Middle East and Africa Carotenoids Industry Revenue Share (%), by Type 2024 & 2032
- Figure 46: Middle East and Africa Carotenoids Industry Revenue (Million), by Source 2024 & 2032
- Figure 47: Middle East and Africa Carotenoids Industry Revenue Share (%), by Source 2024 & 2032
- Figure 48: Middle East and Africa Carotenoids Industry Revenue (Million), by Application 2024 & 2032
- Figure 49: Middle East and Africa Carotenoids Industry Revenue Share (%), by Application 2024 & 2032
- Figure 50: Middle East and Africa Carotenoids Industry Revenue (Million), by Country 2024 & 2032
- Figure 51: Middle East and Africa Carotenoids Industry Revenue Share (%), by Country 2024 & 2032
List of Tables
- Table 1: Global Carotenoids Industry Revenue Million Forecast, by Region 2019 & 2032
- Table 2: Global Carotenoids Industry Revenue Million Forecast, by Type 2019 & 2032
- Table 3: Global Carotenoids Industry Revenue Million Forecast, by Source 2019 & 2032
- Table 4: Global Carotenoids Industry Revenue Million Forecast, by Application 2019 & 2032
- Table 5: Global Carotenoids Industry Revenue Million Forecast, by Region 2019 & 2032
- Table 6: Global Carotenoids Industry Revenue Million Forecast, by Country 2019 & 2032
- Table 7: United States Carotenoids Industry Revenue (Million) Forecast, by Application 2019 & 2032
- Table 8: Canada Carotenoids Industry Revenue (Million) Forecast, by Application 2019 & 2032
- Table 9: Mexico Carotenoids Industry Revenue (Million) Forecast, by Application 2019 & 2032
- Table 10: Rest of North America Carotenoids Industry Revenue (Million) Forecast, by Application 2019 & 2032
- Table 11: Global Carotenoids Industry Revenue Million Forecast, by Country 2019 & 2032
- Table 12: United Kingdom Carotenoids Industry Revenue (Million) Forecast, by Application 2019 & 2032
- Table 13: Germany Carotenoids Industry Revenue (Million) Forecast, by Application 2019 & 2032
- Table 14: France Carotenoids Industry Revenue (Million) Forecast, by Application 2019 & 2032
- Table 15: Russia Carotenoids Industry Revenue (Million) Forecast, by Application 2019 & 2032
- Table 16: Italy Carotenoids Industry Revenue (Million) Forecast, by Application 2019 & 2032
- Table 17: Spain Carotenoids Industry Revenue (Million) Forecast, by Application 2019 & 2032
- Table 18: Rest of Europe Carotenoids Industry Revenue (Million) Forecast, by Application 2019 & 2032
- Table 19: Global Carotenoids Industry Revenue Million Forecast, by Country 2019 & 2032
- Table 20: India Carotenoids Industry Revenue (Million) Forecast, by Application 2019 & 2032
- Table 21: China Carotenoids Industry Revenue (Million) Forecast, by Application 2019 & 2032
- Table 22: Japan Carotenoids Industry Revenue (Million) Forecast, by Application 2019 & 2032
- Table 23: Australia Carotenoids Industry Revenue (Million) Forecast, by Application 2019 & 2032
- Table 24: Rest of Asia Pacific Carotenoids Industry Revenue (Million) Forecast, by Application 2019 & 2032
- Table 25: Global Carotenoids Industry Revenue Million Forecast, by Country 2019 & 2032
- Table 26: Brazil Carotenoids Industry Revenue (Million) Forecast, by Application 2019 & 2032
- Table 27: Argentina Carotenoids Industry Revenue (Million) Forecast, by Application 2019 & 2032
- Table 28: Rest of South America Carotenoids Industry Revenue (Million) Forecast, by Application 2019 & 2032
- Table 29: Global Carotenoids Industry Revenue Million Forecast, by Country 2019 & 2032
- Table 30: South Africa Carotenoids Industry Revenue (Million) Forecast, by Application 2019 & 2032
- Table 31: Saudi Arabia Carotenoids Industry Revenue (Million) Forecast, by Application 2019 & 2032
- Table 32: Rest of Middle East and Africa Carotenoids Industry Revenue (Million) Forecast, by Application 2019 & 2032
- Table 33: Global Carotenoids Industry Revenue Million Forecast, by Type 2019 & 2032
- Table 34: Global Carotenoids Industry Revenue Million Forecast, by Source 2019 & 2032
- Table 35: Global Carotenoids Industry Revenue Million Forecast, by Application 2019 & 2032
- Table 36: Global Carotenoids Industry Revenue Million Forecast, by Country 2019 & 2032
- Table 37: United States Carotenoids Industry Revenue (Million) Forecast, by Application 2019 & 2032
- Table 38: Canada Carotenoids Industry Revenue (Million) Forecast, by Application 2019 & 2032
- Table 39: Mexico Carotenoids Industry Revenue (Million) Forecast, by Application 2019 & 2032
- Table 40: Rest of North America Carotenoids Industry Revenue (Million) Forecast, by Application 2019 & 2032
- Table 41: Global Carotenoids Industry Revenue Million Forecast, by Type 2019 & 2032
- Table 42: Global Carotenoids Industry Revenue Million Forecast, by Source 2019 & 2032
- Table 43: Global Carotenoids Industry Revenue Million Forecast, by Application 2019 & 2032
- Table 44: Global Carotenoids Industry Revenue Million Forecast, by Country 2019 & 2032
- Table 45: United Kingdom Carotenoids Industry Revenue (Million) Forecast, by Application 2019 & 2032
- Table 46: Germany Carotenoids Industry Revenue (Million) Forecast, by Application 2019 & 2032
- Table 47: France Carotenoids Industry Revenue (Million) Forecast, by Application 2019 & 2032
- Table 48: Russia Carotenoids Industry Revenue (Million) Forecast, by Application 2019 & 2032
- Table 49: Italy Carotenoids Industry Revenue (Million) Forecast, by Application 2019 & 2032
- Table 50: Spain Carotenoids Industry Revenue (Million) Forecast, by Application 2019 & 2032
- Table 51: Rest of Europe Carotenoids Industry Revenue (Million) Forecast, by Application 2019 & 2032
- Table 52: Global Carotenoids Industry Revenue Million Forecast, by Type 2019 & 2032
- Table 53: Global Carotenoids Industry Revenue Million Forecast, by Source 2019 & 2032
- Table 54: Global Carotenoids Industry Revenue Million Forecast, by Application 2019 & 2032
- Table 55: Global Carotenoids Industry Revenue Million Forecast, by Country 2019 & 2032
- Table 56: India Carotenoids Industry Revenue (Million) Forecast, by Application 2019 & 2032
- Table 57: China Carotenoids Industry Revenue (Million) Forecast, by Application 2019 & 2032
- Table 58: Japan Carotenoids Industry Revenue (Million) Forecast, by Application 2019 & 2032
- Table 59: Australia Carotenoids Industry Revenue (Million) Forecast, by Application 2019 & 2032
- Table 60: Rest of Asia Pacific Carotenoids Industry Revenue (Million) Forecast, by Application 2019 & 2032
- Table 61: Global Carotenoids Industry Revenue Million Forecast, by Type 2019 & 2032
- Table 62: Global Carotenoids Industry Revenue Million Forecast, by Source 2019 & 2032
- Table 63: Global Carotenoids Industry Revenue Million Forecast, by Application 2019 & 2032
- Table 64: Global Carotenoids Industry Revenue Million Forecast, by Country 2019 & 2032
- Table 65: Brazil Carotenoids Industry Revenue (Million) Forecast, by Application 2019 & 2032
- Table 66: Argentina Carotenoids Industry Revenue (Million) Forecast, by Application 2019 & 2032
- Table 67: Rest of South America Carotenoids Industry Revenue (Million) Forecast, by Application 2019 & 2032
- Table 68: Global Carotenoids Industry Revenue Million Forecast, by Type 2019 & 2032
- Table 69: Global Carotenoids Industry Revenue Million Forecast, by Source 2019 & 2032
- Table 70: Global Carotenoids Industry Revenue Million Forecast, by Application 2019 & 2032
- Table 71: Global Carotenoids Industry Revenue Million Forecast, by Country 2019 & 2032
- Table 72: South Africa Carotenoids Industry Revenue (Million) Forecast, by Application 2019 & 2032
- Table 73: Saudi Arabia Carotenoids Industry Revenue (Million) Forecast, by Application 2019 & 2032
- Table 74: Rest of Middle East and Africa Carotenoids Industry Revenue (Million) Forecast, by Application 2019 & 2032
Frequently Asked Questions
1. What is the projected Compound Annual Growth Rate (CAGR) of the Carotenoids Industry?
The projected CAGR is approximately 4.64%.
2. Which companies are prominent players in the Carotenoids Industry?
Key companies in the market include BASF SE *List Not Exhaustive, Allied Biotech Corp, Givaudan SA, Cyanotech Corporation, EID - Parry (India) Limited, Döhler Group SE, Sensient Technologies Co, Koninklijke DSM NV, The Solabia Group, Divi's Laboratories Limited.
3. What are the main segments of the Carotenoids Industry?
The market segments include Type, Source, Application.
4. Can you provide details about the market size?
The market size is estimated to be USD XX Million as of 2022.
5. What are some drivers contributing to market growth?
Growing Awareness of Functional Benefits of Carotenoids; Consumption of Health and Wellness Products.
6. What are the notable trends driving market growth?
Rise of Health and Wellness Products.
7. Are there any restraints impacting market growth?
High Processing Cost and Low Yield of Natural Food Colors.
8. Can you provide examples of recent developments in the market?
August 2023: Divi's unveiled its cutting-edge Novel Application innovations at FI South America 2023. These groundbreaking advancements were originally conceived in June 2022 to meet the rising consumer demand for products with fewer additives.
9. What pricing options are available for accessing the report?
Pricing options include single-user, multi-user, and enterprise licenses priced at USD 4750, USD 5250, and USD 8750 respectively.
10. Is the market size provided in terms of value or volume?
The market size is provided in terms of value, measured in Million.
11. Are there any specific market keywords associated with the report?
Yes, the market keyword associated with the report is "Carotenoids Industry," which aids in identifying and referencing the specific market segment covered.
12. How do I determine which pricing option suits my needs best?
The pricing options vary based on user requirements and access needs. Individual users may opt for single-user licenses, while businesses requiring broader access may choose multi-user or enterprise licenses for cost-effective access to the report.
13. Are there any additional resources or data provided in the Carotenoids Industry report?
While the report offers comprehensive insights, it's advisable to review the specific contents or supplementary materials provided to ascertain if additional resources or data are available.
14. How can I stay updated on further developments or reports in the Carotenoids Industry?
To stay informed about further developments, trends, and reports in the Carotenoids Industry, consider subscribing to industry newsletters, following relevant companies and organizations, or regularly checking reputable industry news sources and publications.
Methodology
Step 1 - Identification of Relevant Samples Size from Population Database


Step 2 - Approaches for Defining Global Market Size (Value, Volume* & Price*)

Note*: In applicable scenarios
Step 3 - Data Sources
Primary Research
- Web Analytics
- Survey Reports
- Research Institute
- Latest Research Reports
- Opinion Leaders
Secondary Research
- Annual Reports
- White Paper
- Latest Press Release
- Industry Association
- Paid Database
- Investor Presentations

Step 4 - Data Triangulation
Involves using different sources of information in order to increase the validity of a study
These sources are likely to be stakeholders in a program - participants, other researchers, program staff, other community members, and so on.
Then we put all data in single framework & apply various statistical tools to find out the dynamic on the market.
During the analysis stage, feedback from the stakeholder groups would be compared to determine areas of agreement as well as areas of divergence


