

Key Insights
The global centrifugal pump market is poised for significant expansion, driven by escalating demand across key industrial sectors. The market is projected to reach $33.7 billion by 2025, with a projected compound annual growth rate (CAGR) of 5.1% from 2025 to 2033. This growth is primarily propelled by the robust performance of the oil and gas industry, a major consumer of centrifugal pumps for critical extraction, processing, and transportation activities. Additionally, sustained growth in the power generation sector, including increasing investments in renewable energy, is a significant market driver. Technological advancements, particularly in energy-efficient pump designs and material innovation, are further bolstering market prospects. The market is segmented by pump stage (single and multi-stage), end-user industry (oil & gas, power generation, and others), and impeller type (open, semi-open, and enclosed). Multi-stage pumps are anticipated to lead the market due to their superior efficiency in high-pressure applications. While North America and Europe currently dominate market share, the Asia-Pacific region is expected to exhibit the fastest growth, fueled by rapid industrialization and infrastructure development in countries like China and India. Challenges may arise from fluctuating raw material costs and stringent environmental regulations.
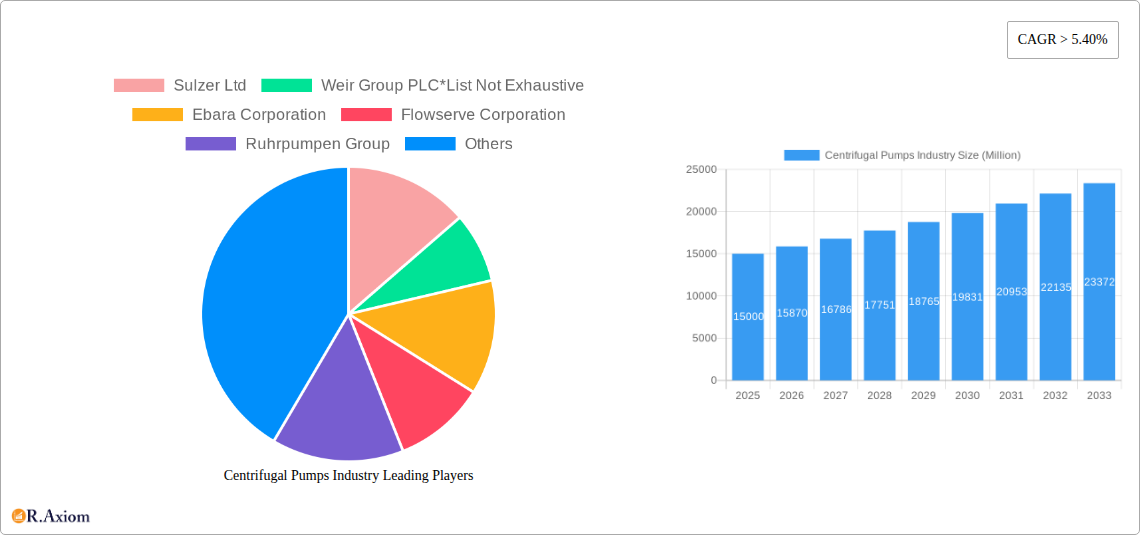
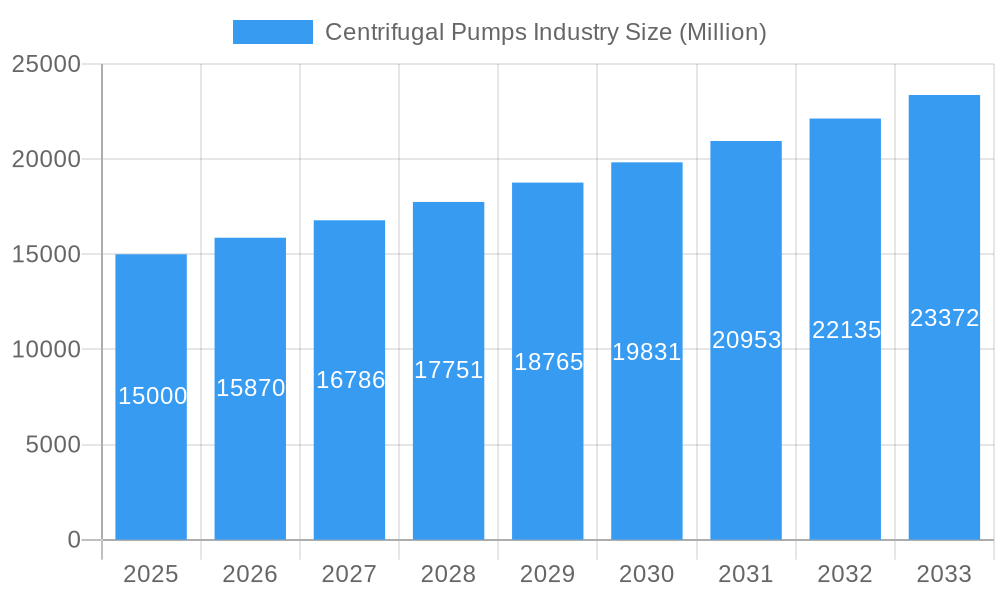
Centrifugal Pumps Industry Market Size (In Billion)
The competitive landscape features a mix of established global corporations and specialized regional manufacturers. Leading entities such as Sulzer Ltd, Weir Group PLC, Ebara Corporation, and Flowserve Corporation are actively investing in research and development to refine their product portfolios and broaden their market presence. Strategic alliances, mergers, and acquisitions are common tactics employed by these companies to solidify their market standing and enhance technological capabilities. The market's future trajectory will be shaped by global economic conditions, technological innovations, and government initiatives promoting energy efficiency and environmental sustainability. Emerging economies present significant growth opportunities, with infrastructure development and industrial expansion driving demand for centrifugal pumps across various applications. The market is expected to remain highly competitive, with companies prioritizing product differentiation, cost-effectiveness, and the expansion of their distribution networks.
Centrifugal Pumps Industry Company Market Share
Centrifugal Pumps Industry: A Comprehensive Market Report (2019-2033)
This detailed report provides a comprehensive analysis of the global centrifugal pumps industry, covering market size, segmentation, growth drivers, challenges, and key players. The study period spans from 2019 to 2033, with 2025 as the base and estimated year. The report offers actionable insights for industry stakeholders, including manufacturers, investors, and end-users. The market is valued in Millions.
Centrifugal Pumps Industry Market Concentration & Innovation
This section analyzes the competitive landscape of the centrifugal pump market, assessing market concentration, innovation drivers, regulatory influences, product substitution trends, end-user demands, and merger and acquisition (M&A) activities. The global centrifugal pumps market exhibits a moderately concentrated structure, with a few major players holding significant market share. Sulzer Ltd, Weir Group PLC, Ebara Corporation, and Flowserve Corporation are among the leading companies, collectively accounting for an estimated xx% of the global market in 2025. However, numerous smaller players also contribute significantly to the overall market.
Market Share (2025 Estimate):
- Sulzer Ltd: xx%
- Weir Group PLC: xx%
- Ebara Corporation: xx%
- Flowserve Corporation: xx%
- Others: xx%
Innovation in the centrifugal pump industry is driven by the increasing demand for energy-efficient and high-performance pumps across diverse applications. Stringent environmental regulations and a focus on sustainability are pushing manufacturers towards developing eco-friendly pumps with reduced energy consumption and lower emissions. The rising adoption of smart technologies, such as IoT-enabled sensors and predictive maintenance solutions, is also shaping innovation in the sector.
M&A Activity: The centrifugal pump industry has witnessed several significant M&A activities in recent years, with deal values totaling xx Million. These acquisitions often aim to expand market reach, enhance product portfolios, and gain access to new technologies. A notable example includes KSB's acquisition of Bharat Pumps in March 2023.
Centrifugal Pumps Industry Industry Trends & Insights
The global centrifugal pump market is experiencing robust growth, driven by several key factors. The increasing demand for water and wastewater treatment infrastructure, particularly in developing economies, is a significant catalyst for market expansion. Additionally, the growing need for efficient pumping solutions in various industries, such as oil and gas, power generation, and chemical processing, fuels market growth. Technological advancements, such as the development of high-efficiency pumps with improved performance characteristics, contribute to the market's expansion. The adoption of smart pumps with integrated sensors and remote monitoring capabilities is further boosting market growth.
Market Growth Drivers:
- Rising infrastructure development globally.
- Increasing industrialization and urbanization.
- Growing demand for water and wastewater treatment.
- Technological advancements leading to higher efficiency pumps.
- Stringent environmental regulations promoting energy-efficient solutions.
The market is expected to exhibit a compound annual growth rate (CAGR) of xx% during the forecast period (2025-2033), reaching a market value of xx Million by 2033. Market penetration is highest in developed regions like North America and Europe but is rapidly increasing in developing economies in Asia and the Middle East. Competitive dynamics are intense, with established players and emerging companies vying for market share through product innovation, strategic partnerships, and geographical expansion.
Dominant Markets & Segments in Centrifugal Pumps Industry
The centrifugal pump market is geographically diverse, with significant presence across various regions. However, specific segments show stronger growth in particular areas.
Dominant Regions/Countries: (Reasons for dominance outlined below in bullet points)
- North America: Strong industrial base, high demand from oil & gas and power generation sectors.
- Europe: Well-established manufacturing base, stringent environmental regulations driving innovation.
- Asia-Pacific: Rapid industrialization and urbanization, increasing infrastructure investments.
Dominant Segments:
- End-User: Oil & Gas, due to its large-scale operations and need for high-capacity pumps.
- Stage: Multi-stage pumps in high-pressure applications where single-stage pumps are insufficient.
- Impeller Type: Enclosed impeller pumps due to their high efficiency and reliability in demanding applications.
Key Drivers for Dominant Segments:
- Oil and Gas: High demand for efficient and reliable pumps in offshore and onshore operations.
- Power Generation: Requirement for high-capacity pumps in thermal and nuclear power plants.
- Multi-stage Pumps: Ability to handle high pressures and flow rates in diverse applications.
- Enclosed Impeller Pumps: Superior efficiency, reduced maintenance, and suitability for harsh environments.
Centrifugal Pumps Industry Product Developments
Recent product developments focus on enhancing energy efficiency, incorporating smart technologies, and improving durability. The ISH/ISP high-efficiency centrifugal pump launched by GSD in April 2022, for example, integrates IoT capabilities for real-time monitoring and predictive maintenance. This trend reflects the industry's commitment to meeting growing sustainability demands and maximizing operational efficiency for customers. These advanced pumps offer superior performance, reduced maintenance costs, and improved operational reliability, leading to increased market acceptance and competitive advantage.
Report Scope & Segmentation Analysis
This report segments the centrifugal pumps market based on stage (single-stage, multi-stage), end-user (oil and gas, power generation, other end-users), and impeller type (open, partially open, enclosed). Each segment is analyzed in terms of market size, growth projections, and competitive dynamics.
Stage: Both single-stage and multi-stage pumps hold significant market share, with multi-stage pumps projected to experience faster growth due to demand in high-pressure applications.
End-User: The oil and gas sector remains a dominant end-user, while the power generation segment is expected to experience significant growth driven by global energy demand.
Impeller Type: Enclosed impeller pumps dominate the market due to their efficiency and durability, however, partially open and open impeller pumps maintain their niche in specific applications.
Key Drivers of Centrifugal Pumps Industry Growth
The centrifugal pump market is driven by several factors, including growing industrialization, infrastructure development, rising energy demand, and technological advancements leading to more efficient and reliable pumps. Stringent environmental regulations also play a critical role, pushing manufacturers to develop more sustainable pumping solutions. The rising adoption of smart technologies, such as IoT-enabled pumps and predictive maintenance systems, further fuels market growth.
Challenges in the Centrifugal Pumps Industry Sector
The industry faces challenges such as fluctuating raw material prices, intense competition, and the need to comply with stringent environmental regulations. Supply chain disruptions and the increasing cost of skilled labor also present significant challenges. These factors can impact production costs and profitability, requiring manufacturers to optimize their operations and supply chains to mitigate these risks. The estimated impact of these challenges on market growth is xx%.
Emerging Opportunities in Centrifugal Pumps Industry
Emerging opportunities lie in the development and adoption of energy-efficient pumps, smart pumps with advanced monitoring capabilities, and customized solutions for niche applications. Expanding into new markets, particularly in developing economies with growing infrastructure needs, presents significant opportunities. Furthermore, the increasing focus on sustainability offers opportunities for developing eco-friendly pumps that minimize environmental impact.
Leading Players in the Centrifugal Pumps Industry Market
- Sulzer Ltd
- Weir Group PLC
- Ebara Corporation
- Flowserve Corporation
- Ruhrpumpen Group
- Schlumberger Ltd
- KSB SE & Co KGaA
- ITT Inc
- Dover Corporation
- Baker Hughes Company
Key Developments in Centrifugal Pumps Industry Industry
- April 2022: GSD launched the ISH/ISP high-efficiency centrifugal pump with integrated IoT capabilities for real-time monitoring and predictive maintenance. This enhanced the market offering of smart, efficient pumps.
- March 2023: KSB acquired Bharat Pumps, expanding its market reach in India and strengthening its aftermarket services capabilities. This acquisition significantly impacted the market share and competitive landscape in India.
Strategic Outlook for Centrifugal Pumps Industry Market
The centrifugal pumps market is poised for continued growth, driven by robust demand across diverse sectors and technological advancements. The focus on sustainability, smart technologies, and customized solutions will shape future market dynamics. Companies that invest in innovation, optimize their operations, and effectively manage supply chain risks are expected to gain a competitive advantage and capitalize on the growth potential of this dynamic market.
Centrifugal Pumps Industry Segmentation
-
1. Stage
- 1.1. Single-stage Pumps
- 1.2. Multi-stage Pumps
-
2. End-User
- 2.1. Oil and Gas
- 2.2. Power Generation
- 2.3. Other End-Users
-
3. Impeller Type
- 3.1. Open
- 3.2. Partially Open
- 3.3. Enclosed
Centrifugal Pumps Industry Segmentation By Geography
- 1. North America
- 2. Europe
- 3. Asia Pacific
- 4. South America
- 5. Middle East and Africa
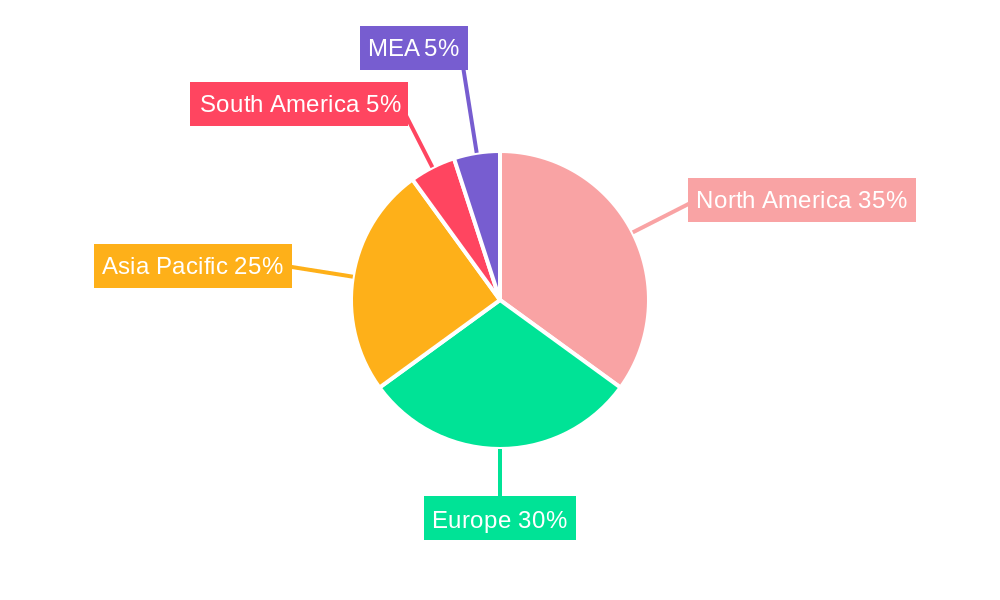
Centrifugal Pumps Industry Regional Market Share
Geographic Coverage of Centrifugal Pumps Industry
Centrifugal Pumps Industry REPORT HIGHLIGHTS
| Aspects | Details |
|---|---|
| Study Period | 2020-2034 |
| Base Year | 2025 |
| Estimated Year | 2026 |
| Forecast Period | 2026-2034 |
| Historical Period | 2020-2025 |
| Growth Rate | CAGR of 5.1% from 2020-2034 |
| Segmentation |
|
Table of Contents
- 1. Introduction
- 1.1. Research Scope
- 1.2. Market Segmentation
- 1.3. Research Objective
- 1.4. Definitions and Assumptions
- 2. Executive Summary
- 2.1. Market Snapshot
- 3. Market Dynamics
- 3.1. Market Drivers
- 3.2. Market Restrains
- 3.3. Market Trends
- 3.4. Market Opportunities
- 4. Market Factor Analysis
- 4.1. Porters Five Forces
- 4.1.1. Bargaining Power of Suppliers
- 4.1.2. Bargaining Power of Buyers
- 4.1.3. Threat of New Entrants
- 4.1.4. Threat of Substitutes
- 4.1.5. Competitive Rivalry
- 4.2. PESTEL analysis
- 4.3. BCG Analysis
- 4.3.1. Stars (High Growth, High Market Share)
- 4.3.2. Cash Cows (Low Growth, High Market Share)
- 4.3.3. Question Mark (High Growth, Low Market Share)
- 4.3.4. Dogs (Low Growth, Low Market Share)
- 4.4. Ansoff Matrix Analysis
- 4.5. Supply Chain Analysis
- 4.6. Regulatory Landscape
- 4.7. Current Market Potential and Opportunity Assessment (TAM–SAM–SOM Framework)
- 4.8. RAX Analyst Note
- 4.1. Porters Five Forces
- 5. Market Analysis, Insights and Forecast 2021-2033
- 5.1. Market Analysis, Insights and Forecast - by Stage
- 5.1.1. Single-stage Pumps
- 5.1.2. Multi-stage Pumps
- 5.2. Market Analysis, Insights and Forecast - by End-User
- 5.2.1. Oil and Gas
- 5.2.2. Power Generation
- 5.2.3. Other End-Users
- 5.3. Market Analysis, Insights and Forecast - by Impeller Type
- 5.3.1. Open
- 5.3.2. Partially Open
- 5.3.3. Enclosed
- 5.4. Market Analysis, Insights and Forecast - by Region
- 5.4.1. North America
- 5.4.2. Europe
- 5.4.3. Asia Pacific
- 5.4.4. South America
- 5.4.5. Middle East and Africa
- 5.1. Market Analysis, Insights and Forecast - by Stage
- 6. Global Centrifugal Pumps Industry Analysis, Insights and Forecast, 2021-2033
- 6.1. Market Analysis, Insights and Forecast - by Stage
- 6.1.1. Single-stage Pumps
- 6.1.2. Multi-stage Pumps
- 6.2. Market Analysis, Insights and Forecast - by End-User
- 6.2.1. Oil and Gas
- 6.2.2. Power Generation
- 6.2.3. Other End-Users
- 6.3. Market Analysis, Insights and Forecast - by Impeller Type
- 6.3.1. Open
- 6.3.2. Partially Open
- 6.3.3. Enclosed
- 6.1. Market Analysis, Insights and Forecast - by Stage
- 7. North America Centrifugal Pumps Industry Analysis, Insights and Forecast, 2020-2032
- 7.1. Market Analysis, Insights and Forecast - by Stage
- 7.1.1. Single-stage Pumps
- 7.1.2. Multi-stage Pumps
- 7.2. Market Analysis, Insights and Forecast - by End-User
- 7.2.1. Oil and Gas
- 7.2.2. Power Generation
- 7.2.3. Other End-Users
- 7.3. Market Analysis, Insights and Forecast - by Impeller Type
- 7.3.1. Open
- 7.3.2. Partially Open
- 7.3.3. Enclosed
- 7.1. Market Analysis, Insights and Forecast - by Stage
- 8. Europe Centrifugal Pumps Industry Analysis, Insights and Forecast, 2020-2032
- 8.1. Market Analysis, Insights and Forecast - by Stage
- 8.1.1. Single-stage Pumps
- 8.1.2. Multi-stage Pumps
- 8.2. Market Analysis, Insights and Forecast - by End-User
- 8.2.1. Oil and Gas
- 8.2.2. Power Generation
- 8.2.3. Other End-Users
- 8.3. Market Analysis, Insights and Forecast - by Impeller Type
- 8.3.1. Open
- 8.3.2. Partially Open
- 8.3.3. Enclosed
- 8.1. Market Analysis, Insights and Forecast - by Stage
- 9. Asia Pacific Centrifugal Pumps Industry Analysis, Insights and Forecast, 2020-2032
- 9.1. Market Analysis, Insights and Forecast - by Stage
- 9.1.1. Single-stage Pumps
- 9.1.2. Multi-stage Pumps
- 9.2. Market Analysis, Insights and Forecast - by End-User
- 9.2.1. Oil and Gas
- 9.2.2. Power Generation
- 9.2.3. Other End-Users
- 9.3. Market Analysis, Insights and Forecast - by Impeller Type
- 9.3.1. Open
- 9.3.2. Partially Open
- 9.3.3. Enclosed
- 9.1. Market Analysis, Insights and Forecast - by Stage
- 10. South America Centrifugal Pumps Industry Analysis, Insights and Forecast, 2020-2032
- 10.1. Market Analysis, Insights and Forecast - by Stage
- 10.1.1. Single-stage Pumps
- 10.1.2. Multi-stage Pumps
- 10.2. Market Analysis, Insights and Forecast - by End-User
- 10.2.1. Oil and Gas
- 10.2.2. Power Generation
- 10.2.3. Other End-Users
- 10.3. Market Analysis, Insights and Forecast - by Impeller Type
- 10.3.1. Open
- 10.3.2. Partially Open
- 10.3.3. Enclosed
- 10.1. Market Analysis, Insights and Forecast - by Stage
- 11. Middle East and Africa Centrifugal Pumps Industry Analysis, Insights and Forecast, 2020-2032
- 11.1. Market Analysis, Insights and Forecast - by Stage
- 11.1.1. Single-stage Pumps
- 11.1.2. Multi-stage Pumps
- 11.2. Market Analysis, Insights and Forecast - by End-User
- 11.2.1. Oil and Gas
- 11.2.2. Power Generation
- 11.2.3. Other End-Users
- 11.3. Market Analysis, Insights and Forecast - by Impeller Type
- 11.3.1. Open
- 11.3.2. Partially Open
- 11.3.3. Enclosed
- 11.1. Market Analysis, Insights and Forecast - by Stage
- 12. Competitive Analysis
- 12.1. Company Profiles
- 12.1.1 Sulzer Ltd
- 12.1.1.1. Company Overview
- 12.1.1.2. Products
- 12.1.1.3. Company Financials
- 12.1.1.4. SWOT Analysis
- 12.1.2 Weir Group PLC*List Not Exhaustive
- 12.1.2.1. Company Overview
- 12.1.2.2. Products
- 12.1.2.3. Company Financials
- 12.1.2.4. SWOT Analysis
- 12.1.3 Ebara Corporation
- 12.1.3.1. Company Overview
- 12.1.3.2. Products
- 12.1.3.3. Company Financials
- 12.1.3.4. SWOT Analysis
- 12.1.4 Flowserve Corporation
- 12.1.4.1. Company Overview
- 12.1.4.2. Products
- 12.1.4.3. Company Financials
- 12.1.4.4. SWOT Analysis
- 12.1.5 Ruhrpumpen Group
- 12.1.5.1. Company Overview
- 12.1.5.2. Products
- 12.1.5.3. Company Financials
- 12.1.5.4. SWOT Analysis
- 12.1.6 Schlumberger Ltd
- 12.1.6.1. Company Overview
- 12.1.6.2. Products
- 12.1.6.3. Company Financials
- 12.1.6.4. SWOT Analysis
- 12.1.7 KSB SE & Co KGaA
- 12.1.7.1. Company Overview
- 12.1.7.2. Products
- 12.1.7.3. Company Financials
- 12.1.7.4. SWOT Analysis
- 12.1.8 ITT Inc
- 12.1.8.1. Company Overview
- 12.1.8.2. Products
- 12.1.8.3. Company Financials
- 12.1.8.4. SWOT Analysis
- 12.1.9 Dover Corporation
- 12.1.9.1. Company Overview
- 12.1.9.2. Products
- 12.1.9.3. Company Financials
- 12.1.9.4. SWOT Analysis
- 12.1.10 Baker Hughes Company
- 12.1.10.1. Company Overview
- 12.1.10.2. Products
- 12.1.10.3. Company Financials
- 12.1.10.4. SWOT Analysis
- 12.1.1 Sulzer Ltd
- 12.2. Market Entropy
- 12.2.1 Company's Key Areas Served
- 12.2.2 Recent Developments
- 12.3. Company Market Share Analysis 2025
- 12.3.1 Top 5 Companies Market Share Analysis
- 12.3.2 Top 3 Companies Market Share Analysis
- 12.4. List of Potential Customers
- 13. Research Methodology
List of Figures
- Figure 1: Global Centrifugal Pumps Industry Revenue Breakdown (billion, %) by Region 2025 & 2033
- Figure 2: Global Centrifugal Pumps Industry Volume Breakdown (K Units, %) by Region 2025 & 2033
- Figure 3: North America Centrifugal Pumps Industry Revenue (billion), by Stage 2025 & 2033
- Figure 4: North America Centrifugal Pumps Industry Volume (K Units), by Stage 2025 & 2033
- Figure 5: North America Centrifugal Pumps Industry Revenue Share (%), by Stage 2025 & 2033
- Figure 6: North America Centrifugal Pumps Industry Volume Share (%), by Stage 2025 & 2033
- Figure 7: North America Centrifugal Pumps Industry Revenue (billion), by End-User 2025 & 2033
- Figure 8: North America Centrifugal Pumps Industry Volume (K Units), by End-User 2025 & 2033
- Figure 9: North America Centrifugal Pumps Industry Revenue Share (%), by End-User 2025 & 2033
- Figure 10: North America Centrifugal Pumps Industry Volume Share (%), by End-User 2025 & 2033
- Figure 11: North America Centrifugal Pumps Industry Revenue (billion), by Impeller Type 2025 & 2033
- Figure 12: North America Centrifugal Pumps Industry Volume (K Units), by Impeller Type 2025 & 2033
- Figure 13: North America Centrifugal Pumps Industry Revenue Share (%), by Impeller Type 2025 & 2033
- Figure 14: North America Centrifugal Pumps Industry Volume Share (%), by Impeller Type 2025 & 2033
- Figure 15: North America Centrifugal Pumps Industry Revenue (billion), by Country 2025 & 2033
- Figure 16: North America Centrifugal Pumps Industry Volume (K Units), by Country 2025 & 2033
- Figure 17: North America Centrifugal Pumps Industry Revenue Share (%), by Country 2025 & 2033
- Figure 18: North America Centrifugal Pumps Industry Volume Share (%), by Country 2025 & 2033
- Figure 19: Europe Centrifugal Pumps Industry Revenue (billion), by Stage 2025 & 2033
- Figure 20: Europe Centrifugal Pumps Industry Volume (K Units), by Stage 2025 & 2033
- Figure 21: Europe Centrifugal Pumps Industry Revenue Share (%), by Stage 2025 & 2033
- Figure 22: Europe Centrifugal Pumps Industry Volume Share (%), by Stage 2025 & 2033
- Figure 23: Europe Centrifugal Pumps Industry Revenue (billion), by End-User 2025 & 2033
- Figure 24: Europe Centrifugal Pumps Industry Volume (K Units), by End-User 2025 & 2033
- Figure 25: Europe Centrifugal Pumps Industry Revenue Share (%), by End-User 2025 & 2033
- Figure 26: Europe Centrifugal Pumps Industry Volume Share (%), by End-User 2025 & 2033
- Figure 27: Europe Centrifugal Pumps Industry Revenue (billion), by Impeller Type 2025 & 2033
- Figure 28: Europe Centrifugal Pumps Industry Volume (K Units), by Impeller Type 2025 & 2033
- Figure 29: Europe Centrifugal Pumps Industry Revenue Share (%), by Impeller Type 2025 & 2033
- Figure 30: Europe Centrifugal Pumps Industry Volume Share (%), by Impeller Type 2025 & 2033
- Figure 31: Europe Centrifugal Pumps Industry Revenue (billion), by Country 2025 & 2033
- Figure 32: Europe Centrifugal Pumps Industry Volume (K Units), by Country 2025 & 2033
- Figure 33: Europe Centrifugal Pumps Industry Revenue Share (%), by Country 2025 & 2033
- Figure 34: Europe Centrifugal Pumps Industry Volume Share (%), by Country 2025 & 2033
- Figure 35: Asia Pacific Centrifugal Pumps Industry Revenue (billion), by Stage 2025 & 2033
- Figure 36: Asia Pacific Centrifugal Pumps Industry Volume (K Units), by Stage 2025 & 2033
- Figure 37: Asia Pacific Centrifugal Pumps Industry Revenue Share (%), by Stage 2025 & 2033
- Figure 38: Asia Pacific Centrifugal Pumps Industry Volume Share (%), by Stage 2025 & 2033
- Figure 39: Asia Pacific Centrifugal Pumps Industry Revenue (billion), by End-User 2025 & 2033
- Figure 40: Asia Pacific Centrifugal Pumps Industry Volume (K Units), by End-User 2025 & 2033
- Figure 41: Asia Pacific Centrifugal Pumps Industry Revenue Share (%), by End-User 2025 & 2033
- Figure 42: Asia Pacific Centrifugal Pumps Industry Volume Share (%), by End-User 2025 & 2033
- Figure 43: Asia Pacific Centrifugal Pumps Industry Revenue (billion), by Impeller Type 2025 & 2033
- Figure 44: Asia Pacific Centrifugal Pumps Industry Volume (K Units), by Impeller Type 2025 & 2033
- Figure 45: Asia Pacific Centrifugal Pumps Industry Revenue Share (%), by Impeller Type 2025 & 2033
- Figure 46: Asia Pacific Centrifugal Pumps Industry Volume Share (%), by Impeller Type 2025 & 2033
- Figure 47: Asia Pacific Centrifugal Pumps Industry Revenue (billion), by Country 2025 & 2033
- Figure 48: Asia Pacific Centrifugal Pumps Industry Volume (K Units), by Country 2025 & 2033
- Figure 49: Asia Pacific Centrifugal Pumps Industry Revenue Share (%), by Country 2025 & 2033
- Figure 50: Asia Pacific Centrifugal Pumps Industry Volume Share (%), by Country 2025 & 2033
- Figure 51: South America Centrifugal Pumps Industry Revenue (billion), by Stage 2025 & 2033
- Figure 52: South America Centrifugal Pumps Industry Volume (K Units), by Stage 2025 & 2033
- Figure 53: South America Centrifugal Pumps Industry Revenue Share (%), by Stage 2025 & 2033
- Figure 54: South America Centrifugal Pumps Industry Volume Share (%), by Stage 2025 & 2033
- Figure 55: South America Centrifugal Pumps Industry Revenue (billion), by End-User 2025 & 2033
- Figure 56: South America Centrifugal Pumps Industry Volume (K Units), by End-User 2025 & 2033
- Figure 57: South America Centrifugal Pumps Industry Revenue Share (%), by End-User 2025 & 2033
- Figure 58: South America Centrifugal Pumps Industry Volume Share (%), by End-User 2025 & 2033
- Figure 59: South America Centrifugal Pumps Industry Revenue (billion), by Impeller Type 2025 & 2033
- Figure 60: South America Centrifugal Pumps Industry Volume (K Units), by Impeller Type 2025 & 2033
- Figure 61: South America Centrifugal Pumps Industry Revenue Share (%), by Impeller Type 2025 & 2033
- Figure 62: South America Centrifugal Pumps Industry Volume Share (%), by Impeller Type 2025 & 2033
- Figure 63: South America Centrifugal Pumps Industry Revenue (billion), by Country 2025 & 2033
- Figure 64: South America Centrifugal Pumps Industry Volume (K Units), by Country 2025 & 2033
- Figure 65: South America Centrifugal Pumps Industry Revenue Share (%), by Country 2025 & 2033
- Figure 66: South America Centrifugal Pumps Industry Volume Share (%), by Country 2025 & 2033
- Figure 67: Middle East and Africa Centrifugal Pumps Industry Revenue (billion), by Stage 2025 & 2033
- Figure 68: Middle East and Africa Centrifugal Pumps Industry Volume (K Units), by Stage 2025 & 2033
- Figure 69: Middle East and Africa Centrifugal Pumps Industry Revenue Share (%), by Stage 2025 & 2033
- Figure 70: Middle East and Africa Centrifugal Pumps Industry Volume Share (%), by Stage 2025 & 2033
- Figure 71: Middle East and Africa Centrifugal Pumps Industry Revenue (billion), by End-User 2025 & 2033
- Figure 72: Middle East and Africa Centrifugal Pumps Industry Volume (K Units), by End-User 2025 & 2033
- Figure 73: Middle East and Africa Centrifugal Pumps Industry Revenue Share (%), by End-User 2025 & 2033
- Figure 74: Middle East and Africa Centrifugal Pumps Industry Volume Share (%), by End-User 2025 & 2033
- Figure 75: Middle East and Africa Centrifugal Pumps Industry Revenue (billion), by Impeller Type 2025 & 2033
- Figure 76: Middle East and Africa Centrifugal Pumps Industry Volume (K Units), by Impeller Type 2025 & 2033
- Figure 77: Middle East and Africa Centrifugal Pumps Industry Revenue Share (%), by Impeller Type 2025 & 2033
- Figure 78: Middle East and Africa Centrifugal Pumps Industry Volume Share (%), by Impeller Type 2025 & 2033
- Figure 79: Middle East and Africa Centrifugal Pumps Industry Revenue (billion), by Country 2025 & 2033
- Figure 80: Middle East and Africa Centrifugal Pumps Industry Volume (K Units), by Country 2025 & 2033
- Figure 81: Middle East and Africa Centrifugal Pumps Industry Revenue Share (%), by Country 2025 & 2033
- Figure 82: Middle East and Africa Centrifugal Pumps Industry Volume Share (%), by Country 2025 & 2033
List of Tables
- Table 1: Global Centrifugal Pumps Industry Revenue billion Forecast, by Stage 2020 & 2033
- Table 2: Global Centrifugal Pumps Industry Volume K Units Forecast, by Stage 2020 & 2033
- Table 3: Global Centrifugal Pumps Industry Revenue billion Forecast, by End-User 2020 & 2033
- Table 4: Global Centrifugal Pumps Industry Volume K Units Forecast, by End-User 2020 & 2033
- Table 5: Global Centrifugal Pumps Industry Revenue billion Forecast, by Impeller Type 2020 & 2033
- Table 6: Global Centrifugal Pumps Industry Volume K Units Forecast, by Impeller Type 2020 & 2033
- Table 7: Global Centrifugal Pumps Industry Revenue billion Forecast, by Region 2020 & 2033
- Table 8: Global Centrifugal Pumps Industry Volume K Units Forecast, by Region 2020 & 2033
- Table 9: Global Centrifugal Pumps Industry Revenue billion Forecast, by Stage 2020 & 2033
- Table 10: Global Centrifugal Pumps Industry Volume K Units Forecast, by Stage 2020 & 2033
- Table 11: Global Centrifugal Pumps Industry Revenue billion Forecast, by End-User 2020 & 2033
- Table 12: Global Centrifugal Pumps Industry Volume K Units Forecast, by End-User 2020 & 2033
- Table 13: Global Centrifugal Pumps Industry Revenue billion Forecast, by Impeller Type 2020 & 2033
- Table 14: Global Centrifugal Pumps Industry Volume K Units Forecast, by Impeller Type 2020 & 2033
- Table 15: Global Centrifugal Pumps Industry Revenue billion Forecast, by Country 2020 & 2033
- Table 16: Global Centrifugal Pumps Industry Volume K Units Forecast, by Country 2020 & 2033
- Table 17: Global Centrifugal Pumps Industry Revenue billion Forecast, by Stage 2020 & 2033
- Table 18: Global Centrifugal Pumps Industry Volume K Units Forecast, by Stage 2020 & 2033
- Table 19: Global Centrifugal Pumps Industry Revenue billion Forecast, by End-User 2020 & 2033
- Table 20: Global Centrifugal Pumps Industry Volume K Units Forecast, by End-User 2020 & 2033
- Table 21: Global Centrifugal Pumps Industry Revenue billion Forecast, by Impeller Type 2020 & 2033
- Table 22: Global Centrifugal Pumps Industry Volume K Units Forecast, by Impeller Type 2020 & 2033
- Table 23: Global Centrifugal Pumps Industry Revenue billion Forecast, by Country 2020 & 2033
- Table 24: Global Centrifugal Pumps Industry Volume K Units Forecast, by Country 2020 & 2033
- Table 25: Global Centrifugal Pumps Industry Revenue billion Forecast, by Stage 2020 & 2033
- Table 26: Global Centrifugal Pumps Industry Volume K Units Forecast, by Stage 2020 & 2033
- Table 27: Global Centrifugal Pumps Industry Revenue billion Forecast, by End-User 2020 & 2033
- Table 28: Global Centrifugal Pumps Industry Volume K Units Forecast, by End-User 2020 & 2033
- Table 29: Global Centrifugal Pumps Industry Revenue billion Forecast, by Impeller Type 2020 & 2033
- Table 30: Global Centrifugal Pumps Industry Volume K Units Forecast, by Impeller Type 2020 & 2033
- Table 31: Global Centrifugal Pumps Industry Revenue billion Forecast, by Country 2020 & 2033
- Table 32: Global Centrifugal Pumps Industry Volume K Units Forecast, by Country 2020 & 2033
- Table 33: Global Centrifugal Pumps Industry Revenue billion Forecast, by Stage 2020 & 2033
- Table 34: Global Centrifugal Pumps Industry Volume K Units Forecast, by Stage 2020 & 2033
- Table 35: Global Centrifugal Pumps Industry Revenue billion Forecast, by End-User 2020 & 2033
- Table 36: Global Centrifugal Pumps Industry Volume K Units Forecast, by End-User 2020 & 2033
- Table 37: Global Centrifugal Pumps Industry Revenue billion Forecast, by Impeller Type 2020 & 2033
- Table 38: Global Centrifugal Pumps Industry Volume K Units Forecast, by Impeller Type 2020 & 2033
- Table 39: Global Centrifugal Pumps Industry Revenue billion Forecast, by Country 2020 & 2033
- Table 40: Global Centrifugal Pumps Industry Volume K Units Forecast, by Country 2020 & 2033
- Table 41: Global Centrifugal Pumps Industry Revenue billion Forecast, by Stage 2020 & 2033
- Table 42: Global Centrifugal Pumps Industry Volume K Units Forecast, by Stage 2020 & 2033
- Table 43: Global Centrifugal Pumps Industry Revenue billion Forecast, by End-User 2020 & 2033
- Table 44: Global Centrifugal Pumps Industry Volume K Units Forecast, by End-User 2020 & 2033
- Table 45: Global Centrifugal Pumps Industry Revenue billion Forecast, by Impeller Type 2020 & 2033
- Table 46: Global Centrifugal Pumps Industry Volume K Units Forecast, by Impeller Type 2020 & 2033
- Table 47: Global Centrifugal Pumps Industry Revenue billion Forecast, by Country 2020 & 2033
- Table 48: Global Centrifugal Pumps Industry Volume K Units Forecast, by Country 2020 & 2033
Frequently Asked Questions
1. What is the projected Compound Annual Growth Rate (CAGR) of the Centrifugal Pumps Industry?
The projected CAGR is approximately 5.1%.
2. Which companies are prominent players in the Centrifugal Pumps Industry?
Key companies in the market include Sulzer Ltd, Weir Group PLC*List Not Exhaustive, Ebara Corporation, Flowserve Corporation, Ruhrpumpen Group, Schlumberger Ltd, KSB SE & Co KGaA, ITT Inc, Dover Corporation, Baker Hughes Company.
3. What are the main segments of the Centrifugal Pumps Industry?
The market segments include Stage, End-User, Impeller Type.
4. Can you provide details about the market size?
The market size is estimated to be USD 33.7 billion as of 2022.
5. What are some drivers contributing to market growth?
Growing demand for natural gas and developing gas infrastructure and increasing offshore oil and Gas Exploration Activities.
6. What are the notable trends driving market growth?
Oil and Gas Segment to Dominate the Market.
7. Are there any restraints impacting market growth?
Adoption of Cleaner Alternatives.
8. Can you provide examples of recent developments in the market?
April 2022: GSD held an internal product launch of the ISH/ISP high-efficiency centrifugal pump. ISH/ISP high-efficiency centrifugal pump can be equipped with sensors at the reserved position in the design to realize the real-time monitoring, predictive alarm, fault analysis, energy efficiency analysis and operation state optimization of the equipment by matching with the GSD intelligent IOT system.
9. What pricing options are available for accessing the report?
Pricing options include single-user, multi-user, and enterprise licenses priced at USD 4750, USD 5250, and USD 8750 respectively.
10. Is the market size provided in terms of value or volume?
The market size is provided in terms of value, measured in billion and volume, measured in K Units.
11. Are there any specific market keywords associated with the report?
Yes, the market keyword associated with the report is "Centrifugal Pumps Industry," which aids in identifying and referencing the specific market segment covered.
12. How do I determine which pricing option suits my needs best?
The pricing options vary based on user requirements and access needs. Individual users may opt for single-user licenses, while businesses requiring broader access may choose multi-user or enterprise licenses for cost-effective access to the report.
13. Are there any additional resources or data provided in the Centrifugal Pumps Industry report?
While the report offers comprehensive insights, it's advisable to review the specific contents or supplementary materials provided to ascertain if additional resources or data are available.
14. How can I stay updated on further developments or reports in the Centrifugal Pumps Industry?
To stay informed about further developments, trends, and reports in the Centrifugal Pumps Industry, consider subscribing to industry newsletters, following relevant companies and organizations, or regularly checking reputable industry news sources and publications.
Methodology
Step 1 - Identification of Relevant Samples Size from Population Database


Step 2 - Approaches for Defining Global Market Size (Value, Volume* & Price*)

Note*: In applicable scenarios
Step 3 - Data Sources
Primary Research
- Web Analytics
- Survey Reports
- Research Institute
- Latest Research Reports
- Opinion Leaders
Secondary Research
- Annual Reports
- White Paper
- Latest Press Release
- Industry Association
- Paid Database
- Investor Presentations

Step 4 - Data Triangulation
Involves using different sources of information in order to increase the validity of a study
These sources are likely to be stakeholders in a program - participants, other researchers, program staff, other community members, and so on.
Then we put all data in single framework & apply various statistical tools to find out the dynamic on the market.
During the analysis stage, feedback from the stakeholder groups would be compared to determine areas of agreement as well as areas of divergence