

Key Insights
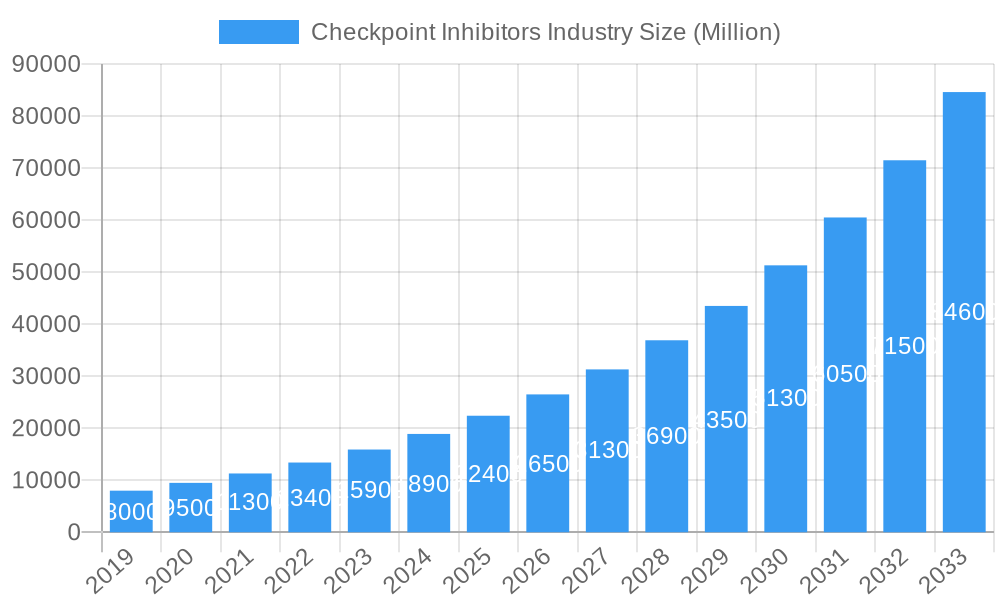
The global Checkpoint Inhibitors market is projected for significant expansion, forecasted to grow from $62 billion in 2025 to an estimated $180 billion by 2033, at a robust CAGR of 14.7%. This growth is primarily driven by the escalating global cancer incidence, pioneering advancements in immunotherapy research, and increasing clinical and patient adoption of these novel therapies. The expanding pipeline of checkpoint inhibitors and their proven efficacy across various cancers, including Non-small Cell Lung Cancer, Melanoma, and Kidney Cancers, are key market drivers. Enhanced awareness of these treatments' potential for durable responses and improved patient survival further fuels market dynamics.
Checkpoint Inhibitors Industry Market Size (In Billion)
Key market segments include CTLA-4 and PD-1 Inhibitors, with PD-1 Inhibitors currently holding a dominant position due to their widespread applications and favorable safety profiles. Major applications span Hodgkin Lymphoma, Kidney Cancers, Melanoma, and Non-small Cell Lung Cancer. While hospital pharmacies remain the primary distribution channel, online pharmacies are expected to see substantial growth, driven by enhanced accessibility and convenience. North America and Europe currently lead the market, supported by early adoption, substantial R&D investment, and advanced healthcare infrastructures. However, the Asia Pacific region is poised for the fastest growth, propelled by rising healthcare expenditure, increasing cancer burden, and improved access to advanced medical treatments. Leading market players, including Bristol-Myers Squibb, Merck & Co., AstraZeneca PLC, and F. Hoffmann-La Roche AG, are actively pursuing strategic collaborations, mergers, and acquisitions to expand their product portfolios and market presence.
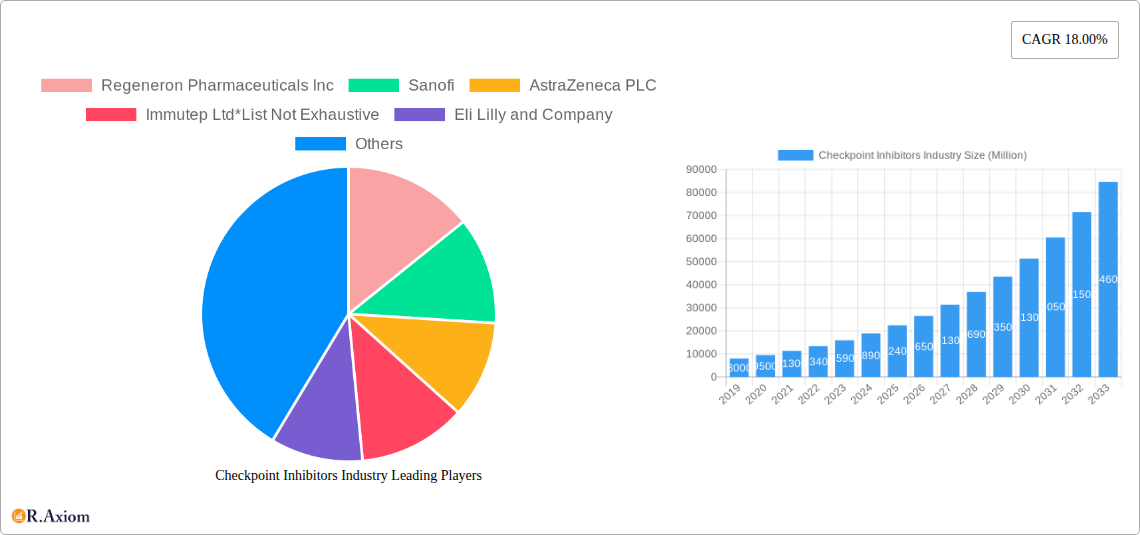
Checkpoint Inhibitors Industry Company Market Share
Checkpoint Inhibitors Industry Market Concentration & Innovation
The checkpoint inhibitors market exhibits a moderately concentrated landscape, with key players like Merck & Co., Bristol-Myers Squibb Company, F Hoffmann-La Roche AG, AstraZeneca PLC, Regeneron Pharmaceuticals Inc, and Sanofi dominating significant market share. Innovation in this sector is primarily driven by advancements in understanding the tumor microenvironment, novel target identification, and combination therapy strategies. Regulatory frameworks, while rigorous, are also adapting to accelerate the approval of promising checkpoint inhibitor therapies. The threat of product substitutes is currently low, given the unique efficacy of these immunotherapies in previously untreatable cancers. End-user trends show a growing demand for personalized medicine and improved patient outcomes, fueling the adoption of these advanced treatments. Mergers and acquisitions (M&A) activity is a significant factor, with deal values often reaching several hundred million to billions of dollars, as larger companies seek to acquire innovative pipeline assets and expand their oncology portfolios. For instance, recent M&A activities have focused on acquiring companies with promising bispecific antibody technologies or novel immuno-oncology targets. The market is projected to reach a value exceeding US$ 50,000 million by 2025, with continued growth driven by research and development.
Checkpoint Inhibitors Industry Industry Trends & Insights
The global checkpoint inhibitors market is poised for robust expansion, with an estimated Compound Annual Growth Rate (CAGR) of approximately 20% from 2025 to 2033. This growth is underpinned by a confluence of factors, including an increasing global cancer burden, rising healthcare expenditure, and significant advancements in understanding the human immune system's role in fighting cancer. The penetration of checkpoint inhibitors into various cancer types is steadily increasing, moving beyond melanoma and lung cancer to encompass a wider spectrum of oncological diseases. Technological disruptions, such as the development of next-generation checkpoint inhibitors with enhanced specificity and reduced toxicity, are pushing the boundaries of therapeutic efficacy. Furthermore, the integration of artificial intelligence (AI) and machine learning in drug discovery and development is accelerating the identification of novel targets and predictive biomarkers, leading to more personalized treatment approaches.
Consumer preferences are increasingly leaning towards therapies that offer improved quality of life and long-term remission. Checkpoint inhibitors, by harnessing the patient's own immune system, often present a more favorable side-effect profile compared to traditional chemotherapy, aligning with this trend. The competitive dynamics within the industry are intense, characterized by substantial investments in R&D, strategic partnerships, and an ongoing race to secure intellectual property and market exclusivity for novel compounds. The market penetration for PD-1 and PD-L1 inhibitors, currently the most prevalent types, is expected to continue its upward trajectory, while CTLA-4 inhibitors and other emerging checkpoint pathways will also contribute to market growth. The shift towards first-line treatment indications for various cancers, driven by compelling clinical trial data, is a significant market trend. The total market size is estimated to surpass US$ 100,000 million by 2033.
Dominant Markets & Segments in Checkpoint Inhibitors Industry
North America, particularly the United States, currently dominates the checkpoint inhibitors market. This leadership is attributed to several key drivers:
- Economic Policies: Robust healthcare spending, favorable reimbursement policies for advanced cancer therapies, and significant private and public funding for cancer research.
- Infrastructure: A well-established healthcare infrastructure, including a high density of specialized oncology treatment centers and advanced diagnostic facilities, facilitates the widespread adoption of checkpoint inhibitors.
- Regulatory Environment: The U.S. Food and Drug Administration (FDA) has historically been proactive in approving innovative cancer treatments, creating an environment conducive to early market entry for new checkpoint inhibitors.
Within the Type of Inhibitors segment, PD-1 Inhibitors hold the largest market share, projected to reach over US$ 60,000 million by 2025. This dominance is due to their broad efficacy across multiple cancer types and their frequent use as monotherapy or in combination regimens. CTLA-4 Inhibitors, while foundational, are now often used in combination with PD-1 inhibitors, contributing to their sustained relevance. "Other Types of Inhibitors," encompassing novel targets like LAG-3, TIGIT, and TIM-3, represent a rapidly growing segment with significant future potential.
For Application, Non-small Cell Lung Cancer (NSCLC) represents the largest application segment, expected to exceed US$ 25,000 million by 2025. The high incidence of NSCLC globally and the proven efficacy of checkpoint inhibitors in this disease have driven substantial market growth. Melanoma, Kidney Cancers, and Hodgkin Lymphoma also contribute significantly to the market. The increasing exploration of checkpoint inhibitors in "Other Applications," including a growing list of solid tumors and hematological malignancies, signifies expanding therapeutic frontiers.
In terms of Distribution Channel, Hospital Pharmacies currently dominate, accounting for over 60% of the market share. This is due to the complex administration, monitoring requirements, and the need for specialized oncology care associated with checkpoint inhibitors, which are predominantly managed within hospital settings. Retail Pharmacies and Online Pharmacies are expected to see gradual growth as the landscape of cancer treatment evolves and patient management strategies adapt.
Checkpoint Inhibitors Industry Product Developments
Product developments in the checkpoint inhibitors industry are characterized by a focus on enhancing efficacy, improving patient tolerance, and expanding the therapeutic reach of these immunotherapies. Key trends include the development of novel checkpoint targets beyond PD-1 and CTLA-4, such as LAG-3, TIGIT, and TIM-3, aiming to overcome resistance mechanisms and improve outcomes in a broader patient population. Combination therapies, integrating checkpoint inhibitors with other modalities like chemotherapy, targeted therapy, and other immunotherapies, are a major area of innovation, demonstrating synergistic effects and improved clinical benefits. Furthermore, advancements in drug delivery systems and formulation technologies are being explored to optimize dosing and reduce adverse events.
Report Scope & Segmentation Analysis
This report provides a comprehensive analysis of the global checkpoint inhibitors market, segmented by Type of Inhibitors, Application, and Distribution Channel. The Type of Inhibitors segment includes CTLA-4 Inhibitors, PD-1 Inhibitors, and Other Types of Inhibitors. The Application segment covers Hodgkin Lymphoma, Kidney Cancers, Melanoma, Non-small Cell Lung Cancer, and Other Applications. The Distribution Channel segment analyzes Hospital Pharmacies, Retail Pharmacies, and Online Pharmacies. The forecast period for this analysis is 2025–2033, with a base year of 2025. Growth projections and competitive dynamics are detailed for each segment, with PD-1 inhibitors expected to maintain market leadership and Non-small Cell Lung Cancer being the leading application.
Key Drivers of Checkpoint Inhibitors Industry Growth
The growth of the checkpoint inhibitors industry is propelled by several critical factors. Firstly, the increasing global incidence of cancer, coupled with an aging population, creates a larger patient pool requiring advanced treatment options. Secondly, significant advancements in immuno-oncology research have led to a deeper understanding of cancer immunology, enabling the development of more targeted and effective therapies. Thirdly, supportive government initiatives and increased healthcare spending worldwide, particularly in emerging economies, are enhancing access to these innovative treatments. Finally, the development of companion diagnostics and biomarkers is facilitating more precise patient selection, improving treatment outcomes and driving market adoption.
Challenges in the Checkpoint Inhibitors Industry Sector
Despite its rapid growth, the checkpoint inhibitors industry faces several significant challenges. High treatment costs remain a substantial barrier to access for many patients and healthcare systems, impacting market penetration in cost-sensitive regions. Complex regulatory pathways for novel drug approvals, although streamlined for promising therapies, can still lead to lengthy development timelines. The emergence of primary and secondary resistance to checkpoint inhibitors in some patient populations necessitates continuous research into combination therapies and alternative treatment strategies. Furthermore, managing the immune-related adverse events associated with these therapies requires specialized expertise and infrastructure, posing a challenge for broader clinical implementation.
Emerging Opportunities in Checkpoint Inhibitors Industry
The checkpoint inhibitors market is brimming with emerging opportunities. The expansion into new cancer indications, including a wider range of solid tumors and hematological malignancies, presents significant growth potential. The development of novel checkpoint targets, such as LAG-3, TIGIT, and TIM-3, and their combination with existing therapies promises to overcome resistance and improve response rates. The increasing application of AI and machine learning in drug discovery and patient stratification is accelerating the development of personalized immunotherapies. Furthermore, the growing focus on adjuvant and neoadjuvant settings for cancer treatment, where checkpoint inhibitors can potentially prevent recurrence and improve long-term survival, offers a vast untapped market.
Leading Players in the Checkpoint Inhibitors Industry Market
- Regeneron Pharmaceuticals Inc
- Sanofi
- AstraZeneca PLC
- Immutep Ltd
- Eli Lilly and Company
- F Hoffmann-La Roche AG
- BeiGene Ltd
- Shanghai Jhunsi Biosciences Ltd
- Merck & Co
- Bristol-Myers Squibb Company
- GlaxoSmithKline PLC
Key Developments in Checkpoint Inhibitors Industry Industry
- April 2022: Bristol Myers Squibb received the European Commission approval for Opdivo (nivolumab) with chemotherapy as first-line treatment for patients with unresectable advanced, recurrent or metastatic esophageal squamous cell carcinoma with tumor cell PD-L1 expression of 1%.
- March 2022: Merck announced the FDA approved KEYTRUDA, Merck's anti-PD-1 therapy, as a single agent for the treatment of patients with advanced endometrial carcinoma that is microsatellite instability-high(MSI-H) or mismatch repair deficient (dMMR) as determined by an approved test, who have disease progression following prior systemic therapy in any setting and are not candidates for curative surgery or radiation.
Strategic Outlook for Checkpoint Inhibitors Industry Market
The strategic outlook for the checkpoint inhibitors market remains exceptionally positive, driven by ongoing scientific innovation and an expanding therapeutic landscape. Future growth catalysts will include the continued exploration of novel checkpoint targets and combination therapies, which are crucial for overcoming treatment resistance and improving patient outcomes across a broader spectrum of cancers. The increasing application of these therapies in early-stage cancer treatment settings, such as adjuvant and neoadjuvant therapy, represents a significant opportunity to enhance survival rates and prevent recurrence. Furthermore, advancements in predictive biomarkers and companion diagnostics will enable more personalized treatment strategies, optimizing efficacy and minimizing adverse events, thereby solidifying the indispensable role of checkpoint inhibitors in modern oncology.
Checkpoint Inhibitors Industry Segmentation
-
1. Type of Inhibitors
- 1.1. CTLA-4 Inhibitors
- 1.2. PD-1 Inhibitors
- 1.3. Other Types of Inhibitors
-
2. Application
- 2.1. Hodgkin Lymphoma
- 2.2. Kidney Cancers
- 2.3. Melanoma
- 2.4. Non-small Cell Lung Cancer
- 2.5. Other Applications
-
3. Distribution Channel
- 3.1. Hospital Pharmacies
- 3.2. Retail Pharmacies
- 3.3. Online Pharmacies
Checkpoint Inhibitors Industry Segmentation By Geography
-
1. North America
- 1.1. United states
- 1.2. Canada
- 1.3. Mexico
-
2. Europe
- 2.1. Germany
- 2.2. United Kingdom
- 2.3. France
- 2.4. Italy
- 2.5. Spain
- 2.6. Rest of Europe
-
3. Asia Pacific
- 3.1. China
- 3.2. Japan
- 3.3. India
- 3.4. Australia
- 3.5. South Korea
- 3.6. Rest of Asia Pacific
-
4. Middle East and Africa
- 4.1. GCC
- 4.2. South Africa
- 4.3. Rest of Middle East and Africa
-
5. South America
- 5.1. Brazil
- 5.2. Argentina
- 5.3. Rest of South America
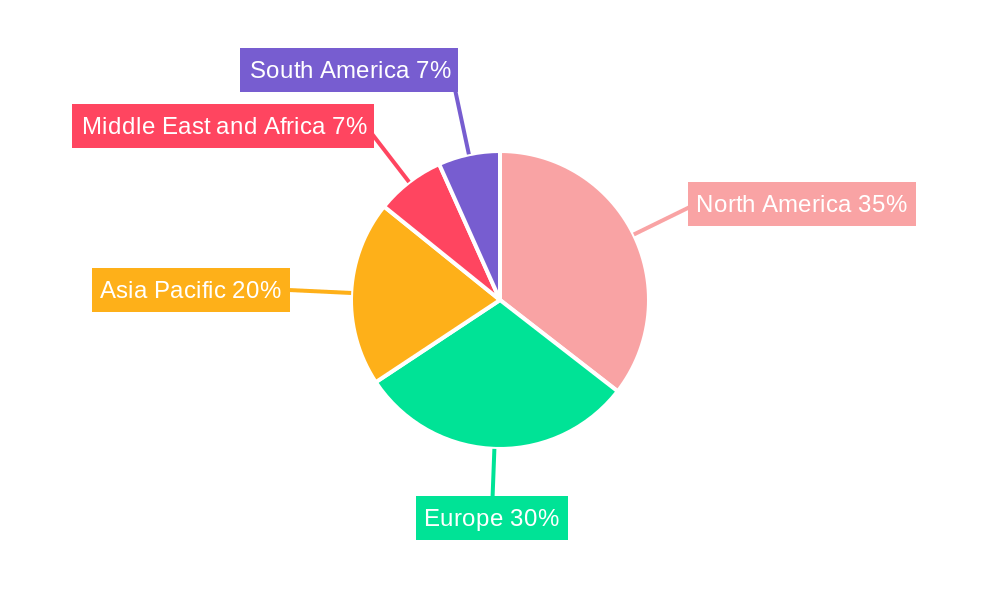
Checkpoint Inhibitors Industry Regional Market Share
Geographic Coverage of Checkpoint Inhibitors Industry
Checkpoint Inhibitors Industry REPORT HIGHLIGHTS
| Aspects | Details |
|---|---|
| Study Period | 2020-2034 |
| Base Year | 2025 |
| Estimated Year | 2026 |
| Forecast Period | 2026-2034 |
| Historical Period | 2020-2025 |
| Growth Rate | CAGR of 14.7% from 2020-2034 |
| Segmentation |
|
Table of Contents
- 1. Introduction
- 1.1. Research Scope
- 1.2. Market Segmentation
- 1.3. Research Objective
- 1.4. Definitions and Assumptions
- 2. Executive Summary
- 2.1. Market Snapshot
- 3. Market Dynamics
- 3.1. Market Drivers
- 3.2. Market Restrains
- 3.3. Market Trends
- 3.4. Market Opportunities
- 4. Market Factor Analysis
- 4.1. Porters Five Forces
- 4.1.1. Bargaining Power of Suppliers
- 4.1.2. Bargaining Power of Buyers
- 4.1.3. Threat of New Entrants
- 4.1.4. Threat of Substitutes
- 4.1.5. Competitive Rivalry
- 4.2. PESTEL analysis
- 4.3. BCG Analysis
- 4.3.1. Stars (High Growth, High Market Share)
- 4.3.2. Cash Cows (Low Growth, High Market Share)
- 4.3.3. Question Mark (High Growth, Low Market Share)
- 4.3.4. Dogs (Low Growth, Low Market Share)
- 4.4. Ansoff Matrix Analysis
- 4.5. Supply Chain Analysis
- 4.6. Regulatory Landscape
- 4.7. Current Market Potential and Opportunity Assessment (TAM–SAM–SOM Framework)
- 4.8. RAX Analyst Note
- 4.1. Porters Five Forces
- 5. Market Analysis, Insights and Forecast 2021-2033
- 5.1. Market Analysis, Insights and Forecast - by Type of Inhibitors
- 5.1.1. CTLA-4 Inhibitors
- 5.1.2. PD-1 Inhibitors
- 5.1.3. Other Types of Inhibitors
- 5.2. Market Analysis, Insights and Forecast - by Application
- 5.2.1. Hodgkin Lymphoma
- 5.2.2. Kidney Cancers
- 5.2.3. Melanoma
- 5.2.4. Non-small Cell Lung Cancer
- 5.2.5. Other Applications
- 5.3. Market Analysis, Insights and Forecast - by Distribution Channel
- 5.3.1. Hospital Pharmacies
- 5.3.2. Retail Pharmacies
- 5.3.3. Online Pharmacies
- 5.4. Market Analysis, Insights and Forecast - by Region
- 5.4.1. North America
- 5.4.2. Europe
- 5.4.3. Asia Pacific
- 5.4.4. Middle East and Africa
- 5.4.5. South America
- 5.1. Market Analysis, Insights and Forecast - by Type of Inhibitors
- 6. Global Checkpoint Inhibitors Industry Analysis, Insights and Forecast, 2021-2033
- 6.1. Market Analysis, Insights and Forecast - by Type of Inhibitors
- 6.1.1. CTLA-4 Inhibitors
- 6.1.2. PD-1 Inhibitors
- 6.1.3. Other Types of Inhibitors
- 6.2. Market Analysis, Insights and Forecast - by Application
- 6.2.1. Hodgkin Lymphoma
- 6.2.2. Kidney Cancers
- 6.2.3. Melanoma
- 6.2.4. Non-small Cell Lung Cancer
- 6.2.5. Other Applications
- 6.3. Market Analysis, Insights and Forecast - by Distribution Channel
- 6.3.1. Hospital Pharmacies
- 6.3.2. Retail Pharmacies
- 6.3.3. Online Pharmacies
- 6.1. Market Analysis, Insights and Forecast - by Type of Inhibitors
- 7. North America Checkpoint Inhibitors Industry Analysis, Insights and Forecast, 2020-2032
- 7.1. Market Analysis, Insights and Forecast - by Type of Inhibitors
- 7.1.1. CTLA-4 Inhibitors
- 7.1.2. PD-1 Inhibitors
- 7.1.3. Other Types of Inhibitors
- 7.2. Market Analysis, Insights and Forecast - by Application
- 7.2.1. Hodgkin Lymphoma
- 7.2.2. Kidney Cancers
- 7.2.3. Melanoma
- 7.2.4. Non-small Cell Lung Cancer
- 7.2.5. Other Applications
- 7.3. Market Analysis, Insights and Forecast - by Distribution Channel
- 7.3.1. Hospital Pharmacies
- 7.3.2. Retail Pharmacies
- 7.3.3. Online Pharmacies
- 7.1. Market Analysis, Insights and Forecast - by Type of Inhibitors
- 8. Europe Checkpoint Inhibitors Industry Analysis, Insights and Forecast, 2020-2032
- 8.1. Market Analysis, Insights and Forecast - by Type of Inhibitors
- 8.1.1. CTLA-4 Inhibitors
- 8.1.2. PD-1 Inhibitors
- 8.1.3. Other Types of Inhibitors
- 8.2. Market Analysis, Insights and Forecast - by Application
- 8.2.1. Hodgkin Lymphoma
- 8.2.2. Kidney Cancers
- 8.2.3. Melanoma
- 8.2.4. Non-small Cell Lung Cancer
- 8.2.5. Other Applications
- 8.3. Market Analysis, Insights and Forecast - by Distribution Channel
- 8.3.1. Hospital Pharmacies
- 8.3.2. Retail Pharmacies
- 8.3.3. Online Pharmacies
- 8.1. Market Analysis, Insights and Forecast - by Type of Inhibitors
- 9. Asia Pacific Checkpoint Inhibitors Industry Analysis, Insights and Forecast, 2020-2032
- 9.1. Market Analysis, Insights and Forecast - by Type of Inhibitors
- 9.1.1. CTLA-4 Inhibitors
- 9.1.2. PD-1 Inhibitors
- 9.1.3. Other Types of Inhibitors
- 9.2. Market Analysis, Insights and Forecast - by Application
- 9.2.1. Hodgkin Lymphoma
- 9.2.2. Kidney Cancers
- 9.2.3. Melanoma
- 9.2.4. Non-small Cell Lung Cancer
- 9.2.5. Other Applications
- 9.3. Market Analysis, Insights and Forecast - by Distribution Channel
- 9.3.1. Hospital Pharmacies
- 9.3.2. Retail Pharmacies
- 9.3.3. Online Pharmacies
- 9.1. Market Analysis, Insights and Forecast - by Type of Inhibitors
- 10. Middle East and Africa Checkpoint Inhibitors Industry Analysis, Insights and Forecast, 2020-2032
- 10.1. Market Analysis, Insights and Forecast - by Type of Inhibitors
- 10.1.1. CTLA-4 Inhibitors
- 10.1.2. PD-1 Inhibitors
- 10.1.3. Other Types of Inhibitors
- 10.2. Market Analysis, Insights and Forecast - by Application
- 10.2.1. Hodgkin Lymphoma
- 10.2.2. Kidney Cancers
- 10.2.3. Melanoma
- 10.2.4. Non-small Cell Lung Cancer
- 10.2.5. Other Applications
- 10.3. Market Analysis, Insights and Forecast - by Distribution Channel
- 10.3.1. Hospital Pharmacies
- 10.3.2. Retail Pharmacies
- 10.3.3. Online Pharmacies
- 10.1. Market Analysis, Insights and Forecast - by Type of Inhibitors
- 11. South America Checkpoint Inhibitors Industry Analysis, Insights and Forecast, 2020-2032
- 11.1. Market Analysis, Insights and Forecast - by Type of Inhibitors
- 11.1.1. CTLA-4 Inhibitors
- 11.1.2. PD-1 Inhibitors
- 11.1.3. Other Types of Inhibitors
- 11.2. Market Analysis, Insights and Forecast - by Application
- 11.2.1. Hodgkin Lymphoma
- 11.2.2. Kidney Cancers
- 11.2.3. Melanoma
- 11.2.4. Non-small Cell Lung Cancer
- 11.2.5. Other Applications
- 11.3. Market Analysis, Insights and Forecast - by Distribution Channel
- 11.3.1. Hospital Pharmacies
- 11.3.2. Retail Pharmacies
- 11.3.3. Online Pharmacies
- 11.1. Market Analysis, Insights and Forecast - by Type of Inhibitors
- 12. Competitive Analysis
- 12.1. Company Profiles
- 12.1.1 Regeneron Pharmaceuticals Inc
- 12.1.1.1. Company Overview
- 12.1.1.2. Products
- 12.1.1.3. Company Financials
- 12.1.1.4. SWOT Analysis
- 12.1.2 Sanofi
- 12.1.2.1. Company Overview
- 12.1.2.2. Products
- 12.1.2.3. Company Financials
- 12.1.2.4. SWOT Analysis
- 12.1.3 AstraZeneca PLC
- 12.1.3.1. Company Overview
- 12.1.3.2. Products
- 12.1.3.3. Company Financials
- 12.1.3.4. SWOT Analysis
- 12.1.4 Immutep Ltd*List Not Exhaustive
- 12.1.4.1. Company Overview
- 12.1.4.2. Products
- 12.1.4.3. Company Financials
- 12.1.4.4. SWOT Analysis
- 12.1.5 Eli Lilly and Company
- 12.1.5.1. Company Overview
- 12.1.5.2. Products
- 12.1.5.3. Company Financials
- 12.1.5.4. SWOT Analysis
- 12.1.6 F Hoffmann-La Roche AG
- 12.1.6.1. Company Overview
- 12.1.6.2. Products
- 12.1.6.3. Company Financials
- 12.1.6.4. SWOT Analysis
- 12.1.7 BeiGene Ltd
- 12.1.7.1. Company Overview
- 12.1.7.2. Products
- 12.1.7.3. Company Financials
- 12.1.7.4. SWOT Analysis
- 12.1.8 Shanghai Jhunsi Biosciences Ltd
- 12.1.8.1. Company Overview
- 12.1.8.2. Products
- 12.1.8.3. Company Financials
- 12.1.8.4. SWOT Analysis
- 12.1.9 Merck & Co
- 12.1.9.1. Company Overview
- 12.1.9.2. Products
- 12.1.9.3. Company Financials
- 12.1.9.4. SWOT Analysis
- 12.1.10 Bristol-Myers Squibb Company
- 12.1.10.1. Company Overview
- 12.1.10.2. Products
- 12.1.10.3. Company Financials
- 12.1.10.4. SWOT Analysis
- 12.1.11 GlaxoSmithKline PLC
- 12.1.11.1. Company Overview
- 12.1.11.2. Products
- 12.1.11.3. Company Financials
- 12.1.11.4. SWOT Analysis
- 12.1.1 Regeneron Pharmaceuticals Inc
- 12.2. Market Entropy
- 12.2.1 Company's Key Areas Served
- 12.2.2 Recent Developments
- 12.3. Company Market Share Analysis 2025
- 12.3.1 Top 5 Companies Market Share Analysis
- 12.3.2 Top 3 Companies Market Share Analysis
- 12.4. List of Potential Customers
- 13. Research Methodology
List of Figures
- Figure 1: Global Checkpoint Inhibitors Industry Revenue Breakdown (billion, %) by Region 2025 & 2033
- Figure 2: North America Checkpoint Inhibitors Industry Revenue (billion), by Type of Inhibitors 2025 & 2033
- Figure 3: North America Checkpoint Inhibitors Industry Revenue Share (%), by Type of Inhibitors 2025 & 2033
- Figure 4: North America Checkpoint Inhibitors Industry Revenue (billion), by Application 2025 & 2033
- Figure 5: North America Checkpoint Inhibitors Industry Revenue Share (%), by Application 2025 & 2033
- Figure 6: North America Checkpoint Inhibitors Industry Revenue (billion), by Distribution Channel 2025 & 2033
- Figure 7: North America Checkpoint Inhibitors Industry Revenue Share (%), by Distribution Channel 2025 & 2033
- Figure 8: North America Checkpoint Inhibitors Industry Revenue (billion), by Country 2025 & 2033
- Figure 9: North America Checkpoint Inhibitors Industry Revenue Share (%), by Country 2025 & 2033
- Figure 10: Europe Checkpoint Inhibitors Industry Revenue (billion), by Type of Inhibitors 2025 & 2033
- Figure 11: Europe Checkpoint Inhibitors Industry Revenue Share (%), by Type of Inhibitors 2025 & 2033
- Figure 12: Europe Checkpoint Inhibitors Industry Revenue (billion), by Application 2025 & 2033
- Figure 13: Europe Checkpoint Inhibitors Industry Revenue Share (%), by Application 2025 & 2033
- Figure 14: Europe Checkpoint Inhibitors Industry Revenue (billion), by Distribution Channel 2025 & 2033
- Figure 15: Europe Checkpoint Inhibitors Industry Revenue Share (%), by Distribution Channel 2025 & 2033
- Figure 16: Europe Checkpoint Inhibitors Industry Revenue (billion), by Country 2025 & 2033
- Figure 17: Europe Checkpoint Inhibitors Industry Revenue Share (%), by Country 2025 & 2033
- Figure 18: Asia Pacific Checkpoint Inhibitors Industry Revenue (billion), by Type of Inhibitors 2025 & 2033
- Figure 19: Asia Pacific Checkpoint Inhibitors Industry Revenue Share (%), by Type of Inhibitors 2025 & 2033
- Figure 20: Asia Pacific Checkpoint Inhibitors Industry Revenue (billion), by Application 2025 & 2033
- Figure 21: Asia Pacific Checkpoint Inhibitors Industry Revenue Share (%), by Application 2025 & 2033
- Figure 22: Asia Pacific Checkpoint Inhibitors Industry Revenue (billion), by Distribution Channel 2025 & 2033
- Figure 23: Asia Pacific Checkpoint Inhibitors Industry Revenue Share (%), by Distribution Channel 2025 & 2033
- Figure 24: Asia Pacific Checkpoint Inhibitors Industry Revenue (billion), by Country 2025 & 2033
- Figure 25: Asia Pacific Checkpoint Inhibitors Industry Revenue Share (%), by Country 2025 & 2033
- Figure 26: Middle East and Africa Checkpoint Inhibitors Industry Revenue (billion), by Type of Inhibitors 2025 & 2033
- Figure 27: Middle East and Africa Checkpoint Inhibitors Industry Revenue Share (%), by Type of Inhibitors 2025 & 2033
- Figure 28: Middle East and Africa Checkpoint Inhibitors Industry Revenue (billion), by Application 2025 & 2033
- Figure 29: Middle East and Africa Checkpoint Inhibitors Industry Revenue Share (%), by Application 2025 & 2033
- Figure 30: Middle East and Africa Checkpoint Inhibitors Industry Revenue (billion), by Distribution Channel 2025 & 2033
- Figure 31: Middle East and Africa Checkpoint Inhibitors Industry Revenue Share (%), by Distribution Channel 2025 & 2033
- Figure 32: Middle East and Africa Checkpoint Inhibitors Industry Revenue (billion), by Country 2025 & 2033
- Figure 33: Middle East and Africa Checkpoint Inhibitors Industry Revenue Share (%), by Country 2025 & 2033
- Figure 34: South America Checkpoint Inhibitors Industry Revenue (billion), by Type of Inhibitors 2025 & 2033
- Figure 35: South America Checkpoint Inhibitors Industry Revenue Share (%), by Type of Inhibitors 2025 & 2033
- Figure 36: South America Checkpoint Inhibitors Industry Revenue (billion), by Application 2025 & 2033
- Figure 37: South America Checkpoint Inhibitors Industry Revenue Share (%), by Application 2025 & 2033
- Figure 38: South America Checkpoint Inhibitors Industry Revenue (billion), by Distribution Channel 2025 & 2033
- Figure 39: South America Checkpoint Inhibitors Industry Revenue Share (%), by Distribution Channel 2025 & 2033
- Figure 40: South America Checkpoint Inhibitors Industry Revenue (billion), by Country 2025 & 2033
- Figure 41: South America Checkpoint Inhibitors Industry Revenue Share (%), by Country 2025 & 2033
List of Tables
- Table 1: Global Checkpoint Inhibitors Industry Revenue billion Forecast, by Type of Inhibitors 2020 & 2033
- Table 2: Global Checkpoint Inhibitors Industry Revenue billion Forecast, by Application 2020 & 2033
- Table 3: Global Checkpoint Inhibitors Industry Revenue billion Forecast, by Distribution Channel 2020 & 2033
- Table 4: Global Checkpoint Inhibitors Industry Revenue billion Forecast, by Region 2020 & 2033
- Table 5: Global Checkpoint Inhibitors Industry Revenue billion Forecast, by Type of Inhibitors 2020 & 2033
- Table 6: Global Checkpoint Inhibitors Industry Revenue billion Forecast, by Application 2020 & 2033
- Table 7: Global Checkpoint Inhibitors Industry Revenue billion Forecast, by Distribution Channel 2020 & 2033
- Table 8: Global Checkpoint Inhibitors Industry Revenue billion Forecast, by Country 2020 & 2033
- Table 9: United states Checkpoint Inhibitors Industry Revenue (billion) Forecast, by Application 2020 & 2033
- Table 10: Canada Checkpoint Inhibitors Industry Revenue (billion) Forecast, by Application 2020 & 2033
- Table 11: Mexico Checkpoint Inhibitors Industry Revenue (billion) Forecast, by Application 2020 & 2033
- Table 12: Global Checkpoint Inhibitors Industry Revenue billion Forecast, by Type of Inhibitors 2020 & 2033
- Table 13: Global Checkpoint Inhibitors Industry Revenue billion Forecast, by Application 2020 & 2033
- Table 14: Global Checkpoint Inhibitors Industry Revenue billion Forecast, by Distribution Channel 2020 & 2033
- Table 15: Global Checkpoint Inhibitors Industry Revenue billion Forecast, by Country 2020 & 2033
- Table 16: Germany Checkpoint Inhibitors Industry Revenue (billion) Forecast, by Application 2020 & 2033
- Table 17: United Kingdom Checkpoint Inhibitors Industry Revenue (billion) Forecast, by Application 2020 & 2033
- Table 18: France Checkpoint Inhibitors Industry Revenue (billion) Forecast, by Application 2020 & 2033
- Table 19: Italy Checkpoint Inhibitors Industry Revenue (billion) Forecast, by Application 2020 & 2033
- Table 20: Spain Checkpoint Inhibitors Industry Revenue (billion) Forecast, by Application 2020 & 2033
- Table 21: Rest of Europe Checkpoint Inhibitors Industry Revenue (billion) Forecast, by Application 2020 & 2033
- Table 22: Global Checkpoint Inhibitors Industry Revenue billion Forecast, by Type of Inhibitors 2020 & 2033
- Table 23: Global Checkpoint Inhibitors Industry Revenue billion Forecast, by Application 2020 & 2033
- Table 24: Global Checkpoint Inhibitors Industry Revenue billion Forecast, by Distribution Channel 2020 & 2033
- Table 25: Global Checkpoint Inhibitors Industry Revenue billion Forecast, by Country 2020 & 2033
- Table 26: China Checkpoint Inhibitors Industry Revenue (billion) Forecast, by Application 2020 & 2033
- Table 27: Japan Checkpoint Inhibitors Industry Revenue (billion) Forecast, by Application 2020 & 2033
- Table 28: India Checkpoint Inhibitors Industry Revenue (billion) Forecast, by Application 2020 & 2033
- Table 29: Australia Checkpoint Inhibitors Industry Revenue (billion) Forecast, by Application 2020 & 2033
- Table 30: South Korea Checkpoint Inhibitors Industry Revenue (billion) Forecast, by Application 2020 & 2033
- Table 31: Rest of Asia Pacific Checkpoint Inhibitors Industry Revenue (billion) Forecast, by Application 2020 & 2033
- Table 32: Global Checkpoint Inhibitors Industry Revenue billion Forecast, by Type of Inhibitors 2020 & 2033
- Table 33: Global Checkpoint Inhibitors Industry Revenue billion Forecast, by Application 2020 & 2033
- Table 34: Global Checkpoint Inhibitors Industry Revenue billion Forecast, by Distribution Channel 2020 & 2033
- Table 35: Global Checkpoint Inhibitors Industry Revenue billion Forecast, by Country 2020 & 2033
- Table 36: GCC Checkpoint Inhibitors Industry Revenue (billion) Forecast, by Application 2020 & 2033
- Table 37: South Africa Checkpoint Inhibitors Industry Revenue (billion) Forecast, by Application 2020 & 2033
- Table 38: Rest of Middle East and Africa Checkpoint Inhibitors Industry Revenue (billion) Forecast, by Application 2020 & 2033
- Table 39: Global Checkpoint Inhibitors Industry Revenue billion Forecast, by Type of Inhibitors 2020 & 2033
- Table 40: Global Checkpoint Inhibitors Industry Revenue billion Forecast, by Application 2020 & 2033
- Table 41: Global Checkpoint Inhibitors Industry Revenue billion Forecast, by Distribution Channel 2020 & 2033
- Table 42: Global Checkpoint Inhibitors Industry Revenue billion Forecast, by Country 2020 & 2033
- Table 43: Brazil Checkpoint Inhibitors Industry Revenue (billion) Forecast, by Application 2020 & 2033
- Table 44: Argentina Checkpoint Inhibitors Industry Revenue (billion) Forecast, by Application 2020 & 2033
- Table 45: Rest of South America Checkpoint Inhibitors Industry Revenue (billion) Forecast, by Application 2020 & 2033
Frequently Asked Questions
1. What is the projected Compound Annual Growth Rate (CAGR) of the Checkpoint Inhibitors Industry?
The projected CAGR is approximately 14.7%.
2. Which companies are prominent players in the Checkpoint Inhibitors Industry?
Key companies in the market include Regeneron Pharmaceuticals Inc, Sanofi, AstraZeneca PLC, Immutep Ltd*List Not Exhaustive, Eli Lilly and Company, F Hoffmann-La Roche AG, BeiGene Ltd, Shanghai Jhunsi Biosciences Ltd, Merck & Co, Bristol-Myers Squibb Company, GlaxoSmithKline PLC.
3. What are the main segments of the Checkpoint Inhibitors Industry?
The market segments include Type of Inhibitors, Application, Distribution Channel.
4. Can you provide details about the market size?
The market size is estimated to be USD 62 billion as of 2022.
5. What are some drivers contributing to market growth?
Rising Investments in R&D and Clinical Trials by the Biopharmaceutical Industry to Develop these Products; Increased Product Approvals by Regulatory Authorities and Special Designations for New Drug Molecules.
6. What are the notable trends driving market growth?
The PD-1 Inhibitors Segment is Expected to Hold the Largest Market Share in the Immune Checkpoint Inhibitors Market.
7. Are there any restraints impacting market growth?
Higher Risk of Complications Associated with the Expensive Oncology Treatment.
8. Can you provide examples of recent developments in the market?
April 2022: Bristol Myers Squibb received the European Commission approval for opdivo (nivolumab) with chemotherapy as first-line treatment for patients with unresectable advanced, recurrent or metastatic esophageal squamous cell carcinoma with tumor cell PD-L1 expression of 1%.
9. What pricing options are available for accessing the report?
Pricing options include single-user, multi-user, and enterprise licenses priced at USD 4750, USD 5250, and USD 8750 respectively.
10. Is the market size provided in terms of value or volume?
The market size is provided in terms of value, measured in billion.
11. Are there any specific market keywords associated with the report?
Yes, the market keyword associated with the report is "Checkpoint Inhibitors Industry," which aids in identifying and referencing the specific market segment covered.
12. How do I determine which pricing option suits my needs best?
The pricing options vary based on user requirements and access needs. Individual users may opt for single-user licenses, while businesses requiring broader access may choose multi-user or enterprise licenses for cost-effective access to the report.
13. Are there any additional resources or data provided in the Checkpoint Inhibitors Industry report?
While the report offers comprehensive insights, it's advisable to review the specific contents or supplementary materials provided to ascertain if additional resources or data are available.
14. How can I stay updated on further developments or reports in the Checkpoint Inhibitors Industry?
To stay informed about further developments, trends, and reports in the Checkpoint Inhibitors Industry, consider subscribing to industry newsletters, following relevant companies and organizations, or regularly checking reputable industry news sources and publications.
Methodology
Step 1 - Identification of Relevant Samples Size from Population Database


Step 2 - Approaches for Defining Global Market Size (Value, Volume* & Price*)

Note*: In applicable scenarios
Step 3 - Data Sources
Primary Research
- Web Analytics
- Survey Reports
- Research Institute
- Latest Research Reports
- Opinion Leaders
Secondary Research
- Annual Reports
- White Paper
- Latest Press Release
- Industry Association
- Paid Database
- Investor Presentations

Step 4 - Data Triangulation
Involves using different sources of information in order to increase the validity of a study
These sources are likely to be stakeholders in a program - participants, other researchers, program staff, other community members, and so on.
Then we put all data in single framework & apply various statistical tools to find out the dynamic on the market.
During the analysis stage, feedback from the stakeholder groups would be compared to determine areas of agreement as well as areas of divergence