

Key Insights
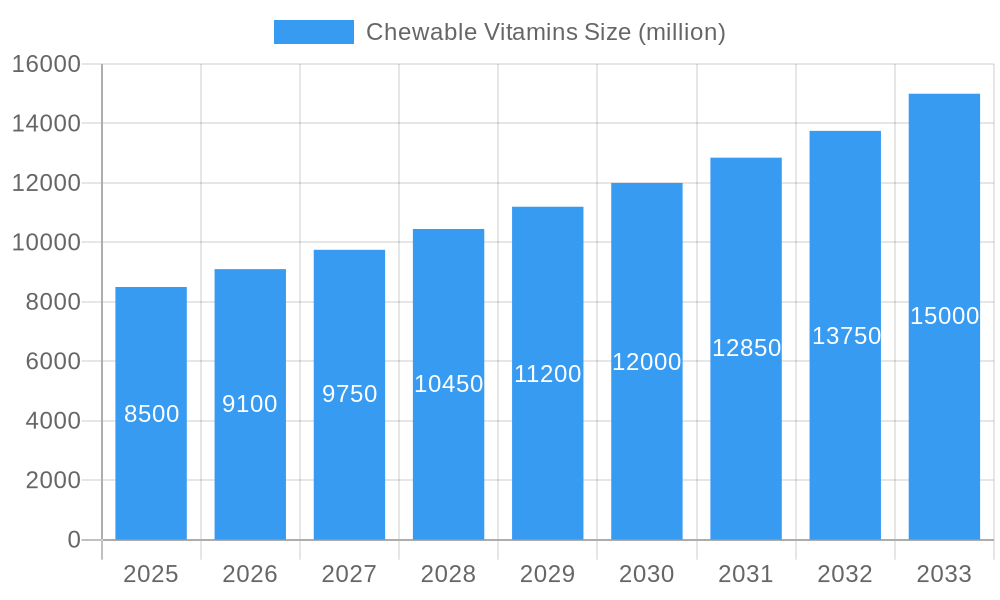
The global chewable vitamins market is projected for substantial growth, expected to reach $24.39 billion by 2033, with a Compound Annual Growth Rate (CAGR) of 14.4% from the base year 2025. This expansion is driven by increased consumer focus on preventative health and a rising demand for convenient, palatable supplements, especially among those who find traditional pills challenging. The growing accessibility through online retail channels further supports market penetration across diverse demographics. Continuous innovation in product formulations, including varied flavors, textures, and specialized health benefits like immune support and stress relief, are key growth catalysts, fostering a shift towards premium and specialized chewable vitamin offerings.
Chewable Vitamins Market Size (In Billion)
Key trends influencing the chewable vitamins market include the increasing adoption of multivitamin chewables for comprehensive nutrition and the growing demand for Vitamin C and Vitamin E due to their antioxidant and immune-boosting properties. Challenges such as sugar content in certain formulations and the necessity for stringent quality control to ensure efficacy and safety may pose limitations. Geographically, the Asia Pacific region is identified as a high-growth area, attributed to rising disposable incomes, heightened health awareness, and a large youth population. North America and Europe remain significant markets with mature consumer bases and a strong emphasis on health and wellness. Companies are focusing on product differentiation, strategic partnerships, and distribution network expansion to leverage these market dynamics.
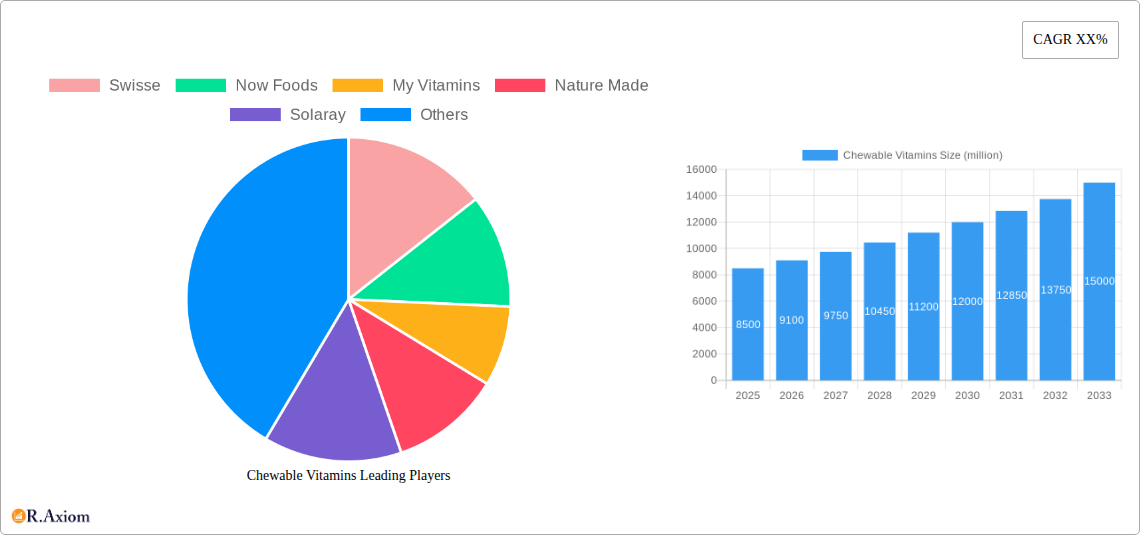
Chewable Vitamins Company Market Share
This report provides a comprehensive analysis of the global chewable vitamins market from 2019 to 2033, with a base year of 2025. It offers actionable insights into market dynamics, emerging trends, and strategic opportunities, covering key segments, regional performance, competitive landscapes, and product innovations to guide businesses in navigating and capitalizing on future growth.
Chewable Vitamins Market Concentration & Innovation
The global chewable vitamins market is characterized by a moderate level of concentration, with several key players holding significant market share. Innovation is a critical driver, fueled by increasing consumer demand for convenient and palatable dietary supplements. Companies are heavily investing in research and development to create novel formulations, improved taste profiles, and enhanced bioavailability. Regulatory frameworks play a crucial role, with stringent quality control and safety standards shaping product development and market entry. The market also faces pressure from product substitutes, such as traditional pills and powders, necessitating continuous product differentiation. End-user trends are shifting towards personalized nutrition and targeted health solutions, influencing the development of specialized chewable vitamin products. Mergers and acquisitions (M&A) activities are observed, with strategic deals aimed at expanding market reach and acquiring innovative technologies. For instance, M&A deals in the broader dietary supplement space have collectively valued over $5,000 million in recent years, indicating active consolidation. While precise market share figures for chewable vitamins are dynamic, leading companies are estimated to hold collective shares exceeding 50% of the specialized chewable vitamin segment.
Chewable Vitamins Industry Trends & Insights
The chewable vitamins industry is experiencing robust growth, propelled by a confluence of factors including rising health consciousness, a growing aging population, and increasing disposable incomes globally. The market is projected to witness a Compound Annual Growth Rate (CAGR) of approximately 7.5% over the forecast period. Key market growth drivers include the escalating demand for convenient and enjoyable ways to supplement daily nutrient intake, particularly among children and adults who struggle with swallowing pills. Technological advancements in flavor encapsulation, texture improvement, and ingredient stability are significantly enhancing the appeal and efficacy of chewable vitamin formulations. Consumer preferences are increasingly leaning towards natural ingredients, plant-based formulations, and vitamins catering to specific health concerns such as immunity, energy, and sleep. The competitive landscape is intensifying, with both established pharmaceutical and nutraceutical companies vying for market share, alongside the emergence of numerous niche brands. Market penetration in developed economies is high, while significant untapped potential exists in emerging markets, driven by growing awareness of preventive healthcare. Innovations in delivery systems and the integration of functional ingredients are also shaping consumer choices and driving market expansion, contributing to an estimated market penetration rate of over 30% in developed regions for general health supplements.
Dominant Markets & Segments in Chewable Vitamins
The multivitamin segment consistently demonstrates dominance within the chewable vitamins market, driven by its broad appeal and comprehensive nutritional offering. Consumers often opt for multivitamins as a foundational supplement to ensure a wide spectrum of essential nutrients. The online application segment is exhibiting remarkable growth, reflecting the broader e-commerce trend and the convenience it offers consumers in terms of accessibility, variety, and often competitive pricing. Online sales are projected to account for over 50% of the total chewable vitamin market by 2033.
- Dominant Region & Country: North America, particularly the United States, remains a leading market due to high consumer awareness, robust healthcare infrastructure, and significant disposable income. Europe, with its strong emphasis on health and wellness, also represents a substantial market. Asia-Pacific is emerging as a high-growth region, fueled by rising middle-class populations and increasing health expenditure.
- Application Dominance (Online vs. Offline):
- Online: Driven by convenience, wider product selection, direct-to-consumer models, and targeted digital marketing. Key drivers include the proliferation of e-commerce platforms and subscription services.
- Offline: Dominated by pharmacies, health food stores, and supermarkets. These channels benefit from impulse purchases, professional advice from pharmacists, and immediate availability.
- Type Dominance (Multivitamin, Vitamin C, Vitamin E, Others):
- Multivitamin: The cornerstone of the market, offering comprehensive nutritional support. Its dominance is fueled by general health and wellness trends.
- Vitamin C: Consistently popular due to its perceived immune-boosting properties and antioxidant benefits. Demand surges during seasonal illness periods.
- Vitamin E: Valued for its antioxidant properties and benefits for skin and hair health.
- Others: This category includes specialized vitamins like Vitamin D, B vitamins, and blends targeting specific needs (e.g., sleep, energy, cognitive function), which are gaining traction.
Chewable Vitamins Product Developments
Product developments in the chewable vitamins market are focused on enhancing palatability, improving nutritional delivery, and catering to specialized health needs. Innovations include sugar-free formulations, natural fruit flavors, and the incorporation of synergistic ingredients like probiotics and adaptogens. Companies are also developing targeted chewables for specific demographics, such as children's growth and development, women's health, and senior nutrition. The competitive advantage lies in offering unique formulations with scientifically backed ingredients, appealing taste profiles, and convenient delivery formats that resonate with modern consumer lifestyles.
Report Scope & Segmentation Analysis
This report provides a granular analysis of the chewable vitamins market segmented by application and type.
- Application: Online: This segment encompasses sales through e-commerce platforms, direct-to-consumer websites, and online marketplaces. Projected to experience substantial growth due to convenience and accessibility, with an estimated market size of over $3,000 million by 2033. Competitive dynamics include a focus on digital marketing, subscription models, and efficient logistics.
- Application: Offline: This segment includes sales through brick-and-mortar retail channels such as pharmacies, health food stores, supermarkets, and hypermarkets. While still significant, its growth is expected to be outpaced by the online segment. The estimated market size is around $2,500 million by 2033. Competitive dynamics revolve around in-store placement, promotional activities, and established retail relationships.
- Types: Vitamin C: Focuses on chewable supplements primarily delivering Vitamin C. Expected to maintain steady growth, with an estimated market size of $1,500 million by 2033. Growth drivers include consumer demand for immune support.
- Types: Vitamin E: Encompasses chewable Vitamin E supplements. Anticipated to see moderate growth, with an estimated market size of $1,000 million by 2033. Key drivers are its antioxidant and skin health benefits.
- Types: Multivitamin: This segment includes chewable multivitamins offering a broad spectrum of nutrients. It is the largest segment, projected to reach over $4,000 million by 2033. Growth is fueled by widespread consumer adoption for general wellness.
- Types: Others: This segment comprises chewable vitamins of specialized types, such as Vitamin D, B vitamins, iron, and combination formulas for specific health goals. Expected to witness the highest growth rate among all types, with an estimated market size of $1,800 million by 2033, driven by personalized nutrition trends.
Key Drivers of Chewable Vitamins Growth
Several factors are propelling the growth of the chewable vitamins market. Growing consumer awareness regarding the importance of daily nutrient intake for overall health and disease prevention is a primary driver. The increasing prevalence of lifestyle-related health issues, such as stress and fatigue, is leading consumers to seek convenient dietary solutions. Technological advancements in formulation and manufacturing have enabled the creation of more palatable and effective chewable products, appealing to a wider demographic, including children and individuals with difficulty swallowing pills. Favorable regulatory environments in many regions that support the dietary supplement industry further bolster growth. For instance, the increasing focus on preventative healthcare globally, valued in the trillions of dollars, indirectly fuels demand for supplements.
Challenges in the Chewable Vitamins Sector
Despite its growth potential, the chewable vitamins sector faces several challenges. Stringent regulatory requirements for product safety, efficacy, and labeling can pose barriers to entry for new manufacturers and necessitate significant investment in compliance. Intense competition from a wide array of brands, including established players and emerging niche companies, can lead to price wars and pressure on profit margins. The development of appealing taste profiles without compromising nutritional integrity remains a technical challenge for some formulations. Furthermore, the perception of chewable vitamins as less potent or less sophisticated than traditional forms by some consumer segments can limit market penetration. Supply chain disruptions and volatility in raw material prices can also impact production costs and product availability, with potential impacts on profitability reaching 10-15% during unforeseen events.
Emerging Opportunities in Chewable Vitamins
The chewable vitamins market is ripe with emerging opportunities. The growing trend of personalized nutrition presents a significant opportunity for companies to develop tailored chewable formulations based on individual health needs, genetic predispositions, and dietary preferences. The increasing demand for natural, organic, and plant-based ingredients offers a pathway for brands to differentiate themselves and attract health-conscious consumers. Expansion into emerging markets in Asia and Latin America, where awareness of dietary supplements is rising, represents a substantial growth avenue. Furthermore, the integration of functional ingredients beyond basic vitamins and minerals, such as probiotics, prebiotics, and adaptogens, can create innovative products with added health benefits, tapping into the wellness and functional food trend, which is projected to be worth over $200,000 million globally.
Leading Players in the Chewable Vitamins Market
- Swisse
- Now Foods
- My Vitamins
- Nature Made
- Solaray
- Sunkist
- Simply Supplements
- Holland&Barrett
- Country Life
- GNC
- China Resources Sanjiu Pharmaceutical
- CONBA
- BY-HEALTH
Key Developments in Chewable Vitamins Industry
- 2023 November: Launch of a new line of sugar-free, fruit-flavored Vitamin C chewables by Nature Made, targeting increased consumer preference for healthier options.
- 2024 January: Swisse expands its global reach through strategic partnerships in Southeast Asian markets, aiming to tap into rising health consciousness in the region.
- 2024 March: GNC introduces a range of vegan-friendly multivitamin chewables, catering to the growing vegan and plant-based consumer base.
- 2024 May: Now Foods invests in advanced flavor encapsulation technology to improve the taste and stability of its gummy vitamin formulations.
- 2024 July: Holland&Barrett reports a significant surge in online sales of their own-brand chewable supplements, highlighting the continued shift towards e-commerce.
Strategic Outlook for Chewable Vitamins Market
The strategic outlook for the chewable vitamins market remains highly positive. Continued innovation in product formulation, focusing on enhanced taste, improved bioavailability, and specialized nutritional benefits, will be crucial for sustained growth. Companies that effectively leverage digital channels for marketing and distribution, while also maintaining a strong presence in offline retail, will be best positioned to capture market share. The increasing consumer demand for transparency and natural ingredients presents an opportunity for brands to build trust and loyalty. Expanding into underserved emerging markets and developing product lines that cater to specific demographic needs and health concerns will drive future revenue streams. Strategic collaborations and potential M&A activities are also likely to shape the competitive landscape, as companies seek to consolidate their positions and acquire new capabilities. The market is poised for significant expansion, driven by a global focus on preventive healthcare and wellness.
Chewable Vitamins Segmentation
-
1. Application
- 1.1. Online
- 1.2. Offline
-
2. Types
- 2.1. Vitamin C
- 2.2. Vitamin E
- 2.3. Multivitamin
- 2.4. Others
Chewable Vitamins Segmentation By Geography
-
1. North America
- 1.1. United States
- 1.2. Canada
- 1.3. Mexico
-
2. South America
- 2.1. Brazil
- 2.2. Argentina
- 2.3. Rest of South America
-
3. Europe
- 3.1. United Kingdom
- 3.2. Germany
- 3.3. France
- 3.4. Italy
- 3.5. Spain
- 3.6. Russia
- 3.7. Benelux
- 3.8. Nordics
- 3.9. Rest of Europe
-
4. Middle East & Africa
- 4.1. Turkey
- 4.2. Israel
- 4.3. GCC
- 4.4. North Africa
- 4.5. South Africa
- 4.6. Rest of Middle East & Africa
-
5. Asia Pacific
- 5.1. China
- 5.2. India
- 5.3. Japan
- 5.4. South Korea
- 5.5. ASEAN
- 5.6. Oceania
- 5.7. Rest of Asia Pacific
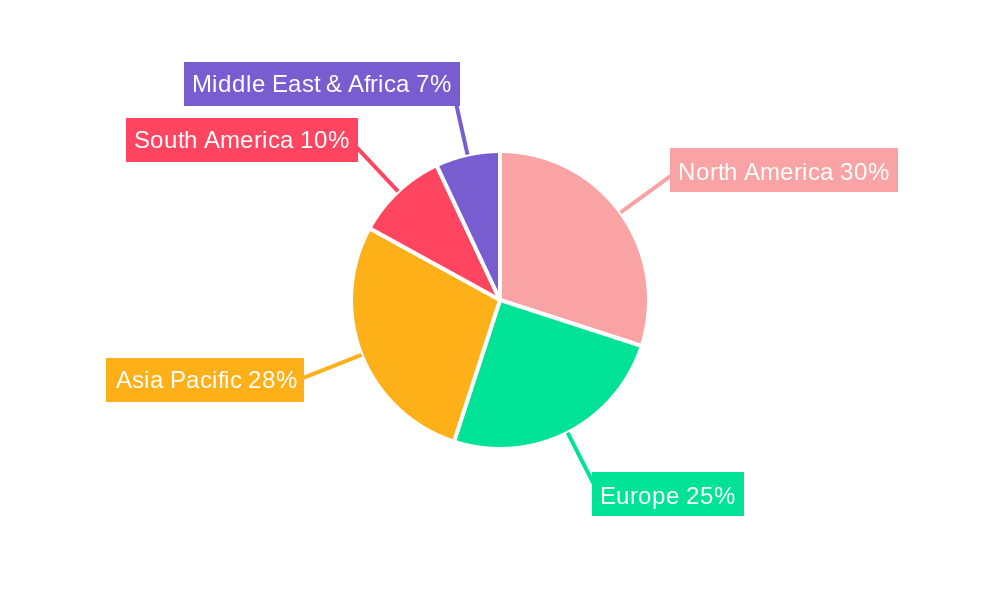
Chewable Vitamins Regional Market Share
Geographic Coverage of Chewable Vitamins
Chewable Vitamins REPORT HIGHLIGHTS
| Aspects | Details |
|---|---|
| Study Period | 2020-2034 |
| Base Year | 2025 |
| Estimated Year | 2026 |
| Forecast Period | 2026-2034 |
| Historical Period | 2020-2025 |
| Growth Rate | CAGR of 14.4% from 2020-2034 |
| Segmentation |
|
Table of Contents
- 1. Introduction
- 1.1. Research Scope
- 1.2. Market Segmentation
- 1.3. Research Objective
- 1.4. Definitions and Assumptions
- 2. Executive Summary
- 2.1. Market Snapshot
- 3. Market Dynamics
- 3.1. Market Drivers
- 3.2. Market Restrains
- 3.3. Market Trends
- 3.4. Market Opportunities
- 4. Market Factor Analysis
- 4.1. Porters Five Forces
- 4.1.1. Bargaining Power of Suppliers
- 4.1.2. Bargaining Power of Buyers
- 4.1.3. Threat of New Entrants
- 4.1.4. Threat of Substitutes
- 4.1.5. Competitive Rivalry
- 4.2. PESTEL analysis
- 4.3. BCG Analysis
- 4.3.1. Stars (High Growth, High Market Share)
- 4.3.2. Cash Cows (Low Growth, High Market Share)
- 4.3.3. Question Mark (High Growth, Low Market Share)
- 4.3.4. Dogs (Low Growth, Low Market Share)
- 4.4. Ansoff Matrix Analysis
- 4.5. Supply Chain Analysis
- 4.6. Regulatory Landscape
- 4.7. Current Market Potential and Opportunity Assessment (TAM–SAM–SOM Framework)
- 4.8. RAX Analyst Note
- 4.1. Porters Five Forces
- 5. Market Analysis, Insights and Forecast 2021-2033
- 5.1. Market Analysis, Insights and Forecast - by Application
- 5.1.1. Online
- 5.1.2. Offline
- 5.2. Market Analysis, Insights and Forecast - by Types
- 5.2.1. Vitamin C
- 5.2.2. Vitamin E
- 5.2.3. Multivitamin
- 5.2.4. Others
- 5.3. Market Analysis, Insights and Forecast - by Region
- 5.3.1. North America
- 5.3.2. South America
- 5.3.3. Europe
- 5.3.4. Middle East & Africa
- 5.3.5. Asia Pacific
- 5.1. Market Analysis, Insights and Forecast - by Application
- 6. Global Chewable Vitamins Analysis, Insights and Forecast, 2021-2033
- 6.1. Market Analysis, Insights and Forecast - by Application
- 6.1.1. Online
- 6.1.2. Offline
- 6.2. Market Analysis, Insights and Forecast - by Types
- 6.2.1. Vitamin C
- 6.2.2. Vitamin E
- 6.2.3. Multivitamin
- 6.2.4. Others
- 6.1. Market Analysis, Insights and Forecast - by Application
- 7. North America Chewable Vitamins Analysis, Insights and Forecast, 2020-2032
- 7.1. Market Analysis, Insights and Forecast - by Application
- 7.1.1. Online
- 7.1.2. Offline
- 7.2. Market Analysis, Insights and Forecast - by Types
- 7.2.1. Vitamin C
- 7.2.2. Vitamin E
- 7.2.3. Multivitamin
- 7.2.4. Others
- 7.1. Market Analysis, Insights and Forecast - by Application
- 8. South America Chewable Vitamins Analysis, Insights and Forecast, 2020-2032
- 8.1. Market Analysis, Insights and Forecast - by Application
- 8.1.1. Online
- 8.1.2. Offline
- 8.2. Market Analysis, Insights and Forecast - by Types
- 8.2.1. Vitamin C
- 8.2.2. Vitamin E
- 8.2.3. Multivitamin
- 8.2.4. Others
- 8.1. Market Analysis, Insights and Forecast - by Application
- 9. Europe Chewable Vitamins Analysis, Insights and Forecast, 2020-2032
- 9.1. Market Analysis, Insights and Forecast - by Application
- 9.1.1. Online
- 9.1.2. Offline
- 9.2. Market Analysis, Insights and Forecast - by Types
- 9.2.1. Vitamin C
- 9.2.2. Vitamin E
- 9.2.3. Multivitamin
- 9.2.4. Others
- 9.1. Market Analysis, Insights and Forecast - by Application
- 10. Middle East & Africa Chewable Vitamins Analysis, Insights and Forecast, 2020-2032
- 10.1. Market Analysis, Insights and Forecast - by Application
- 10.1.1. Online
- 10.1.2. Offline
- 10.2. Market Analysis, Insights and Forecast - by Types
- 10.2.1. Vitamin C
- 10.2.2. Vitamin E
- 10.2.3. Multivitamin
- 10.2.4. Others
- 10.1. Market Analysis, Insights and Forecast - by Application
- 11. Asia Pacific Chewable Vitamins Analysis, Insights and Forecast, 2020-2032
- 11.1. Market Analysis, Insights and Forecast - by Application
- 11.1.1. Online
- 11.1.2. Offline
- 11.2. Market Analysis, Insights and Forecast - by Types
- 11.2.1. Vitamin C
- 11.2.2. Vitamin E
- 11.2.3. Multivitamin
- 11.2.4. Others
- 11.1. Market Analysis, Insights and Forecast - by Application
- 12. Competitive Analysis
- 12.1. Company Profiles
- 12.1.1 Swisse
- 12.1.1.1. Company Overview
- 12.1.1.2. Products
- 12.1.1.3. Company Financials
- 12.1.1.4. SWOT Analysis
- 12.1.2 Now Foods
- 12.1.2.1. Company Overview
- 12.1.2.2. Products
- 12.1.2.3. Company Financials
- 12.1.2.4. SWOT Analysis
- 12.1.3 My Vitamins
- 12.1.3.1. Company Overview
- 12.1.3.2. Products
- 12.1.3.3. Company Financials
- 12.1.3.4. SWOT Analysis
- 12.1.4 Nature Made
- 12.1.4.1. Company Overview
- 12.1.4.2. Products
- 12.1.4.3. Company Financials
- 12.1.4.4. SWOT Analysis
- 12.1.5 Solaray
- 12.1.5.1. Company Overview
- 12.1.5.2. Products
- 12.1.5.3. Company Financials
- 12.1.5.4. SWOT Analysis
- 12.1.6 Sunkist
- 12.1.6.1. Company Overview
- 12.1.6.2. Products
- 12.1.6.3. Company Financials
- 12.1.6.4. SWOT Analysis
- 12.1.7 Simply Supplements
- 12.1.7.1. Company Overview
- 12.1.7.2. Products
- 12.1.7.3. Company Financials
- 12.1.7.4. SWOT Analysis
- 12.1.8 Holland&Barrett
- 12.1.8.1. Company Overview
- 12.1.8.2. Products
- 12.1.8.3. Company Financials
- 12.1.8.4. SWOT Analysis
- 12.1.9 Country Life
- 12.1.9.1. Company Overview
- 12.1.9.2. Products
- 12.1.9.3. Company Financials
- 12.1.9.4. SWOT Analysis
- 12.1.10 GNC
- 12.1.10.1. Company Overview
- 12.1.10.2. Products
- 12.1.10.3. Company Financials
- 12.1.10.4. SWOT Analysis
- 12.1.11 China Resources Sanjiu Pharmaceutical
- 12.1.11.1. Company Overview
- 12.1.11.2. Products
- 12.1.11.3. Company Financials
- 12.1.11.4. SWOT Analysis
- 12.1.12 CONBA
- 12.1.12.1. Company Overview
- 12.1.12.2. Products
- 12.1.12.3. Company Financials
- 12.1.12.4. SWOT Analysis
- 12.1.13 BY-HEALTH
- 12.1.13.1. Company Overview
- 12.1.13.2. Products
- 12.1.13.3. Company Financials
- 12.1.13.4. SWOT Analysis
- 12.1.1 Swisse
- 12.2. Market Entropy
- 12.2.1 Company's Key Areas Served
- 12.2.2 Recent Developments
- 12.3. Company Market Share Analysis 2025
- 12.3.1 Top 5 Companies Market Share Analysis
- 12.3.2 Top 3 Companies Market Share Analysis
- 12.4. List of Potential Customers
- 13. Research Methodology
List of Figures
- Figure 1: Global Chewable Vitamins Revenue Breakdown (billion, %) by Region 2025 & 2033
- Figure 2: Global Chewable Vitamins Volume Breakdown (K, %) by Region 2025 & 2033
- Figure 3: North America Chewable Vitamins Revenue (billion), by Application 2025 & 2033
- Figure 4: North America Chewable Vitamins Volume (K), by Application 2025 & 2033
- Figure 5: North America Chewable Vitamins Revenue Share (%), by Application 2025 & 2033
- Figure 6: North America Chewable Vitamins Volume Share (%), by Application 2025 & 2033
- Figure 7: North America Chewable Vitamins Revenue (billion), by Types 2025 & 2033
- Figure 8: North America Chewable Vitamins Volume (K), by Types 2025 & 2033
- Figure 9: North America Chewable Vitamins Revenue Share (%), by Types 2025 & 2033
- Figure 10: North America Chewable Vitamins Volume Share (%), by Types 2025 & 2033
- Figure 11: North America Chewable Vitamins Revenue (billion), by Country 2025 & 2033
- Figure 12: North America Chewable Vitamins Volume (K), by Country 2025 & 2033
- Figure 13: North America Chewable Vitamins Revenue Share (%), by Country 2025 & 2033
- Figure 14: North America Chewable Vitamins Volume Share (%), by Country 2025 & 2033
- Figure 15: South America Chewable Vitamins Revenue (billion), by Application 2025 & 2033
- Figure 16: South America Chewable Vitamins Volume (K), by Application 2025 & 2033
- Figure 17: South America Chewable Vitamins Revenue Share (%), by Application 2025 & 2033
- Figure 18: South America Chewable Vitamins Volume Share (%), by Application 2025 & 2033
- Figure 19: South America Chewable Vitamins Revenue (billion), by Types 2025 & 2033
- Figure 20: South America Chewable Vitamins Volume (K), by Types 2025 & 2033
- Figure 21: South America Chewable Vitamins Revenue Share (%), by Types 2025 & 2033
- Figure 22: South America Chewable Vitamins Volume Share (%), by Types 2025 & 2033
- Figure 23: South America Chewable Vitamins Revenue (billion), by Country 2025 & 2033
- Figure 24: South America Chewable Vitamins Volume (K), by Country 2025 & 2033
- Figure 25: South America Chewable Vitamins Revenue Share (%), by Country 2025 & 2033
- Figure 26: South America Chewable Vitamins Volume Share (%), by Country 2025 & 2033
- Figure 27: Europe Chewable Vitamins Revenue (billion), by Application 2025 & 2033
- Figure 28: Europe Chewable Vitamins Volume (K), by Application 2025 & 2033
- Figure 29: Europe Chewable Vitamins Revenue Share (%), by Application 2025 & 2033
- Figure 30: Europe Chewable Vitamins Volume Share (%), by Application 2025 & 2033
- Figure 31: Europe Chewable Vitamins Revenue (billion), by Types 2025 & 2033
- Figure 32: Europe Chewable Vitamins Volume (K), by Types 2025 & 2033
- Figure 33: Europe Chewable Vitamins Revenue Share (%), by Types 2025 & 2033
- Figure 34: Europe Chewable Vitamins Volume Share (%), by Types 2025 & 2033
- Figure 35: Europe Chewable Vitamins Revenue (billion), by Country 2025 & 2033
- Figure 36: Europe Chewable Vitamins Volume (K), by Country 2025 & 2033
- Figure 37: Europe Chewable Vitamins Revenue Share (%), by Country 2025 & 2033
- Figure 38: Europe Chewable Vitamins Volume Share (%), by Country 2025 & 2033
- Figure 39: Middle East & Africa Chewable Vitamins Revenue (billion), by Application 2025 & 2033
- Figure 40: Middle East & Africa Chewable Vitamins Volume (K), by Application 2025 & 2033
- Figure 41: Middle East & Africa Chewable Vitamins Revenue Share (%), by Application 2025 & 2033
- Figure 42: Middle East & Africa Chewable Vitamins Volume Share (%), by Application 2025 & 2033
- Figure 43: Middle East & Africa Chewable Vitamins Revenue (billion), by Types 2025 & 2033
- Figure 44: Middle East & Africa Chewable Vitamins Volume (K), by Types 2025 & 2033
- Figure 45: Middle East & Africa Chewable Vitamins Revenue Share (%), by Types 2025 & 2033
- Figure 46: Middle East & Africa Chewable Vitamins Volume Share (%), by Types 2025 & 2033
- Figure 47: Middle East & Africa Chewable Vitamins Revenue (billion), by Country 2025 & 2033
- Figure 48: Middle East & Africa Chewable Vitamins Volume (K), by Country 2025 & 2033
- Figure 49: Middle East & Africa Chewable Vitamins Revenue Share (%), by Country 2025 & 2033
- Figure 50: Middle East & Africa Chewable Vitamins Volume Share (%), by Country 2025 & 2033
- Figure 51: Asia Pacific Chewable Vitamins Revenue (billion), by Application 2025 & 2033
- Figure 52: Asia Pacific Chewable Vitamins Volume (K), by Application 2025 & 2033
- Figure 53: Asia Pacific Chewable Vitamins Revenue Share (%), by Application 2025 & 2033
- Figure 54: Asia Pacific Chewable Vitamins Volume Share (%), by Application 2025 & 2033
- Figure 55: Asia Pacific Chewable Vitamins Revenue (billion), by Types 2025 & 2033
- Figure 56: Asia Pacific Chewable Vitamins Volume (K), by Types 2025 & 2033
- Figure 57: Asia Pacific Chewable Vitamins Revenue Share (%), by Types 2025 & 2033
- Figure 58: Asia Pacific Chewable Vitamins Volume Share (%), by Types 2025 & 2033
- Figure 59: Asia Pacific Chewable Vitamins Revenue (billion), by Country 2025 & 2033
- Figure 60: Asia Pacific Chewable Vitamins Volume (K), by Country 2025 & 2033
- Figure 61: Asia Pacific Chewable Vitamins Revenue Share (%), by Country 2025 & 2033
- Figure 62: Asia Pacific Chewable Vitamins Volume Share (%), by Country 2025 & 2033
List of Tables
- Table 1: Global Chewable Vitamins Revenue billion Forecast, by Application 2020 & 2033
- Table 2: Global Chewable Vitamins Volume K Forecast, by Application 2020 & 2033
- Table 3: Global Chewable Vitamins Revenue billion Forecast, by Types 2020 & 2033
- Table 4: Global Chewable Vitamins Volume K Forecast, by Types 2020 & 2033
- Table 5: Global Chewable Vitamins Revenue billion Forecast, by Region 2020 & 2033
- Table 6: Global Chewable Vitamins Volume K Forecast, by Region 2020 & 2033
- Table 7: Global Chewable Vitamins Revenue billion Forecast, by Application 2020 & 2033
- Table 8: Global Chewable Vitamins Volume K Forecast, by Application 2020 & 2033
- Table 9: Global Chewable Vitamins Revenue billion Forecast, by Types 2020 & 2033
- Table 10: Global Chewable Vitamins Volume K Forecast, by Types 2020 & 2033
- Table 11: Global Chewable Vitamins Revenue billion Forecast, by Country 2020 & 2033
- Table 12: Global Chewable Vitamins Volume K Forecast, by Country 2020 & 2033
- Table 13: United States Chewable Vitamins Revenue (billion) Forecast, by Application 2020 & 2033
- Table 14: United States Chewable Vitamins Volume (K) Forecast, by Application 2020 & 2033
- Table 15: Canada Chewable Vitamins Revenue (billion) Forecast, by Application 2020 & 2033
- Table 16: Canada Chewable Vitamins Volume (K) Forecast, by Application 2020 & 2033
- Table 17: Mexico Chewable Vitamins Revenue (billion) Forecast, by Application 2020 & 2033
- Table 18: Mexico Chewable Vitamins Volume (K) Forecast, by Application 2020 & 2033
- Table 19: Global Chewable Vitamins Revenue billion Forecast, by Application 2020 & 2033
- Table 20: Global Chewable Vitamins Volume K Forecast, by Application 2020 & 2033
- Table 21: Global Chewable Vitamins Revenue billion Forecast, by Types 2020 & 2033
- Table 22: Global Chewable Vitamins Volume K Forecast, by Types 2020 & 2033
- Table 23: Global Chewable Vitamins Revenue billion Forecast, by Country 2020 & 2033
- Table 24: Global Chewable Vitamins Volume K Forecast, by Country 2020 & 2033
- Table 25: Brazil Chewable Vitamins Revenue (billion) Forecast, by Application 2020 & 2033
- Table 26: Brazil Chewable Vitamins Volume (K) Forecast, by Application 2020 & 2033
- Table 27: Argentina Chewable Vitamins Revenue (billion) Forecast, by Application 2020 & 2033
- Table 28: Argentina Chewable Vitamins Volume (K) Forecast, by Application 2020 & 2033
- Table 29: Rest of South America Chewable Vitamins Revenue (billion) Forecast, by Application 2020 & 2033
- Table 30: Rest of South America Chewable Vitamins Volume (K) Forecast, by Application 2020 & 2033
- Table 31: Global Chewable Vitamins Revenue billion Forecast, by Application 2020 & 2033
- Table 32: Global Chewable Vitamins Volume K Forecast, by Application 2020 & 2033
- Table 33: Global Chewable Vitamins Revenue billion Forecast, by Types 2020 & 2033
- Table 34: Global Chewable Vitamins Volume K Forecast, by Types 2020 & 2033
- Table 35: Global Chewable Vitamins Revenue billion Forecast, by Country 2020 & 2033
- Table 36: Global Chewable Vitamins Volume K Forecast, by Country 2020 & 2033
- Table 37: United Kingdom Chewable Vitamins Revenue (billion) Forecast, by Application 2020 & 2033
- Table 38: United Kingdom Chewable Vitamins Volume (K) Forecast, by Application 2020 & 2033
- Table 39: Germany Chewable Vitamins Revenue (billion) Forecast, by Application 2020 & 2033
- Table 40: Germany Chewable Vitamins Volume (K) Forecast, by Application 2020 & 2033
- Table 41: France Chewable Vitamins Revenue (billion) Forecast, by Application 2020 & 2033
- Table 42: France Chewable Vitamins Volume (K) Forecast, by Application 2020 & 2033
- Table 43: Italy Chewable Vitamins Revenue (billion) Forecast, by Application 2020 & 2033
- Table 44: Italy Chewable Vitamins Volume (K) Forecast, by Application 2020 & 2033
- Table 45: Spain Chewable Vitamins Revenue (billion) Forecast, by Application 2020 & 2033
- Table 46: Spain Chewable Vitamins Volume (K) Forecast, by Application 2020 & 2033
- Table 47: Russia Chewable Vitamins Revenue (billion) Forecast, by Application 2020 & 2033
- Table 48: Russia Chewable Vitamins Volume (K) Forecast, by Application 2020 & 2033
- Table 49: Benelux Chewable Vitamins Revenue (billion) Forecast, by Application 2020 & 2033
- Table 50: Benelux Chewable Vitamins Volume (K) Forecast, by Application 2020 & 2033
- Table 51: Nordics Chewable Vitamins Revenue (billion) Forecast, by Application 2020 & 2033
- Table 52: Nordics Chewable Vitamins Volume (K) Forecast, by Application 2020 & 2033
- Table 53: Rest of Europe Chewable Vitamins Revenue (billion) Forecast, by Application 2020 & 2033
- Table 54: Rest of Europe Chewable Vitamins Volume (K) Forecast, by Application 2020 & 2033
- Table 55: Global Chewable Vitamins Revenue billion Forecast, by Application 2020 & 2033
- Table 56: Global Chewable Vitamins Volume K Forecast, by Application 2020 & 2033
- Table 57: Global Chewable Vitamins Revenue billion Forecast, by Types 2020 & 2033
- Table 58: Global Chewable Vitamins Volume K Forecast, by Types 2020 & 2033
- Table 59: Global Chewable Vitamins Revenue billion Forecast, by Country 2020 & 2033
- Table 60: Global Chewable Vitamins Volume K Forecast, by Country 2020 & 2033
- Table 61: Turkey Chewable Vitamins Revenue (billion) Forecast, by Application 2020 & 2033
- Table 62: Turkey Chewable Vitamins Volume (K) Forecast, by Application 2020 & 2033
- Table 63: Israel Chewable Vitamins Revenue (billion) Forecast, by Application 2020 & 2033
- Table 64: Israel Chewable Vitamins Volume (K) Forecast, by Application 2020 & 2033
- Table 65: GCC Chewable Vitamins Revenue (billion) Forecast, by Application 2020 & 2033
- Table 66: GCC Chewable Vitamins Volume (K) Forecast, by Application 2020 & 2033
- Table 67: North Africa Chewable Vitamins Revenue (billion) Forecast, by Application 2020 & 2033
- Table 68: North Africa Chewable Vitamins Volume (K) Forecast, by Application 2020 & 2033
- Table 69: South Africa Chewable Vitamins Revenue (billion) Forecast, by Application 2020 & 2033
- Table 70: South Africa Chewable Vitamins Volume (K) Forecast, by Application 2020 & 2033
- Table 71: Rest of Middle East & Africa Chewable Vitamins Revenue (billion) Forecast, by Application 2020 & 2033
- Table 72: Rest of Middle East & Africa Chewable Vitamins Volume (K) Forecast, by Application 2020 & 2033
- Table 73: Global Chewable Vitamins Revenue billion Forecast, by Application 2020 & 2033
- Table 74: Global Chewable Vitamins Volume K Forecast, by Application 2020 & 2033
- Table 75: Global Chewable Vitamins Revenue billion Forecast, by Types 2020 & 2033
- Table 76: Global Chewable Vitamins Volume K Forecast, by Types 2020 & 2033
- Table 77: Global Chewable Vitamins Revenue billion Forecast, by Country 2020 & 2033
- Table 78: Global Chewable Vitamins Volume K Forecast, by Country 2020 & 2033
- Table 79: China Chewable Vitamins Revenue (billion) Forecast, by Application 2020 & 2033
- Table 80: China Chewable Vitamins Volume (K) Forecast, by Application 2020 & 2033
- Table 81: India Chewable Vitamins Revenue (billion) Forecast, by Application 2020 & 2033
- Table 82: India Chewable Vitamins Volume (K) Forecast, by Application 2020 & 2033
- Table 83: Japan Chewable Vitamins Revenue (billion) Forecast, by Application 2020 & 2033
- Table 84: Japan Chewable Vitamins Volume (K) Forecast, by Application 2020 & 2033
- Table 85: South Korea Chewable Vitamins Revenue (billion) Forecast, by Application 2020 & 2033
- Table 86: South Korea Chewable Vitamins Volume (K) Forecast, by Application 2020 & 2033
- Table 87: ASEAN Chewable Vitamins Revenue (billion) Forecast, by Application 2020 & 2033
- Table 88: ASEAN Chewable Vitamins Volume (K) Forecast, by Application 2020 & 2033
- Table 89: Oceania Chewable Vitamins Revenue (billion) Forecast, by Application 2020 & 2033
- Table 90: Oceania Chewable Vitamins Volume (K) Forecast, by Application 2020 & 2033
- Table 91: Rest of Asia Pacific Chewable Vitamins Revenue (billion) Forecast, by Application 2020 & 2033
- Table 92: Rest of Asia Pacific Chewable Vitamins Volume (K) Forecast, by Application 2020 & 2033
Frequently Asked Questions
1. What is the projected Compound Annual Growth Rate (CAGR) of the Chewable Vitamins?
The projected CAGR is approximately 14.4%.
2. Which companies are prominent players in the Chewable Vitamins?
Key companies in the market include Swisse, Now Foods, My Vitamins, Nature Made, Solaray, Sunkist, Simply Supplements, Holland&Barrett, Country Life, GNC, China Resources Sanjiu Pharmaceutical, CONBA, BY-HEALTH.
3. What are the main segments of the Chewable Vitamins?
The market segments include Application, Types.
4. Can you provide details about the market size?
The market size is estimated to be USD 24.39 billion as of 2022.
5. What are some drivers contributing to market growth?
N/A
6. What are the notable trends driving market growth?
N/A
7. Are there any restraints impacting market growth?
N/A
8. Can you provide examples of recent developments in the market?
N/A
9. What pricing options are available for accessing the report?
Pricing options include single-user, multi-user, and enterprise licenses priced at USD 3950.00, USD 5925.00, and USD 7900.00 respectively.
10. Is the market size provided in terms of value or volume?
The market size is provided in terms of value, measured in billion and volume, measured in K.
11. Are there any specific market keywords associated with the report?
Yes, the market keyword associated with the report is "Chewable Vitamins," which aids in identifying and referencing the specific market segment covered.
12. How do I determine which pricing option suits my needs best?
The pricing options vary based on user requirements and access needs. Individual users may opt for single-user licenses, while businesses requiring broader access may choose multi-user or enterprise licenses for cost-effective access to the report.
13. Are there any additional resources or data provided in the Chewable Vitamins report?
While the report offers comprehensive insights, it's advisable to review the specific contents or supplementary materials provided to ascertain if additional resources or data are available.
14. How can I stay updated on further developments or reports in the Chewable Vitamins?
To stay informed about further developments, trends, and reports in the Chewable Vitamins, consider subscribing to industry newsletters, following relevant companies and organizations, or regularly checking reputable industry news sources and publications.
Methodology
Step 1 - Identification of Relevant Samples Size from Population Database


Step 2 - Approaches for Defining Global Market Size (Value, Volume* & Price*)

Note*: In applicable scenarios
Step 3 - Data Sources
Primary Research
- Web Analytics
- Survey Reports
- Research Institute
- Latest Research Reports
- Opinion Leaders
Secondary Research
- Annual Reports
- White Paper
- Latest Press Release
- Industry Association
- Paid Database
- Investor Presentations

Step 4 - Data Triangulation
Involves using different sources of information in order to increase the validity of a study
These sources are likely to be stakeholders in a program - participants, other researchers, program staff, other community members, and so on.
Then we put all data in single framework & apply various statistical tools to find out the dynamic on the market.
During the analysis stage, feedback from the stakeholder groups would be compared to determine areas of agreement as well as areas of divergence