
Key Insights
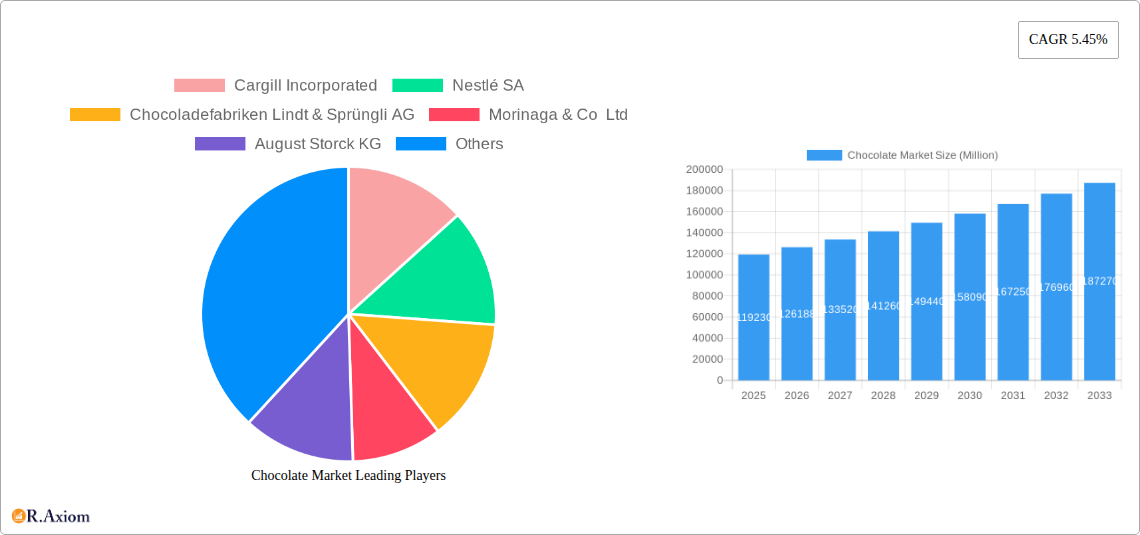
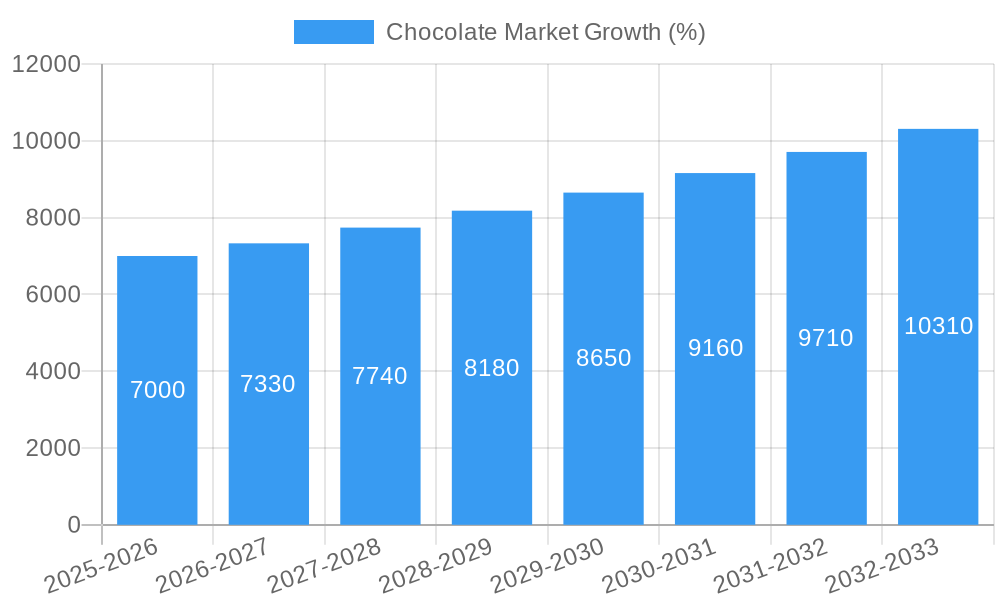
The global chocolate market, valued at $119.23 billion in 2025, is projected to experience robust growth, exhibiting a Compound Annual Growth Rate (CAGR) of 5.45% from 2025 to 2033. This expansion is driven by several key factors. Rising disposable incomes, particularly in emerging economies across Asia-Pacific and South America, are fueling increased consumer spending on premium and indulgent food products, including chocolate. The growing popularity of convenient snacking options and the increasing demand for healthier chocolate alternatives, such as dark chocolate with higher cocoa content and reduced sugar, are also significant drivers. Furthermore, innovative product development, encompassing unique flavors, textures, and formats (e.g., chocolate bars with inclusions, gourmet chocolate assortments), is stimulating market dynamism and attracting new consumer segments. The diverse distribution channels, including online retail, supermarkets, and convenience stores, provide ample opportunities for market penetration and expansion.
However, the market also faces certain challenges. Fluctuations in cocoa bean prices, a key raw material, can impact profitability and product pricing. Increasing health consciousness among consumers might lead to some degree of substitution towards healthier alternatives. Furthermore, stringent regulations regarding food safety and labeling in certain regions can impose additional costs on manufacturers. Despite these restraints, the overall market outlook remains positive, fueled by sustained demand and the ongoing innovation within the chocolate industry. The segmentation analysis reveals that dark chocolate is gaining popularity due to its perceived health benefits, while online retail channels are experiencing rapid growth reflecting evolving consumer purchasing habits. Major players like Nestlé, Mars, and Ferrero are likely to continue dominating the market landscape through their established brand recognition and extensive distribution networks.
This in-depth report provides a comprehensive analysis of the global chocolate market, covering the period 2019-2033, with a focus on market trends, competitive landscape, and future growth opportunities. The report is essential for industry stakeholders, investors, and businesses seeking to understand and capitalize on the evolving dynamics of this lucrative sector. With a base year of 2025 and an estimated year of 2025, the forecast period extends to 2033, offering valuable insights into long-term market projections. The historical period analyzed is 2019-2024. The market size is valued in Millions USD throughout the report.
Chocolate Market Concentration & Innovation
The global chocolate market exhibits a moderately concentrated structure, dominated by several multinational corporations. Key players such as Nestlé SA, Mars Incorporated, Ferrero International SA, and Mondelez International Inc. hold significant market share, collectively accounting for approximately xx% of the global market in 2024. Smaller, regional players, however, also contribute significantly to the market's dynamism and innovation.
Market Concentration Metrics (2024):
- Top 5 players market share: xx%
- Herfindahl-Hirschman Index (HHI): xx
- Average market share of top 10 players: xx%
Innovation Drivers:
- Sustainability: Growing consumer demand for ethically sourced cocoa and sustainable packaging is driving innovation in supply chain traceability and environmentally friendly practices.
- Health & Wellness: The increasing popularity of dark chocolate, owing to its perceived health benefits, is prompting the development of functional chocolates with added nutrients and reduced sugar content.
- Product Diversification: Companies are continuously innovating with new flavors, formats (e.g., chocolate bars, confectionery, drinks), and product categories to cater to diverse consumer preferences.
- Technological Advancements: Automation in production processes, advanced packaging technologies, and digital marketing strategies are improving efficiency and enhancing consumer experiences.
Regulatory Frameworks:
Stringent regulations regarding food safety, labeling, and ethical sourcing of cocoa are impacting market dynamics. These regulations vary across regions and influence product development and supply chain practices.
Product Substitutes:
Alternative confectionery products and healthier snacks pose some competitive pressure, particularly within specific consumer segments.
M&A Activities: The chocolate market has witnessed several significant mergers and acquisitions in recent years, driven by the need for expansion, product diversification, and enhanced market share. Recent deals have involved transactions valued at xx Million USD collectively. Examples include Ferrero's acquisition of Dori Alimentos in 2023.
Chocolate Market Industry Trends & Insights
The global chocolate market is witnessing robust growth, driven by several key factors. Rising disposable incomes, especially in emerging economies, are fueling increased consumption of chocolate. Changing consumer lifestyles and preferences, including the demand for premium and specialized chocolate products, are also driving market expansion. The compound annual growth rate (CAGR) for the chocolate market during the historical period (2019-2024) was estimated at xx%, and is projected to reach xx% during the forecast period (2025-2033). Market penetration in key regions like North America and Europe remains high, while significant growth opportunities lie in emerging markets in Asia and Africa.
Technological disruptions, such as advancements in production processes and online retail channels, are revolutionizing the chocolate industry. E-commerce platforms offer new avenues for product distribution and marketing, enabling manufacturers to reach broader customer bases. The adoption of blockchain technology for traceability and sustainability further showcases the industry's commitment to innovation.
Consumer preferences are also shifting. There's a rise in demand for premium, organic, and fair-trade chocolate, alongside personalized and customized experiences. Health-conscious consumers seek products with lower sugar content and added nutrients.
Competitive dynamics are intense, with established players investing heavily in brand building, product innovation, and expanding their global presence. Smaller players are focusing on niche markets and specializing in unique chocolate types and flavor profiles to carve their space in this dynamic market.
Dominant Markets & Segments in Chocolate Market
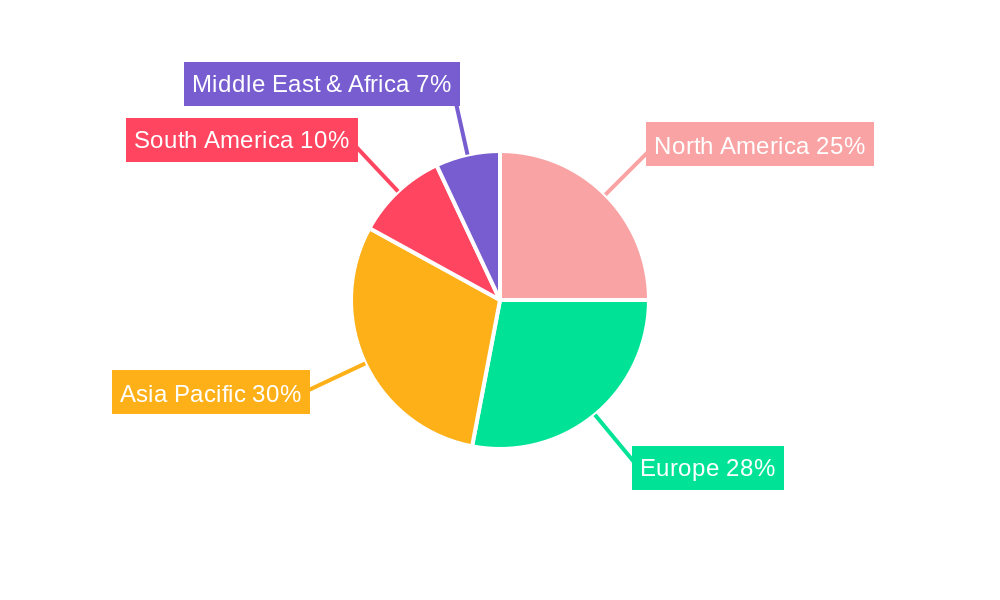
Leading Regions and Countries: North America and Europe have historically been the largest chocolate consumption markets, driven by high per capita incomes and established chocolate-consuming cultures. However, Asia-Pacific is experiencing rapid growth, fueled by rising disposable incomes and changing consumer preferences.
- Key Drivers in Asia-Pacific: Rapid urbanization, increasing disposable incomes, and a growing middle class are driving significant demand for chocolate in this region. Government policies promoting domestic food processing and investment in infrastructure are also boosting market growth.
Dominant Segments:
- Confectionery Variant: Milk chocolate dominates the market globally, although dark chocolate is witnessing substantial growth due to increased health consciousness. White chocolate holds a smaller but stable market share.
- Distribution Channel: Supermarket/hypermarkets remain the dominant distribution channel, although online retail is gaining traction, especially in developed economies. Convenience stores also play a significant role, particularly for impulse purchases. The "Others" category encompasses various channels, including direct sales, specialty stores, and food service providers.
Chocolate Market Product Developments
Recent product innovations focus on health-conscious options, premiumization, and unique flavors. Manufacturers are introducing dark chocolate with higher cocoa content, sugar-free or reduced-sugar options, and products incorporating functional ingredients. Novel flavors and creative packaging further enhance consumer appeal, reflecting technological trends towards personalization and customization. These products are designed to cater to a broader range of consumer tastes and dietary preferences, expanding the market’s reach and addressing evolving health consciousness.
Report Scope & Segmentation Analysis
This report segments the chocolate market across various parameters:
Confectionery Variant: Dark Chocolate, Milk Chocolate, White Chocolate. Each variant's growth is projected based on changing consumer preferences and health trends.
Distribution Channel: Convenience Stores, Online Retail Stores, Supermarket/Hypermarket, Others. Growth projections account for changing consumer shopping habits and the increasing role of e-commerce. Competitive dynamics within each channel are also analyzed.
Market sizes and growth projections for each segment are detailed within the full report, considering both historical data and future predictions. The report also analyses competitive dynamics and market share within each segment.
Key Drivers of Chocolate Market Growth
Several factors drive the chocolate market's growth. Rising disposable incomes globally lead to increased discretionary spending on treats, including chocolate. The growing popularity of dark chocolate, associated with its perceived health benefits, fuels market expansion. Furthermore, product innovation, new flavors, and convenient packaging formats attract consumers and contribute to market growth. Technological advancements in production processes and supply chains also contribute to efficiency and sustainability, boosting market growth.
Challenges in the Chocolate Market Sector
The chocolate market faces several challenges, including fluctuations in cocoa bean prices, affecting production costs and profitability. Ethical sourcing and sustainability concerns pose a significant challenge, demanding rigorous supply chain management and transparency. Stringent food safety regulations in various regions necessitate compliance, and intense competition demands continuous innovation and marketing strategies. These factors can significantly impact manufacturers' profitability and market share.
Emerging Opportunities in Chocolate Market
Emerging markets in Asia and Africa offer significant growth opportunities due to increasing disposable incomes and changing consumer preferences. The health and wellness trend offers scope for functional chocolates with added nutrients and reduced sugar. Sustainable and ethically sourced cocoa products command premium prices, presenting opportunities for manufacturers focused on these aspects. Technological advancements, such as personalized product offerings and sophisticated packaging, create new avenues for market penetration.
Leading Players in the Chocolate Market Market
- Cargill Incorporated
- Nestlé SA
- Chocoladefabriken Lindt & Sprüngli AG
- Morinaga & Co Ltd
- August Storck KG
- Ferrero International SA
- Mars Incorporated
- Yıldız Holding A.Ş.
- Arcor S.A.I.C.
- Lotte Corporation
- Barry Callebaut AG
- Mondelēz International Inc
- Meiji Holdings Company Ltd
- ITC Limited
- The Hershey Company
Key Developments in Chocolate Market Industry
- August 2023: Lotte Corporation partnered with DLT Labs to leverage blockchain technology for cacao bean traceability and child labor monitoring, enhancing ethical sourcing and sustainability.
- July 2023: Ferrero's Ferrara Candy Co. acquired Brazilian snacks company Dori Alimentos, expanding its confectionery portfolio and market reach in South America.
- February 2023: The Hershey Company launched limited-edition chocolate bars celebrating International Women’s Day, showcasing marketing initiatives and brand engagement.
Strategic Outlook for Chocolate Market Market
The chocolate market is poised for continued growth, driven by rising consumer demand, particularly in emerging markets. Innovation in product development, focusing on health and sustainability, will play a crucial role in shaping future market trends. Companies adopting agile strategies and adapting to changing consumer preferences and technological advancements will be well-positioned to succeed in this competitive landscape. The integration of technology and sustainable practices will be instrumental in driving long-term growth and shaping the future of the chocolate industry.
Chocolate Market Segmentation
-
1. Confectionery Variant
- 1.1. Dark Chocolate
- 1.2. Milk and White Chocolate
-
2. Distribution Channel
- 2.1. Convenience Store
- 2.2. Online Retail Store
- 2.3. Supermarket/Hypermarket
- 2.4. Others
Chocolate Market Segmentation By Geography
-
1. North America
- 1.1. United States
- 1.2. Canada
- 1.3. Mexico
-
2. South America
- 2.1. Brazil
- 2.2. Argentina
- 2.3. Rest of South America
-
3. Europe
- 3.1. United Kingdom
- 3.2. Germany
- 3.3. France
- 3.4. Italy
- 3.5. Spain
- 3.6. Russia
- 3.7. Benelux
- 3.8. Nordics
- 3.9. Rest of Europe
-
4. Middle East & Africa
- 4.1. Turkey
- 4.2. Israel
- 4.3. GCC
- 4.4. North Africa
- 4.5. South Africa
- 4.6. Rest of Middle East & Africa
-
5. Asia Pacific
- 5.1. China
- 5.2. India
- 5.3. Japan
- 5.4. South Korea
- 5.5. ASEAN
- 5.6. Oceania
- 5.7. Rest of Asia Pacific
Chocolate Market REPORT HIGHLIGHTS
| Aspects | Details |
|---|---|
| Study Period | 2019-2033 |
| Base Year | 2024 |
| Estimated Year | 2025 |
| Forecast Period | 2025-2033 |
| Historical Period | 2019-2024 |
| Growth Rate | CAGR of 5.45% from 2019-2033 |
| Segmentation |
|
Table of Contents
- 1. Introduction
- 1.1. Research Scope
- 1.2. Market Segmentation
- 1.3. Research Methodology
- 1.4. Definitions and Assumptions
- 2. Executive Summary
- 2.1. Introduction
- 3. Market Dynamics
- 3.1. Introduction
- 3.2. Market Drivers
- 3.2.1. Increasing demand for meat alternatives
- 3.3. Market Restrains
- 3.3.1. Presence of numerous alternatives in the plant proteins
- 3.4. Market Trends
- 3.4.1. OTHER KEY INDUSTRY TRENDS COVERED IN THE REPORT
- 4. Market Factor Analysis
- 4.1. Porters Five Forces
- 4.2. Supply/Value Chain
- 4.3. PESTEL analysis
- 4.4. Market Entropy
- 4.5. Patent/Trademark Analysis
- 5. Global Chocolate Market Analysis, Insights and Forecast, 2019-2031
- 5.1. Market Analysis, Insights and Forecast - by Confectionery Variant
- 5.1.1. Dark Chocolate
- 5.1.2. Milk and White Chocolate
- 5.2. Market Analysis, Insights and Forecast - by Distribution Channel
- 5.2.1. Convenience Store
- 5.2.2. Online Retail Store
- 5.2.3. Supermarket/Hypermarket
- 5.2.4. Others
- 5.3. Market Analysis, Insights and Forecast - by Region
- 5.3.1. North America
- 5.3.2. South America
- 5.3.3. Europe
- 5.3.4. Middle East & Africa
- 5.3.5. Asia Pacific
- 5.1. Market Analysis, Insights and Forecast - by Confectionery Variant
- 6. North America Chocolate Market Analysis, Insights and Forecast, 2019-2031
- 6.1. Market Analysis, Insights and Forecast - by Confectionery Variant
- 6.1.1. Dark Chocolate
- 6.1.2. Milk and White Chocolate
- 6.2. Market Analysis, Insights and Forecast - by Distribution Channel
- 6.2.1. Convenience Store
- 6.2.2. Online Retail Store
- 6.2.3. Supermarket/Hypermarket
- 6.2.4. Others
- 6.1. Market Analysis, Insights and Forecast - by Confectionery Variant
- 7. South America Chocolate Market Analysis, Insights and Forecast, 2019-2031
- 7.1. Market Analysis, Insights and Forecast - by Confectionery Variant
- 7.1.1. Dark Chocolate
- 7.1.2. Milk and White Chocolate
- 7.2. Market Analysis, Insights and Forecast - by Distribution Channel
- 7.2.1. Convenience Store
- 7.2.2. Online Retail Store
- 7.2.3. Supermarket/Hypermarket
- 7.2.4. Others
- 7.1. Market Analysis, Insights and Forecast - by Confectionery Variant
- 8. Europe Chocolate Market Analysis, Insights and Forecast, 2019-2031
- 8.1. Market Analysis, Insights and Forecast - by Confectionery Variant
- 8.1.1. Dark Chocolate
- 8.1.2. Milk and White Chocolate
- 8.2. Market Analysis, Insights and Forecast - by Distribution Channel
- 8.2.1. Convenience Store
- 8.2.2. Online Retail Store
- 8.2.3. Supermarket/Hypermarket
- 8.2.4. Others
- 8.1. Market Analysis, Insights and Forecast - by Confectionery Variant
- 9. Middle East & Africa Chocolate Market Analysis, Insights and Forecast, 2019-2031
- 9.1. Market Analysis, Insights and Forecast - by Confectionery Variant
- 9.1.1. Dark Chocolate
- 9.1.2. Milk and White Chocolate
- 9.2. Market Analysis, Insights and Forecast - by Distribution Channel
- 9.2.1. Convenience Store
- 9.2.2. Online Retail Store
- 9.2.3. Supermarket/Hypermarket
- 9.2.4. Others
- 9.1. Market Analysis, Insights and Forecast - by Confectionery Variant
- 10. Asia Pacific Chocolate Market Analysis, Insights and Forecast, 2019-2031
- 10.1. Market Analysis, Insights and Forecast - by Confectionery Variant
- 10.1.1. Dark Chocolate
- 10.1.2. Milk and White Chocolate
- 10.2. Market Analysis, Insights and Forecast - by Distribution Channel
- 10.2.1. Convenience Store
- 10.2.2. Online Retail Store
- 10.2.3. Supermarket/Hypermarket
- 10.2.4. Others
- 10.1. Market Analysis, Insights and Forecast - by Confectionery Variant
- 11. Middle East Chocolate Market Analysis, Insights and Forecast, 2019-2031
- 11.1. Market Analysis, Insights and Forecast - By Country/Sub-region
- 11.1.1 Middle East
- 11.1.2 Africa
- 12. North America Chocolate Market Analysis, Insights and Forecast, 2019-2031
- 12.1. Market Analysis, Insights and Forecast - By Country/Sub-region
- 12.1.1 United States
- 12.1.2 Canada
- 12.1.3 Mexico
- 12.1.4 Rest of North America
- 13. Asia Pacific Chocolate Market Analysis, Insights and Forecast, 2019-2031
- 13.1. Market Analysis, Insights and Forecast - By Country/Sub-region
- 13.1.1 China
- 13.1.2 Japan
- 13.1.3 India
- 13.1.4 South Korea
- 13.1.5 Taiwan
- 13.1.6 Australia
- 13.1.7 Rest of Asia-Pacific
- 14. Europe Chocolate Market Analysis, Insights and Forecast, 2019-2031
- 14.1. Market Analysis, Insights and Forecast - By Country/Sub-region
- 14.1.1. Germany
- 15. South America Chocolate Market Analysis, Insights and Forecast, 2019-2031
- 15.1. Market Analysis, Insights and Forecast - By Country/Sub-region
- 15.1.1 Brazil
- 15.1.2 Argentina
- 15.1.3 Rest of South America
- 16. Competitive Analysis
- 16.1. Global Market Share Analysis 2024
- 16.2. Company Profiles
- 16.2.1 Cargill Incorporated
- 16.2.1.1. Overview
- 16.2.1.2. Products
- 16.2.1.3. SWOT Analysis
- 16.2.1.4. Recent Developments
- 16.2.1.5. Financials (Based on Availability)
- 16.2.2 Nestlé SA
- 16.2.2.1. Overview
- 16.2.2.2. Products
- 16.2.2.3. SWOT Analysis
- 16.2.2.4. Recent Developments
- 16.2.2.5. Financials (Based on Availability)
- 16.2.3 Chocoladefabriken Lindt & Sprüngli AG
- 16.2.3.1. Overview
- 16.2.3.2. Products
- 16.2.3.3. SWOT Analysis
- 16.2.3.4. Recent Developments
- 16.2.3.5. Financials (Based on Availability)
- 16.2.4 Morinaga & Co Ltd
- 16.2.4.1. Overview
- 16.2.4.2. Products
- 16.2.4.3. SWOT Analysis
- 16.2.4.4. Recent Developments
- 16.2.4.5. Financials (Based on Availability)
- 16.2.5 August Storck KG
- 16.2.5.1. Overview
- 16.2.5.2. Products
- 16.2.5.3. SWOT Analysis
- 16.2.5.4. Recent Developments
- 16.2.5.5. Financials (Based on Availability)
- 16.2.6 Ferrero International SA
- 16.2.6.1. Overview
- 16.2.6.2. Products
- 16.2.6.3. SWOT Analysis
- 16.2.6.4. Recent Developments
- 16.2.6.5. Financials (Based on Availability)
- 16.2.7 Mars Incorporated
- 16.2.7.1. Overview
- 16.2.7.2. Products
- 16.2.7.3. SWOT Analysis
- 16.2.7.4. Recent Developments
- 16.2.7.5. Financials (Based on Availability)
- 16.2.8 Yıldız Holding A
- 16.2.8.1. Overview
- 16.2.8.2. Products
- 16.2.8.3. SWOT Analysis
- 16.2.8.4. Recent Developments
- 16.2.8.5. Financials (Based on Availability)
- 16.2.9 Arcor S A I C
- 16.2.9.1. Overview
- 16.2.9.2. Products
- 16.2.9.3. SWOT Analysis
- 16.2.9.4. Recent Developments
- 16.2.9.5. Financials (Based on Availability)
- 16.2.10 Lotte Corporation
- 16.2.10.1. Overview
- 16.2.10.2. Products
- 16.2.10.3. SWOT Analysis
- 16.2.10.4. Recent Developments
- 16.2.10.5. Financials (Based on Availability)
- 16.2.11 Barry callebaut AG
- 16.2.11.1. Overview
- 16.2.11.2. Products
- 16.2.11.3. SWOT Analysis
- 16.2.11.4. Recent Developments
- 16.2.11.5. Financials (Based on Availability)
- 16.2.12 Mondelēz International Inc
- 16.2.12.1. Overview
- 16.2.12.2. Products
- 16.2.12.3. SWOT Analysis
- 16.2.12.4. Recent Developments
- 16.2.12.5. Financials (Based on Availability)
- 16.2.13 Meiji Holdings Company Ltd
- 16.2.13.1. Overview
- 16.2.13.2. Products
- 16.2.13.3. SWOT Analysis
- 16.2.13.4. Recent Developments
- 16.2.13.5. Financials (Based on Availability)
- 16.2.14 ITC Limited
- 16.2.14.1. Overview
- 16.2.14.2. Products
- 16.2.14.3. SWOT Analysis
- 16.2.14.4. Recent Developments
- 16.2.14.5. Financials (Based on Availability)
- 16.2.15 The Hershey Company
- 16.2.15.1. Overview
- 16.2.15.2. Products
- 16.2.15.3. SWOT Analysis
- 16.2.15.4. Recent Developments
- 16.2.15.5. Financials (Based on Availability)
- 16.2.1 Cargill Incorporated
List of Figures
- Figure 1: Global Chocolate Market Revenue Breakdown (Million, %) by Region 2024 & 2032
- Figure 2: Global Chocolate Market Volume Breakdown (K Tons, %) by Region 2024 & 2032
- Figure 3: Middle East Chocolate Market Revenue (Million), by Country 2024 & 2032
- Figure 4: Middle East Chocolate Market Volume (K Tons), by Country 2024 & 2032
- Figure 5: Middle East Chocolate Market Revenue Share (%), by Country 2024 & 2032
- Figure 6: Middle East Chocolate Market Volume Share (%), by Country 2024 & 2032
- Figure 7: North America Chocolate Market Revenue (Million), by Country 2024 & 2032
- Figure 8: North America Chocolate Market Volume (K Tons), by Country 2024 & 2032
- Figure 9: North America Chocolate Market Revenue Share (%), by Country 2024 & 2032
- Figure 10: North America Chocolate Market Volume Share (%), by Country 2024 & 2032
- Figure 11: Asia Pacific Chocolate Market Revenue (Million), by Country 2024 & 2032
- Figure 12: Asia Pacific Chocolate Market Volume (K Tons), by Country 2024 & 2032
- Figure 13: Asia Pacific Chocolate Market Revenue Share (%), by Country 2024 & 2032
- Figure 14: Asia Pacific Chocolate Market Volume Share (%), by Country 2024 & 2032
- Figure 15: Europe Chocolate Market Revenue (Million), by Country 2024 & 2032
- Figure 16: Europe Chocolate Market Volume (K Tons), by Country 2024 & 2032
- Figure 17: Europe Chocolate Market Revenue Share (%), by Country 2024 & 2032
- Figure 18: Europe Chocolate Market Volume Share (%), by Country 2024 & 2032
- Figure 19: South America Chocolate Market Revenue (Million), by Country 2024 & 2032
- Figure 20: South America Chocolate Market Volume (K Tons), by Country 2024 & 2032
- Figure 21: South America Chocolate Market Revenue Share (%), by Country 2024 & 2032
- Figure 22: South America Chocolate Market Volume Share (%), by Country 2024 & 2032
- Figure 23: North America Chocolate Market Revenue (Million), by Confectionery Variant 2024 & 2032
- Figure 24: North America Chocolate Market Volume (K Tons), by Confectionery Variant 2024 & 2032
- Figure 25: North America Chocolate Market Revenue Share (%), by Confectionery Variant 2024 & 2032
- Figure 26: North America Chocolate Market Volume Share (%), by Confectionery Variant 2024 & 2032
- Figure 27: North America Chocolate Market Revenue (Million), by Distribution Channel 2024 & 2032
- Figure 28: North America Chocolate Market Volume (K Tons), by Distribution Channel 2024 & 2032
- Figure 29: North America Chocolate Market Revenue Share (%), by Distribution Channel 2024 & 2032
- Figure 30: North America Chocolate Market Volume Share (%), by Distribution Channel 2024 & 2032
- Figure 31: North America Chocolate Market Revenue (Million), by Country 2024 & 2032
- Figure 32: North America Chocolate Market Volume (K Tons), by Country 2024 & 2032
- Figure 33: North America Chocolate Market Revenue Share (%), by Country 2024 & 2032
- Figure 34: North America Chocolate Market Volume Share (%), by Country 2024 & 2032
- Figure 35: South America Chocolate Market Revenue (Million), by Confectionery Variant 2024 & 2032
- Figure 36: South America Chocolate Market Volume (K Tons), by Confectionery Variant 2024 & 2032
- Figure 37: South America Chocolate Market Revenue Share (%), by Confectionery Variant 2024 & 2032
- Figure 38: South America Chocolate Market Volume Share (%), by Confectionery Variant 2024 & 2032
- Figure 39: South America Chocolate Market Revenue (Million), by Distribution Channel 2024 & 2032
- Figure 40: South America Chocolate Market Volume (K Tons), by Distribution Channel 2024 & 2032
- Figure 41: South America Chocolate Market Revenue Share (%), by Distribution Channel 2024 & 2032
- Figure 42: South America Chocolate Market Volume Share (%), by Distribution Channel 2024 & 2032
- Figure 43: South America Chocolate Market Revenue (Million), by Country 2024 & 2032
- Figure 44: South America Chocolate Market Volume (K Tons), by Country 2024 & 2032
- Figure 45: South America Chocolate Market Revenue Share (%), by Country 2024 & 2032
- Figure 46: South America Chocolate Market Volume Share (%), by Country 2024 & 2032
- Figure 47: Europe Chocolate Market Revenue (Million), by Confectionery Variant 2024 & 2032
- Figure 48: Europe Chocolate Market Volume (K Tons), by Confectionery Variant 2024 & 2032
- Figure 49: Europe Chocolate Market Revenue Share (%), by Confectionery Variant 2024 & 2032
- Figure 50: Europe Chocolate Market Volume Share (%), by Confectionery Variant 2024 & 2032
- Figure 51: Europe Chocolate Market Revenue (Million), by Distribution Channel 2024 & 2032
- Figure 52: Europe Chocolate Market Volume (K Tons), by Distribution Channel 2024 & 2032
- Figure 53: Europe Chocolate Market Revenue Share (%), by Distribution Channel 2024 & 2032
- Figure 54: Europe Chocolate Market Volume Share (%), by Distribution Channel 2024 & 2032
- Figure 55: Europe Chocolate Market Revenue (Million), by Country 2024 & 2032
- Figure 56: Europe Chocolate Market Volume (K Tons), by Country 2024 & 2032
- Figure 57: Europe Chocolate Market Revenue Share (%), by Country 2024 & 2032
- Figure 58: Europe Chocolate Market Volume Share (%), by Country 2024 & 2032
- Figure 59: Middle East & Africa Chocolate Market Revenue (Million), by Confectionery Variant 2024 & 2032
- Figure 60: Middle East & Africa Chocolate Market Volume (K Tons), by Confectionery Variant 2024 & 2032
- Figure 61: Middle East & Africa Chocolate Market Revenue Share (%), by Confectionery Variant 2024 & 2032
- Figure 62: Middle East & Africa Chocolate Market Volume Share (%), by Confectionery Variant 2024 & 2032
- Figure 63: Middle East & Africa Chocolate Market Revenue (Million), by Distribution Channel 2024 & 2032
- Figure 64: Middle East & Africa Chocolate Market Volume (K Tons), by Distribution Channel 2024 & 2032
- Figure 65: Middle East & Africa Chocolate Market Revenue Share (%), by Distribution Channel 2024 & 2032
- Figure 66: Middle East & Africa Chocolate Market Volume Share (%), by Distribution Channel 2024 & 2032
- Figure 67: Middle East & Africa Chocolate Market Revenue (Million), by Country 2024 & 2032
- Figure 68: Middle East & Africa Chocolate Market Volume (K Tons), by Country 2024 & 2032
- Figure 69: Middle East & Africa Chocolate Market Revenue Share (%), by Country 2024 & 2032
- Figure 70: Middle East & Africa Chocolate Market Volume Share (%), by Country 2024 & 2032
- Figure 71: Asia Pacific Chocolate Market Revenue (Million), by Confectionery Variant 2024 & 2032
- Figure 72: Asia Pacific Chocolate Market Volume (K Tons), by Confectionery Variant 2024 & 2032
- Figure 73: Asia Pacific Chocolate Market Revenue Share (%), by Confectionery Variant 2024 & 2032
- Figure 74: Asia Pacific Chocolate Market Volume Share (%), by Confectionery Variant 2024 & 2032
- Figure 75: Asia Pacific Chocolate Market Revenue (Million), by Distribution Channel 2024 & 2032
- Figure 76: Asia Pacific Chocolate Market Volume (K Tons), by Distribution Channel 2024 & 2032
- Figure 77: Asia Pacific Chocolate Market Revenue Share (%), by Distribution Channel 2024 & 2032
- Figure 78: Asia Pacific Chocolate Market Volume Share (%), by Distribution Channel 2024 & 2032
- Figure 79: Asia Pacific Chocolate Market Revenue (Million), by Country 2024 & 2032
- Figure 80: Asia Pacific Chocolate Market Volume (K Tons), by Country 2024 & 2032
- Figure 81: Asia Pacific Chocolate Market Revenue Share (%), by Country 2024 & 2032
- Figure 82: Asia Pacific Chocolate Market Volume Share (%), by Country 2024 & 2032
List of Tables
- Table 1: Global Chocolate Market Revenue Million Forecast, by Region 2019 & 2032
- Table 2: Global Chocolate Market Volume K Tons Forecast, by Region 2019 & 2032
- Table 3: Global Chocolate Market Revenue Million Forecast, by Confectionery Variant 2019 & 2032
- Table 4: Global Chocolate Market Volume K Tons Forecast, by Confectionery Variant 2019 & 2032
- Table 5: Global Chocolate Market Revenue Million Forecast, by Distribution Channel 2019 & 2032
- Table 6: Global Chocolate Market Volume K Tons Forecast, by Distribution Channel 2019 & 2032
- Table 7: Global Chocolate Market Revenue Million Forecast, by Region 2019 & 2032
- Table 8: Global Chocolate Market Volume K Tons Forecast, by Region 2019 & 2032
- Table 9: Global Chocolate Market Revenue Million Forecast, by Country 2019 & 2032
- Table 10: Global Chocolate Market Volume K Tons Forecast, by Country 2019 & 2032
- Table 11: Middle East Chocolate Market Revenue (Million) Forecast, by Application 2019 & 2032
- Table 12: Middle East Chocolate Market Volume (K Tons) Forecast, by Application 2019 & 2032
- Table 13: Africa Chocolate Market Revenue (Million) Forecast, by Application 2019 & 2032
- Table 14: Africa Chocolate Market Volume (K Tons) Forecast, by Application 2019 & 2032
- Table 15: Global Chocolate Market Revenue Million Forecast, by Country 2019 & 2032
- Table 16: Global Chocolate Market Volume K Tons Forecast, by Country 2019 & 2032
- Table 17: United States Chocolate Market Revenue (Million) Forecast, by Application 2019 & 2032
- Table 18: United States Chocolate Market Volume (K Tons) Forecast, by Application 2019 & 2032
- Table 19: Canada Chocolate Market Revenue (Million) Forecast, by Application 2019 & 2032
- Table 20: Canada Chocolate Market Volume (K Tons) Forecast, by Application 2019 & 2032
- Table 21: Mexico Chocolate Market Revenue (Million) Forecast, by Application 2019 & 2032
- Table 22: Mexico Chocolate Market Volume (K Tons) Forecast, by Application 2019 & 2032
- Table 23: Rest of North America Chocolate Market Revenue (Million) Forecast, by Application 2019 & 2032
- Table 24: Rest of North America Chocolate Market Volume (K Tons) Forecast, by Application 2019 & 2032
- Table 25: Global Chocolate Market Revenue Million Forecast, by Country 2019 & 2032
- Table 26: Global Chocolate Market Volume K Tons Forecast, by Country 2019 & 2032
- Table 27: China Chocolate Market Revenue (Million) Forecast, by Application 2019 & 2032
- Table 28: China Chocolate Market Volume (K Tons) Forecast, by Application 2019 & 2032
- Table 29: Japan Chocolate Market Revenue (Million) Forecast, by Application 2019 & 2032
- Table 30: Japan Chocolate Market Volume (K Tons) Forecast, by Application 2019 & 2032
- Table 31: India Chocolate Market Revenue (Million) Forecast, by Application 2019 & 2032
- Table 32: India Chocolate Market Volume (K Tons) Forecast, by Application 2019 & 2032
- Table 33: South Korea Chocolate Market Revenue (Million) Forecast, by Application 2019 & 2032
- Table 34: South Korea Chocolate Market Volume (K Tons) Forecast, by Application 2019 & 2032
- Table 35: Taiwan Chocolate Market Revenue (Million) Forecast, by Application 2019 & 2032
- Table 36: Taiwan Chocolate Market Volume (K Tons) Forecast, by Application 2019 & 2032
- Table 37: Australia Chocolate Market Revenue (Million) Forecast, by Application 2019 & 2032
- Table 38: Australia Chocolate Market Volume (K Tons) Forecast, by Application 2019 & 2032
- Table 39: Rest of Asia-Pacific Chocolate Market Revenue (Million) Forecast, by Application 2019 & 2032
- Table 40: Rest of Asia-Pacific Chocolate Market Volume (K Tons) Forecast, by Application 2019 & 2032
- Table 41: Global Chocolate Market Revenue Million Forecast, by Country 2019 & 2032
- Table 42: Global Chocolate Market Volume K Tons Forecast, by Country 2019 & 2032
- Table 43: Germany Chocolate Market Revenue (Million) Forecast, by Application 2019 & 2032
- Table 44: Germany Chocolate Market Volume (K Tons) Forecast, by Application 2019 & 2032
- Table 45: Global Chocolate Market Revenue Million Forecast, by Country 2019 & 2032
- Table 46: Global Chocolate Market Volume K Tons Forecast, by Country 2019 & 2032
- Table 47: Brazil Chocolate Market Revenue (Million) Forecast, by Application 2019 & 2032
- Table 48: Brazil Chocolate Market Volume (K Tons) Forecast, by Application 2019 & 2032
- Table 49: Argentina Chocolate Market Revenue (Million) Forecast, by Application 2019 & 2032
- Table 50: Argentina Chocolate Market Volume (K Tons) Forecast, by Application 2019 & 2032
- Table 51: Rest of South America Chocolate Market Revenue (Million) Forecast, by Application 2019 & 2032
- Table 52: Rest of South America Chocolate Market Volume (K Tons) Forecast, by Application 2019 & 2032
- Table 53: Global Chocolate Market Revenue Million Forecast, by Confectionery Variant 2019 & 2032
- Table 54: Global Chocolate Market Volume K Tons Forecast, by Confectionery Variant 2019 & 2032
- Table 55: Global Chocolate Market Revenue Million Forecast, by Distribution Channel 2019 & 2032
- Table 56: Global Chocolate Market Volume K Tons Forecast, by Distribution Channel 2019 & 2032
- Table 57: Global Chocolate Market Revenue Million Forecast, by Country 2019 & 2032
- Table 58: Global Chocolate Market Volume K Tons Forecast, by Country 2019 & 2032
- Table 59: United States Chocolate Market Revenue (Million) Forecast, by Application 2019 & 2032
- Table 60: United States Chocolate Market Volume (K Tons) Forecast, by Application 2019 & 2032
- Table 61: Canada Chocolate Market Revenue (Million) Forecast, by Application 2019 & 2032
- Table 62: Canada Chocolate Market Volume (K Tons) Forecast, by Application 2019 & 2032
- Table 63: Mexico Chocolate Market Revenue (Million) Forecast, by Application 2019 & 2032
- Table 64: Mexico Chocolate Market Volume (K Tons) Forecast, by Application 2019 & 2032
- Table 65: Global Chocolate Market Revenue Million Forecast, by Confectionery Variant 2019 & 2032
- Table 66: Global Chocolate Market Volume K Tons Forecast, by Confectionery Variant 2019 & 2032
- Table 67: Global Chocolate Market Revenue Million Forecast, by Distribution Channel 2019 & 2032
- Table 68: Global Chocolate Market Volume K Tons Forecast, by Distribution Channel 2019 & 2032
- Table 69: Global Chocolate Market Revenue Million Forecast, by Country 2019 & 2032
- Table 70: Global Chocolate Market Volume K Tons Forecast, by Country 2019 & 2032
- Table 71: Brazil Chocolate Market Revenue (Million) Forecast, by Application 2019 & 2032
- Table 72: Brazil Chocolate Market Volume (K Tons) Forecast, by Application 2019 & 2032
- Table 73: Argentina Chocolate Market Revenue (Million) Forecast, by Application 2019 & 2032
- Table 74: Argentina Chocolate Market Volume (K Tons) Forecast, by Application 2019 & 2032
- Table 75: Rest of South America Chocolate Market Revenue (Million) Forecast, by Application 2019 & 2032
- Table 76: Rest of South America Chocolate Market Volume (K Tons) Forecast, by Application 2019 & 2032
- Table 77: Global Chocolate Market Revenue Million Forecast, by Confectionery Variant 2019 & 2032
- Table 78: Global Chocolate Market Volume K Tons Forecast, by Confectionery Variant 2019 & 2032
- Table 79: Global Chocolate Market Revenue Million Forecast, by Distribution Channel 2019 & 2032
- Table 80: Global Chocolate Market Volume K Tons Forecast, by Distribution Channel 2019 & 2032
- Table 81: Global Chocolate Market Revenue Million Forecast, by Country 2019 & 2032
- Table 82: Global Chocolate Market Volume K Tons Forecast, by Country 2019 & 2032
- Table 83: United Kingdom Chocolate Market Revenue (Million) Forecast, by Application 2019 & 2032
- Table 84: United Kingdom Chocolate Market Volume (K Tons) Forecast, by Application 2019 & 2032
- Table 85: Germany Chocolate Market Revenue (Million) Forecast, by Application 2019 & 2032
- Table 86: Germany Chocolate Market Volume (K Tons) Forecast, by Application 2019 & 2032
- Table 87: France Chocolate Market Revenue (Million) Forecast, by Application 2019 & 2032
- Table 88: France Chocolate Market Volume (K Tons) Forecast, by Application 2019 & 2032
- Table 89: Italy Chocolate Market Revenue (Million) Forecast, by Application 2019 & 2032
- Table 90: Italy Chocolate Market Volume (K Tons) Forecast, by Application 2019 & 2032
- Table 91: Spain Chocolate Market Revenue (Million) Forecast, by Application 2019 & 2032
- Table 92: Spain Chocolate Market Volume (K Tons) Forecast, by Application 2019 & 2032
- Table 93: Russia Chocolate Market Revenue (Million) Forecast, by Application 2019 & 2032
- Table 94: Russia Chocolate Market Volume (K Tons) Forecast, by Application 2019 & 2032
- Table 95: Benelux Chocolate Market Revenue (Million) Forecast, by Application 2019 & 2032
- Table 96: Benelux Chocolate Market Volume (K Tons) Forecast, by Application 2019 & 2032
- Table 97: Nordics Chocolate Market Revenue (Million) Forecast, by Application 2019 & 2032
- Table 98: Nordics Chocolate Market Volume (K Tons) Forecast, by Application 2019 & 2032
- Table 99: Rest of Europe Chocolate Market Revenue (Million) Forecast, by Application 2019 & 2032
- Table 100: Rest of Europe Chocolate Market Volume (K Tons) Forecast, by Application 2019 & 2032
- Table 101: Global Chocolate Market Revenue Million Forecast, by Confectionery Variant 2019 & 2032
- Table 102: Global Chocolate Market Volume K Tons Forecast, by Confectionery Variant 2019 & 2032
- Table 103: Global Chocolate Market Revenue Million Forecast, by Distribution Channel 2019 & 2032
- Table 104: Global Chocolate Market Volume K Tons Forecast, by Distribution Channel 2019 & 2032
- Table 105: Global Chocolate Market Revenue Million Forecast, by Country 2019 & 2032
- Table 106: Global Chocolate Market Volume K Tons Forecast, by Country 2019 & 2032
- Table 107: Turkey Chocolate Market Revenue (Million) Forecast, by Application 2019 & 2032
- Table 108: Turkey Chocolate Market Volume (K Tons) Forecast, by Application 2019 & 2032
- Table 109: Israel Chocolate Market Revenue (Million) Forecast, by Application 2019 & 2032
- Table 110: Israel Chocolate Market Volume (K Tons) Forecast, by Application 2019 & 2032
- Table 111: GCC Chocolate Market Revenue (Million) Forecast, by Application 2019 & 2032
- Table 112: GCC Chocolate Market Volume (K Tons) Forecast, by Application 2019 & 2032
- Table 113: North Africa Chocolate Market Revenue (Million) Forecast, by Application 2019 & 2032
- Table 114: North Africa Chocolate Market Volume (K Tons) Forecast, by Application 2019 & 2032
- Table 115: South Africa Chocolate Market Revenue (Million) Forecast, by Application 2019 & 2032
- Table 116: South Africa Chocolate Market Volume (K Tons) Forecast, by Application 2019 & 2032
- Table 117: Rest of Middle East & Africa Chocolate Market Revenue (Million) Forecast, by Application 2019 & 2032
- Table 118: Rest of Middle East & Africa Chocolate Market Volume (K Tons) Forecast, by Application 2019 & 2032
- Table 119: Global Chocolate Market Revenue Million Forecast, by Confectionery Variant 2019 & 2032
- Table 120: Global Chocolate Market Volume K Tons Forecast, by Confectionery Variant 2019 & 2032
- Table 121: Global Chocolate Market Revenue Million Forecast, by Distribution Channel 2019 & 2032
- Table 122: Global Chocolate Market Volume K Tons Forecast, by Distribution Channel 2019 & 2032
- Table 123: Global Chocolate Market Revenue Million Forecast, by Country 2019 & 2032
- Table 124: Global Chocolate Market Volume K Tons Forecast, by Country 2019 & 2032
- Table 125: China Chocolate Market Revenue (Million) Forecast, by Application 2019 & 2032
- Table 126: China Chocolate Market Volume (K Tons) Forecast, by Application 2019 & 2032
- Table 127: India Chocolate Market Revenue (Million) Forecast, by Application 2019 & 2032
- Table 128: India Chocolate Market Volume (K Tons) Forecast, by Application 2019 & 2032
- Table 129: Japan Chocolate Market Revenue (Million) Forecast, by Application 2019 & 2032
- Table 130: Japan Chocolate Market Volume (K Tons) Forecast, by Application 2019 & 2032
- Table 131: South Korea Chocolate Market Revenue (Million) Forecast, by Application 2019 & 2032
- Table 132: South Korea Chocolate Market Volume (K Tons) Forecast, by Application 2019 & 2032
- Table 133: ASEAN Chocolate Market Revenue (Million) Forecast, by Application 2019 & 2032
- Table 134: ASEAN Chocolate Market Volume (K Tons) Forecast, by Application 2019 & 2032
- Table 135: Oceania Chocolate Market Revenue (Million) Forecast, by Application 2019 & 2032
- Table 136: Oceania Chocolate Market Volume (K Tons) Forecast, by Application 2019 & 2032
- Table 137: Rest of Asia Pacific Chocolate Market Revenue (Million) Forecast, by Application 2019 & 2032
- Table 138: Rest of Asia Pacific Chocolate Market Volume (K Tons) Forecast, by Application 2019 & 2032
Frequently Asked Questions
1. What is the projected Compound Annual Growth Rate (CAGR) of the Chocolate Market?
The projected CAGR is approximately 5.45%.
2. Which companies are prominent players in the Chocolate Market?
Key companies in the market include Cargill Incorporated, Nestlé SA, Chocoladefabriken Lindt & Sprüngli AG, Morinaga & Co Ltd, August Storck KG, Ferrero International SA, Mars Incorporated, Yıldız Holding A, Arcor S A I C, Lotte Corporation, Barry callebaut AG, Mondelēz International Inc, Meiji Holdings Company Ltd, ITC Limited, The Hershey Company.
3. What are the main segments of the Chocolate Market?
The market segments include Confectionery Variant, Distribution Channel.
4. Can you provide details about the market size?
The market size is estimated to be USD 119230 Million as of 2022.
5. What are some drivers contributing to market growth?
Increasing demand for meat alternatives.
6. What are the notable trends driving market growth?
OTHER KEY INDUSTRY TRENDS COVERED IN THE REPORT.
7. Are there any restraints impacting market growth?
Presence of numerous alternatives in the plant proteins.
8. Can you provide examples of recent developments in the market?
August 2023: Lotte Corporation partnered with DLT Labs to promote sustainability and ethical practices in the cacao bean supply chain. Lotte is commencing its pilot project on the traceability of cacao beans from Ghana and child labor monitoring using blockchain technology.July 2023: Ferrero's sister company, Ferrara Candy Co., announced the acquisition of Brazilian snacks company Dori Alimentos, which sells a variety of chocolate and sugar confectionery brands, including Dori, Pettiz, and Jubes.February 2023: The Hershey Company launched limited-edition chocolate bars to honor the celebration of International Women’s Day.
9. What pricing options are available for accessing the report?
Pricing options include single-user, multi-user, and enterprise licenses priced at USD 3800, USD 4500, and USD 5800 respectively.
10. Is the market size provided in terms of value or volume?
The market size is provided in terms of value, measured in Million and volume, measured in K Tons.
11. Are there any specific market keywords associated with the report?
Yes, the market keyword associated with the report is "Chocolate Market," which aids in identifying and referencing the specific market segment covered.
12. How do I determine which pricing option suits my needs best?
The pricing options vary based on user requirements and access needs. Individual users may opt for single-user licenses, while businesses requiring broader access may choose multi-user or enterprise licenses for cost-effective access to the report.
13. Are there any additional resources or data provided in the Chocolate Market report?
While the report offers comprehensive insights, it's advisable to review the specific contents or supplementary materials provided to ascertain if additional resources or data are available.
14. How can I stay updated on further developments or reports in the Chocolate Market?
To stay informed about further developments, trends, and reports in the Chocolate Market, consider subscribing to industry newsletters, following relevant companies and organizations, or regularly checking reputable industry news sources and publications.
Methodology
Step 1 - Identification of Relevant Samples Size from Population Database


Step 2 - Approaches for Defining Global Market Size (Value, Volume* & Price*)

Note*: In applicable scenarios
Step 3 - Data Sources
Primary Research
- Web Analytics
- Survey Reports
- Research Institute
- Latest Research Reports
- Opinion Leaders
Secondary Research
- Annual Reports
- White Paper
- Latest Press Release
- Industry Association
- Paid Database
- Investor Presentations

Step 4 - Data Triangulation
Involves using different sources of information in order to increase the validity of a study
These sources are likely to be stakeholders in a program - participants, other researchers, program staff, other community members, and so on.
Then we put all data in single framework & apply various statistical tools to find out the dynamic on the market.
During the analysis stage, feedback from the stakeholder groups would be compared to determine areas of agreement as well as areas of divergence


