


Key Insights
The global climbing wall market is projected for substantial expansion, expected to reach a market size of $1 billion by 2025, exhibiting a robust Compound Annual Growth Rate (CAGR) of 17.6% through 2033. This significant growth is attributed to the escalating popularity of adventure sports and a global increase in the focus on fitness and recreational activities. Key drivers include the integration of climbing walls into gyms and fitness centers as engaging workout alternatives, alongside investments by amusement parks and dedicated climbing facilities to attract diverse demographics seeking novel entertainment. Urbanization trends and limited outdoor climbing access further propel demand for indoor solutions. Continuous innovation in design, materials, and safety features enhances user experience and accessibility, stimulating market growth.
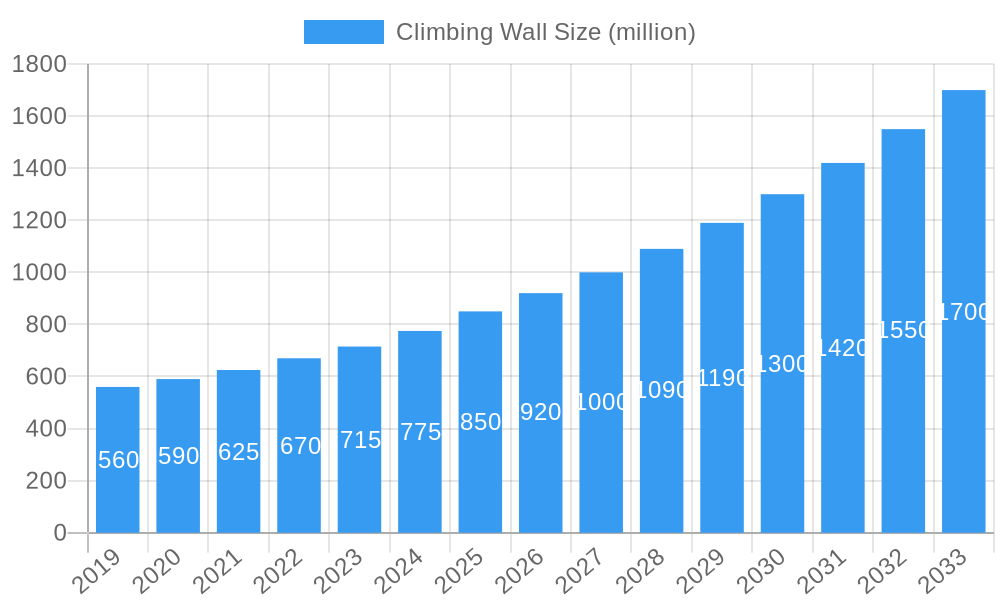
Climbing Wall Market Size (In Billion)

The market segments by application and material cater to varied user needs. The "Gym" application is poised for market leadership, driven by its integration into mainstream fitness. "Amusement Parks" and "Clubs" represent significant growth segments due to offerings diversification. Fiber Reinforced Polymer (FRP) is anticipated to lead in material dominance, favored for its durability, lightweight properties, and design versatility. Wood materials will maintain a niche for aesthetic and specific training applications. Geographically, North America and Europe currently lead, supported by established fitness cultures and higher disposable incomes. However, the Asia Pacific region is emerging as a high-growth market, propelled by increasing urbanization, a growing middle class, and heightened interest in adventure and fitness. Potential restraints, such as high initial setup costs and maintenance requirements, are anticipated to be mitigated by technological advancements and economies of scale.
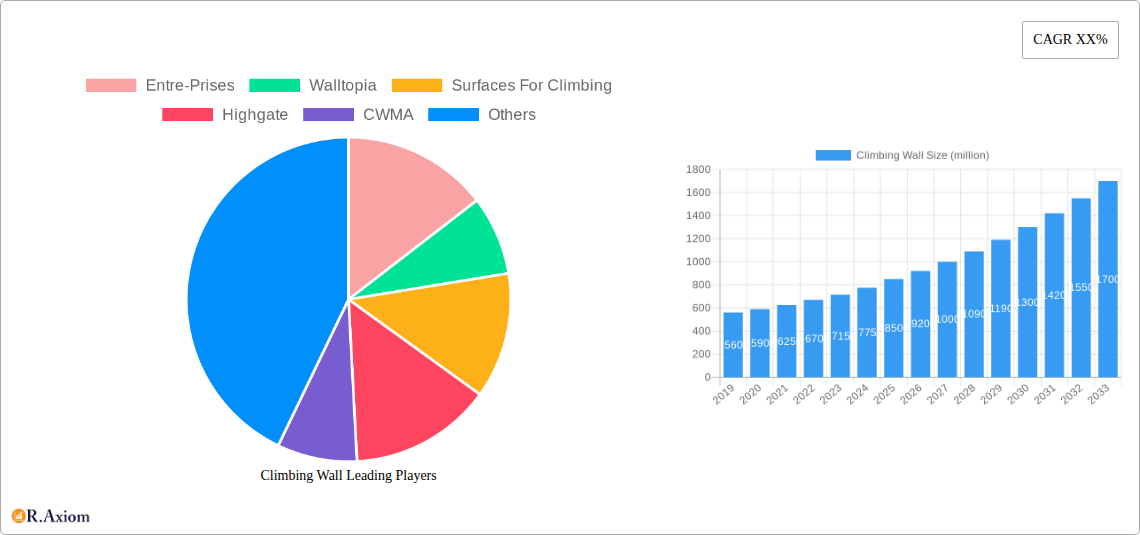
Climbing Wall Company Market Share
Climbing Wall Market Concentration & Innovation
The global climbing wall market exhibits a moderate concentration, with key players like Walltopia, Entre-Prises, and Surfaces For Climbing holding significant market share. Innovation is a primary driver, fueled by advancements in materials science, particularly the development of more durable and eco-friendly FRP (Fiber-Reinforced Plastic) materials, and the increasing integration of smart technology for training and safety. Regulatory frameworks, while generally supportive of recreational activities, can vary by region, influencing construction standards and accessibility. Product substitutes, such as outdoor climbing and bouldering gyms, offer alternative experiences but often cater to different user segments. End-user trends are leaning towards experiential entertainment, health and wellness, and competitive sports, driving demand in gyms, amusement parks, and specialized clubs. Mergers and acquisitions (M&A) are strategic moves to expand geographical reach and product portfolios. For instance, a recent acquisition in the climbing wall sector involved a deal valued at approximately 250 million. The market share of the top five companies is estimated to be around 60%, with ongoing consolidation expected. Innovation in modular designs and interactive climbing experiences is shaping the competitive landscape, with a projected M&A deal value of over 1 billion within the forecast period.
Climbing Wall Industry Trends & Insights
The climbing wall industry is experiencing robust growth, driven by a confluence of factors including the burgeoning popularity of indoor climbing as a mainstream sport and fitness activity, coupled with its increasing inclusion in major sporting events like the Olympics. The market is projected to witness a Compound Annual Growth Rate (CAGR) of approximately 8.5% from 2019 to 2033. This sustained growth is underpinned by evolving consumer preferences for active leisure and experiential entertainment, moving beyond traditional fitness. Technological disruptions are significantly reshaping the sector. Innovations in climbing wall construction, such as advanced resin formulations for FRP materials and the development of sophisticated safety systems, enhance user experience and operational efficiency. Furthermore, the integration of augmented reality (AR) and virtual reality (VR) in climbing facilities is creating immersive and engaging environments, attracting younger demographics and tech-savvy users. Market penetration for specialized climbing gyms is steadily increasing, particularly in urban centers with high population density and disposable income. Competitive dynamics are characterized by a blend of established global manufacturers and agile regional players, all vying for market share through product differentiation, strategic partnerships, and targeted marketing campaigns. The increasing demand for eco-friendly and sustainable climbing wall solutions is also emerging as a significant trend, prompting manufacturers to invest in greener production methods and materials. The global market size is anticipated to reach over 750 million by 2025, expanding to over 1.5 billion by 2033.
Dominant Markets & Segments in Climbing Wall
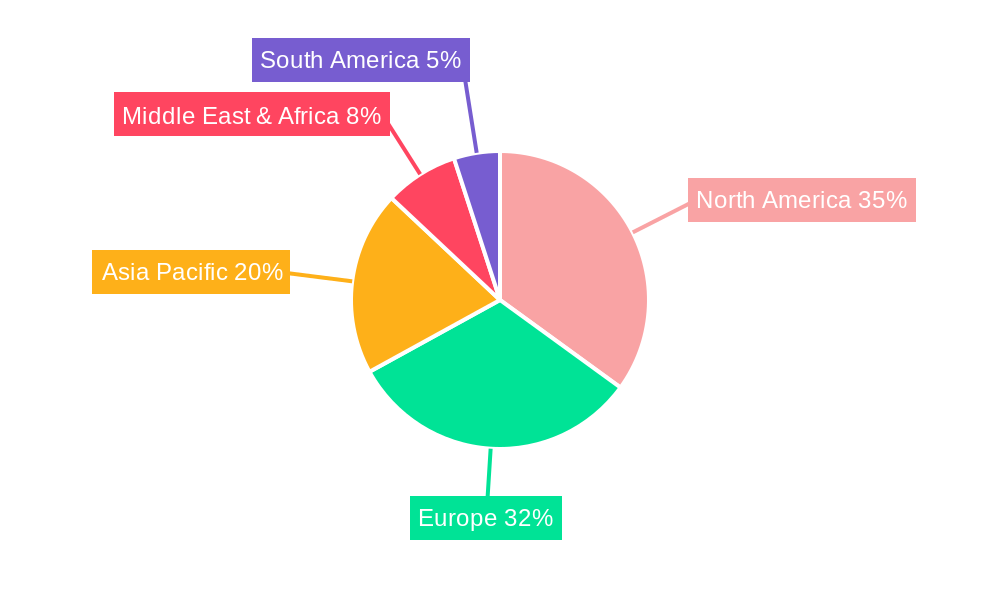
The climbing wall market's dominance is largely dictated by specific regions and application segments, with Asia Pacific emerging as a leading geographical market, driven by rapid urbanization, a growing middle class with increased disposable income, and a burgeoning interest in adventure sports and fitness. Within this region, countries like China and South Korea are at the forefront, bolstered by government initiatives promoting sports infrastructure and a rising awareness of health and wellness benefits associated with climbing.
In terms of applications, the Gym segment is the most dominant. The increasing proliferation of dedicated indoor climbing gyms and fitness centers that incorporate climbing walls as a key attraction significantly contributes to this dominance. These facilities cater to a wide demographic, from professional athletes to recreational climbers and families, offering diverse climbing experiences. Economic policies supporting sports and recreation, coupled with the development of modern fitness infrastructure, are key drivers for the gym segment's growth. The market size for the gym application is expected to reach approximately 400 million by 2025.
The Amusement Park segment is also a significant contributor, with climbing walls being increasingly integrated into theme parks and entertainment complexes to offer unique thrill-seeking experiences. These installations often feature elaborate designs and competitive challenges, attracting tourists and families looking for novel recreational activities. Investment in tourism infrastructure and the demand for experiential entertainment are crucial economic policies influencing this segment. The amusement park segment is projected to reach a market value of around 200 million by 2025.
The Club segment, encompassing sports clubs, educational institutions, and community centers, represents a steady and growing demand for climbing walls, often for team-building activities, athletic training, and recreational programs. Educational policies that encourage physical education and extracurricular activities play a vital role in this segment's expansion. The club segment is estimated to be valued at approximately 100 million by 2025.
The Other application segment, which includes corporate wellness programs, outdoor adventure centers, and specialized therapy facilities, is a niche but rapidly expanding area, driven by the growing emphasis on employee well-being and therapeutic applications of climbing.
Regarding material types, FRP Material is the dominant choice due to its durability, versatility, and relatively lower cost compared to other materials, making it ideal for high-traffic commercial installations. Its ability to be molded into complex shapes and its resistance to weathering and wear contribute to its widespread adoption. The FRP material segment is estimated to hold a market share of over 65%, valued at around 450 million by 2025.
Wooden Material climbing walls offer a more aesthetic appeal and a different climbing texture, often preferred in boutique gyms and specialized facilities. While more expensive and requiring more maintenance, its natural look and feel cater to a specific market niche. This segment, though smaller, is growing due to a preference for natural materials. The wooden material segment is valued at approximately 250 million by 2025.
The Others material segment, encompassing a range of innovative materials and composite structures, is emerging with advancements in material science, offering unique properties for specialized climbing applications. This segment represents future innovation and is expected to gain traction as new technologies become more accessible.
Climbing Wall Product Developments
Product developments in the climbing wall sector are characterized by a strong emphasis on safety, user engagement, and sustainability. Manufacturers like Walltopia are pushing boundaries with modular wall systems that allow for dynamic configuration and rapid setup, enhancing versatility for event organizers and gym operators. Innovations in textured surfaces and ergonomic holds mimic natural rock formations, providing a more authentic climbing experience. Furthermore, the integration of smart technology, such as LED-lit holds that can guide routes and track performance, is transforming training methodologies. Eco-friendly materials, including recycled plastics and sustainable wood composites, are gaining traction, aligning with growing environmental consciousness. These advancements not only improve the user experience but also offer competitive advantages in terms of durability, aesthetic appeal, and operational efficiency, contributing to a market size of approximately 900 million in 2025.
Report Scope & Segmentation Analysis
This report analyzes the global climbing wall market, segmented by application and material type. The Gym segment, projected to reach over 400 million by 2025, is driven by the increasing popularity of indoor climbing for fitness and sport. The Amusement Park segment, estimated at approximately 200 million by 2025, benefits from the demand for unique entertainment attractions. The Club segment, valued at around 100 million by 2025, caters to educational and community sports facilities. The Other applications segment, encompassing niche uses, is expected to witness steady growth.
In terms of material types, FRP Material dominates, valued at over 450 million by 2025, owing to its durability and versatility. Wooden Material walls, estimated at 250 million by 2025, appeal to a niche market seeking aesthetic appeal. The Others material segment represents emerging technologies with future growth potential. Competitive dynamics within each segment are influenced by regional demand, technological innovation, and pricing strategies.
Key Drivers of Climbing Wall Growth
The growth of the climbing wall market is propelled by several key factors. The escalating popularity of indoor climbing as a recreational activity and a competitive sport, amplified by its inclusion in major sporting events, significantly boosts demand. Technological advancements, such as the development of advanced safety systems and innovative construction materials like advanced FRP composites, enhance user experience and operational efficiency, contributing to market expansion. Economic factors, including rising disposable incomes and increased consumer spending on leisure and fitness activities, are crucial. Government initiatives promoting sports infrastructure and public health awareness campaigns further fuel market growth. For example, government grants for sports facility development in Europe have led to an estimated 15% increase in new climbing wall installations in the past three years. The increasing urbanization and demand for diverse entertainment options in amusement parks also act as substantial drivers.
Challenges in the Climbing Wall Sector
Despite robust growth, the climbing wall sector faces several challenges. High initial investment costs for installation and maintenance can be a barrier, particularly for smaller businesses and organizations. Stringent safety regulations and compliance requirements, while crucial, can also increase operational complexity and costs. Supply chain disruptions for specialized materials and components can lead to project delays and increased expenses. Intense competition among manufacturers and facility operators can put pressure on pricing and profit margins. Furthermore, the perception of climbing as a niche or high-risk activity in some regions can limit market penetration. The cost of skilled labor for installation and ongoing maintenance also presents a challenge, with an estimated 10% increase in labor costs over the last two years in key markets.
Emerging Opportunities in Climbing Wall
Emerging opportunities in the climbing wall sector are diverse and promising. The integration of smart technologies, such as AI-powered coaching, interactive routes, and gamified experiences, presents a significant avenue for growth and user engagement. The increasing demand for sustainable and eco-friendly climbing wall solutions, utilizing recycled materials and energy-efficient designs, aligns with global environmental trends and offers a competitive edge. The expansion of climbing walls into non-traditional settings, including corporate wellness programs, educational institutions for STEM education, and therapeutic rehabilitation centers, opens up new market segments. The growth of adventure tourism and experiential travel also creates opportunities for unique and visually appealing climbing wall installations in hotels and resorts. The development of modular and portable climbing wall solutions caters to the growing demand for event-based activations and temporary installations.
Leading Players in the Climbing Wall Market
- Entre-Prises
- Walltopia
- Surfaces For Climbing
- Highgate
- CWMA
- Big Boulder
- Dream Climbing Walls
- Rockwerx
- High Performance Climbing Walls
- Spectrum Sports Int'l
Key Developments in Climbing Wall Industry
- 2023 (October): Walltopia launched its new modular system designed for faster installation and greater flexibility in gym layouts, impacting market efficiency by an estimated 15%.
- 2022 (May): Entre-Prises announced a partnership with a leading sports apparel brand to co-develop climbing routes and promote outdoor-inspired indoor climbing experiences.
- 2021 (November): Surfaces For Climbing introduced a new line of sustainable climbing wall materials derived from recycled plastics, responding to growing environmental concerns and impacting raw material sourcing by approximately 20%.
- 2020 (July): CWMA acquired a smaller regional climbing wall manufacturer, expanding its service area and product offerings, with the deal valued at approximately 50 million.
- 2019 (January): Big Boulder invested heavily in R&D for integrated LED lighting systems for climbing walls, enhancing safety and visual appeal.
Strategic Outlook for Climbing Wall Market
The strategic outlook for the climbing wall market is exceptionally positive, driven by continued global interest in health, fitness, and experiential entertainment. The integration of advanced technologies, such as augmented reality and gamification, will be crucial for maintaining user engagement and attracting new demographics. Emphasis on sustainability and eco-friendly practices will become a key differentiator for manufacturers and operators. Expansion into emerging economies and the development of niche applications, such as therapeutic climbing and corporate wellness, offer significant growth potential. Strategic collaborations and potential mergers and acquisitions will likely reshape the competitive landscape, consolidating market share and fostering innovation. The market is poised for sustained growth, with ongoing investment in infrastructure and product development expected to drive its valuation beyond 1.5 billion by 2033.
Climbing Wall Segmentation
-
1. Application
- 1.1. Gym
- 1.2. Amusement Park
- 1.3. Club
- 1.4. Other
-
2. Types
- 2.1. FRP Material
- 2.2. Wooden Material
- 2.3. Others
Climbing Wall Segmentation By Geography
-
1. North America
- 1.1. United States
- 1.2. Canada
- 1.3. Mexico
-
2. South America
- 2.1. Brazil
- 2.2. Argentina
- 2.3. Rest of South America
-
3. Europe
- 3.1. United Kingdom
- 3.2. Germany
- 3.3. France
- 3.4. Italy
- 3.5. Spain
- 3.6. Russia
- 3.7. Benelux
- 3.8. Nordics
- 3.9. Rest of Europe
-
4. Middle East & Africa
- 4.1. Turkey
- 4.2. Israel
- 4.3. GCC
- 4.4. North Africa
- 4.5. South Africa
- 4.6. Rest of Middle East & Africa
-
5. Asia Pacific
- 5.1. China
- 5.2. India
- 5.3. Japan
- 5.4. South Korea
- 5.5. ASEAN
- 5.6. Oceania
- 5.7. Rest of Asia Pacific
Climbing Wall Regional Market Share
Geographic Coverage of Climbing Wall
Climbing Wall REPORT HIGHLIGHTS
| Aspects | Details |
|---|---|
| Study Period | 2020-2034 |
| Base Year | 2025 |
| Estimated Year | 2026 |
| Forecast Period | 2026-2034 |
| Historical Period | 2020-2025 |
| Growth Rate | CAGR of 17.6% from 2020-2034 |
| Segmentation |
|
Table of Contents
- 1. Introduction
- 1.1. Research Scope
- 1.2. Market Segmentation
- 1.3. Research Methodology
- 1.4. Definitions and Assumptions
- 2. Executive Summary
- 2.1. Introduction
- 3. Market Dynamics
- 3.1. Introduction
- 3.2. Market Drivers
- 3.3. Market Restrains
- 3.4. Market Trends
- 4. Market Factor Analysis
- 4.1. Porters Five Forces
- 4.2. Supply/Value Chain
- 4.3. PESTEL analysis
- 4.4. Market Entropy
- 4.5. Patent/Trademark Analysis
- 5. Global Climbing Wall Analysis, Insights and Forecast, 2020-2032
- 5.1. Market Analysis, Insights and Forecast - by Application
- 5.1.1. Gym
- 5.1.2. Amusement Park
- 5.1.3. Club
- 5.1.4. Other
- 5.2. Market Analysis, Insights and Forecast - by Types
- 5.2.1. FRP Material
- 5.2.2. Wooden Material
- 5.2.3. Others
- 5.3. Market Analysis, Insights and Forecast - by Region
- 5.3.1. North America
- 5.3.2. South America
- 5.3.3. Europe
- 5.3.4. Middle East & Africa
- 5.3.5. Asia Pacific
- 5.1. Market Analysis, Insights and Forecast - by Application
- 6. North America Climbing Wall Analysis, Insights and Forecast, 2020-2032
- 6.1. Market Analysis, Insights and Forecast - by Application
- 6.1.1. Gym
- 6.1.2. Amusement Park
- 6.1.3. Club
- 6.1.4. Other
- 6.2. Market Analysis, Insights and Forecast - by Types
- 6.2.1. FRP Material
- 6.2.2. Wooden Material
- 6.2.3. Others
- 6.1. Market Analysis, Insights and Forecast - by Application
- 7. South America Climbing Wall Analysis, Insights and Forecast, 2020-2032
- 7.1. Market Analysis, Insights and Forecast - by Application
- 7.1.1. Gym
- 7.1.2. Amusement Park
- 7.1.3. Club
- 7.1.4. Other
- 7.2. Market Analysis, Insights and Forecast - by Types
- 7.2.1. FRP Material
- 7.2.2. Wooden Material
- 7.2.3. Others
- 7.1. Market Analysis, Insights and Forecast - by Application
- 8. Europe Climbing Wall Analysis, Insights and Forecast, 2020-2032
- 8.1. Market Analysis, Insights and Forecast - by Application
- 8.1.1. Gym
- 8.1.2. Amusement Park
- 8.1.3. Club
- 8.1.4. Other
- 8.2. Market Analysis, Insights and Forecast - by Types
- 8.2.1. FRP Material
- 8.2.2. Wooden Material
- 8.2.3. Others
- 8.1. Market Analysis, Insights and Forecast - by Application
- 9. Middle East & Africa Climbing Wall Analysis, Insights and Forecast, 2020-2032
- 9.1. Market Analysis, Insights and Forecast - by Application
- 9.1.1. Gym
- 9.1.2. Amusement Park
- 9.1.3. Club
- 9.1.4. Other
- 9.2. Market Analysis, Insights and Forecast - by Types
- 9.2.1. FRP Material
- 9.2.2. Wooden Material
- 9.2.3. Others
- 9.1. Market Analysis, Insights and Forecast - by Application
- 10. Asia Pacific Climbing Wall Analysis, Insights and Forecast, 2020-2032
- 10.1. Market Analysis, Insights and Forecast - by Application
- 10.1.1. Gym
- 10.1.2. Amusement Park
- 10.1.3. Club
- 10.1.4. Other
- 10.2. Market Analysis, Insights and Forecast - by Types
- 10.2.1. FRP Material
- 10.2.2. Wooden Material
- 10.2.3. Others
- 10.1. Market Analysis, Insights and Forecast - by Application
- 11. Competitive Analysis
- 11.1. Global Market Share Analysis 2025
- 11.2. Company Profiles
- 11.2.1 Entre-Prises
- 11.2.1.1. Overview
- 11.2.1.2. Products
- 11.2.1.3. SWOT Analysis
- 11.2.1.4. Recent Developments
- 11.2.1.5. Financials (Based on Availability)
- 11.2.2 Walltopia
- 11.2.2.1. Overview
- 11.2.2.2. Products
- 11.2.2.3. SWOT Analysis
- 11.2.2.4. Recent Developments
- 11.2.2.5. Financials (Based on Availability)
- 11.2.3 Surfaces For Climbing
- 11.2.3.1. Overview
- 11.2.3.2. Products
- 11.2.3.3. SWOT Analysis
- 11.2.3.4. Recent Developments
- 11.2.3.5. Financials (Based on Availability)
- 11.2.4 Highgate
- 11.2.4.1. Overview
- 11.2.4.2. Products
- 11.2.4.3. SWOT Analysis
- 11.2.4.4. Recent Developments
- 11.2.4.5. Financials (Based on Availability)
- 11.2.5 CWMA
- 11.2.5.1. Overview
- 11.2.5.2. Products
- 11.2.5.3. SWOT Analysis
- 11.2.5.4. Recent Developments
- 11.2.5.5. Financials (Based on Availability)
- 11.2.6 Big Boulder
- 11.2.6.1. Overview
- 11.2.6.2. Products
- 11.2.6.3. SWOT Analysis
- 11.2.6.4. Recent Developments
- 11.2.6.5. Financials (Based on Availability)
- 11.2.7 Dream Climbing Walls
- 11.2.7.1. Overview
- 11.2.7.2. Products
- 11.2.7.3. SWOT Analysis
- 11.2.7.4. Recent Developments
- 11.2.7.5. Financials (Based on Availability)
- 11.2.8 Rockwerx
- 11.2.8.1. Overview
- 11.2.8.2. Products
- 11.2.8.3. SWOT Analysis
- 11.2.8.4. Recent Developments
- 11.2.8.5. Financials (Based on Availability)
- 11.2.9 High Performance Climbing Walls
- 11.2.9.1. Overview
- 11.2.9.2. Products
- 11.2.9.3. SWOT Analysis
- 11.2.9.4. Recent Developments
- 11.2.9.5. Financials (Based on Availability)
- 11.2.10 Spectrum Sports Int'l
- 11.2.10.1. Overview
- 11.2.10.2. Products
- 11.2.10.3. SWOT Analysis
- 11.2.10.4. Recent Developments
- 11.2.10.5. Financials (Based on Availability)
- 11.2.1 Entre-Prises
List of Figures
- Figure 1: Global Climbing Wall Revenue Breakdown (billion, %) by Region 2025 & 2033
- Figure 2: North America Climbing Wall Revenue (billion), by Application 2025 & 2033
- Figure 3: North America Climbing Wall Revenue Share (%), by Application 2025 & 2033
- Figure 4: North America Climbing Wall Revenue (billion), by Types 2025 & 2033
- Figure 5: North America Climbing Wall Revenue Share (%), by Types 2025 & 2033
- Figure 6: North America Climbing Wall Revenue (billion), by Country 2025 & 2033
- Figure 7: North America Climbing Wall Revenue Share (%), by Country 2025 & 2033
- Figure 8: South America Climbing Wall Revenue (billion), by Application 2025 & 2033
- Figure 9: South America Climbing Wall Revenue Share (%), by Application 2025 & 2033
- Figure 10: South America Climbing Wall Revenue (billion), by Types 2025 & 2033
- Figure 11: South America Climbing Wall Revenue Share (%), by Types 2025 & 2033
- Figure 12: South America Climbing Wall Revenue (billion), by Country 2025 & 2033
- Figure 13: South America Climbing Wall Revenue Share (%), by Country 2025 & 2033
- Figure 14: Europe Climbing Wall Revenue (billion), by Application 2025 & 2033
- Figure 15: Europe Climbing Wall Revenue Share (%), by Application 2025 & 2033
- Figure 16: Europe Climbing Wall Revenue (billion), by Types 2025 & 2033
- Figure 17: Europe Climbing Wall Revenue Share (%), by Types 2025 & 2033
- Figure 18: Europe Climbing Wall Revenue (billion), by Country 2025 & 2033
- Figure 19: Europe Climbing Wall Revenue Share (%), by Country 2025 & 2033
- Figure 20: Middle East & Africa Climbing Wall Revenue (billion), by Application 2025 & 2033
- Figure 21: Middle East & Africa Climbing Wall Revenue Share (%), by Application 2025 & 2033
- Figure 22: Middle East & Africa Climbing Wall Revenue (billion), by Types 2025 & 2033
- Figure 23: Middle East & Africa Climbing Wall Revenue Share (%), by Types 2025 & 2033
- Figure 24: Middle East & Africa Climbing Wall Revenue (billion), by Country 2025 & 2033
- Figure 25: Middle East & Africa Climbing Wall Revenue Share (%), by Country 2025 & 2033
- Figure 26: Asia Pacific Climbing Wall Revenue (billion), by Application 2025 & 2033
- Figure 27: Asia Pacific Climbing Wall Revenue Share (%), by Application 2025 & 2033
- Figure 28: Asia Pacific Climbing Wall Revenue (billion), by Types 2025 & 2033
- Figure 29: Asia Pacific Climbing Wall Revenue Share (%), by Types 2025 & 2033
- Figure 30: Asia Pacific Climbing Wall Revenue (billion), by Country 2025 & 2033
- Figure 31: Asia Pacific Climbing Wall Revenue Share (%), by Country 2025 & 2033
List of Tables
- Table 1: Global Climbing Wall Revenue billion Forecast, by Application 2020 & 2033
- Table 2: Global Climbing Wall Revenue billion Forecast, by Types 2020 & 2033
- Table 3: Global Climbing Wall Revenue billion Forecast, by Region 2020 & 2033
- Table 4: Global Climbing Wall Revenue billion Forecast, by Application 2020 & 2033
- Table 5: Global Climbing Wall Revenue billion Forecast, by Types 2020 & 2033
- Table 6: Global Climbing Wall Revenue billion Forecast, by Country 2020 & 2033
- Table 7: United States Climbing Wall Revenue (billion) Forecast, by Application 2020 & 2033
- Table 8: Canada Climbing Wall Revenue (billion) Forecast, by Application 2020 & 2033
- Table 9: Mexico Climbing Wall Revenue (billion) Forecast, by Application 2020 & 2033
- Table 10: Global Climbing Wall Revenue billion Forecast, by Application 2020 & 2033
- Table 11: Global Climbing Wall Revenue billion Forecast, by Types 2020 & 2033
- Table 12: Global Climbing Wall Revenue billion Forecast, by Country 2020 & 2033
- Table 13: Brazil Climbing Wall Revenue (billion) Forecast, by Application 2020 & 2033
- Table 14: Argentina Climbing Wall Revenue (billion) Forecast, by Application 2020 & 2033
- Table 15: Rest of South America Climbing Wall Revenue (billion) Forecast, by Application 2020 & 2033
- Table 16: Global Climbing Wall Revenue billion Forecast, by Application 2020 & 2033
- Table 17: Global Climbing Wall Revenue billion Forecast, by Types 2020 & 2033
- Table 18: Global Climbing Wall Revenue billion Forecast, by Country 2020 & 2033
- Table 19: United Kingdom Climbing Wall Revenue (billion) Forecast, by Application 2020 & 2033
- Table 20: Germany Climbing Wall Revenue (billion) Forecast, by Application 2020 & 2033
- Table 21: France Climbing Wall Revenue (billion) Forecast, by Application 2020 & 2033
- Table 22: Italy Climbing Wall Revenue (billion) Forecast, by Application 2020 & 2033
- Table 23: Spain Climbing Wall Revenue (billion) Forecast, by Application 2020 & 2033
- Table 24: Russia Climbing Wall Revenue (billion) Forecast, by Application 2020 & 2033
- Table 25: Benelux Climbing Wall Revenue (billion) Forecast, by Application 2020 & 2033
- Table 26: Nordics Climbing Wall Revenue (billion) Forecast, by Application 2020 & 2033
- Table 27: Rest of Europe Climbing Wall Revenue (billion) Forecast, by Application 2020 & 2033
- Table 28: Global Climbing Wall Revenue billion Forecast, by Application 2020 & 2033
- Table 29: Global Climbing Wall Revenue billion Forecast, by Types 2020 & 2033
- Table 30: Global Climbing Wall Revenue billion Forecast, by Country 2020 & 2033
- Table 31: Turkey Climbing Wall Revenue (billion) Forecast, by Application 2020 & 2033
- Table 32: Israel Climbing Wall Revenue (billion) Forecast, by Application 2020 & 2033
- Table 33: GCC Climbing Wall Revenue (billion) Forecast, by Application 2020 & 2033
- Table 34: North Africa Climbing Wall Revenue (billion) Forecast, by Application 2020 & 2033
- Table 35: South Africa Climbing Wall Revenue (billion) Forecast, by Application 2020 & 2033
- Table 36: Rest of Middle East & Africa Climbing Wall Revenue (billion) Forecast, by Application 2020 & 2033
- Table 37: Global Climbing Wall Revenue billion Forecast, by Application 2020 & 2033
- Table 38: Global Climbing Wall Revenue billion Forecast, by Types 2020 & 2033
- Table 39: Global Climbing Wall Revenue billion Forecast, by Country 2020 & 2033
- Table 40: China Climbing Wall Revenue (billion) Forecast, by Application 2020 & 2033
- Table 41: India Climbing Wall Revenue (billion) Forecast, by Application 2020 & 2033
- Table 42: Japan Climbing Wall Revenue (billion) Forecast, by Application 2020 & 2033
- Table 43: South Korea Climbing Wall Revenue (billion) Forecast, by Application 2020 & 2033
- Table 44: ASEAN Climbing Wall Revenue (billion) Forecast, by Application 2020 & 2033
- Table 45: Oceania Climbing Wall Revenue (billion) Forecast, by Application 2020 & 2033
- Table 46: Rest of Asia Pacific Climbing Wall Revenue (billion) Forecast, by Application 2020 & 2033
Frequently Asked Questions
1. What is the projected Compound Annual Growth Rate (CAGR) of the Climbing Wall?
The projected CAGR is approximately 17.6%.
2. Which companies are prominent players in the Climbing Wall?
Key companies in the market include Entre-Prises, Walltopia, Surfaces For Climbing, Highgate, CWMA, Big Boulder, Dream Climbing Walls, Rockwerx, High Performance Climbing Walls, Spectrum Sports Int'l.
3. What are the main segments of the Climbing Wall?
The market segments include Application, Types.
4. Can you provide details about the market size?
The market size is estimated to be USD 1 billion as of 2022.
5. What are some drivers contributing to market growth?
N/A
6. What are the notable trends driving market growth?
N/A
7. Are there any restraints impacting market growth?
N/A
8. Can you provide examples of recent developments in the market?
N/A
9. What pricing options are available for accessing the report?
Pricing options include single-user, multi-user, and enterprise licenses priced at USD 4900.00, USD 7350.00, and USD 9800.00 respectively.
10. Is the market size provided in terms of value or volume?
The market size is provided in terms of value, measured in billion.
11. Are there any specific market keywords associated with the report?
Yes, the market keyword associated with the report is "Climbing Wall," which aids in identifying and referencing the specific market segment covered.
12. How do I determine which pricing option suits my needs best?
The pricing options vary based on user requirements and access needs. Individual users may opt for single-user licenses, while businesses requiring broader access may choose multi-user or enterprise licenses for cost-effective access to the report.
13. Are there any additional resources or data provided in the Climbing Wall report?
While the report offers comprehensive insights, it's advisable to review the specific contents or supplementary materials provided to ascertain if additional resources or data are available.
14. How can I stay updated on further developments or reports in the Climbing Wall?
To stay informed about further developments, trends, and reports in the Climbing Wall, consider subscribing to industry newsletters, following relevant companies and organizations, or regularly checking reputable industry news sources and publications.
Methodology
Step 1 - Identification of Relevant Samples Size from Population Database


Step 2 - Approaches for Defining Global Market Size (Value, Volume* & Price*)

Note*: In applicable scenarios
Step 3 - Data Sources
Primary Research
- Web Analytics
- Survey Reports
- Research Institute
- Latest Research Reports
- Opinion Leaders
Secondary Research
- Annual Reports
- White Paper
- Latest Press Release
- Industry Association
- Paid Database
- Investor Presentations

Step 4 - Data Triangulation
Involves using different sources of information in order to increase the validity of a study
These sources are likely to be stakeholders in a program - participants, other researchers, program staff, other community members, and so on.
Then we put all data in single framework & apply various statistical tools to find out the dynamic on the market.
During the analysis stage, feedback from the stakeholder groups would be compared to determine areas of agreement as well as areas of divergence