Key Insights
The Australian coal market, valued at approximately $57 billion in 2024, is projected for steady growth with a Compound Annual Growth Rate (CAGR) of 2.2% through 2033. Demand from Asia-Pacific nations, particularly China, India, Japan, and South Korea, remains a key driver, fueled by power generation and steelmaking requirements. Industrialization and ongoing reliance on coal for energy production in the region sustain this demand. However, the industry faces challenges from stringent environmental regulations, the transition to renewable energy, and fluctuating commodity prices. Australian coal producers must focus on operational efficiency, sustainable practices, and diversifying into higher-value products like coking coal. The market is segmented by thermal coal, coking coal, and semi-soft coking coal, serving distinct end-use sectors. Leading companies such as Peabody Energy Corporation, Yancoal Australia Ltd, and Whitehaven Coal Limited are actively shaping the industry's future.
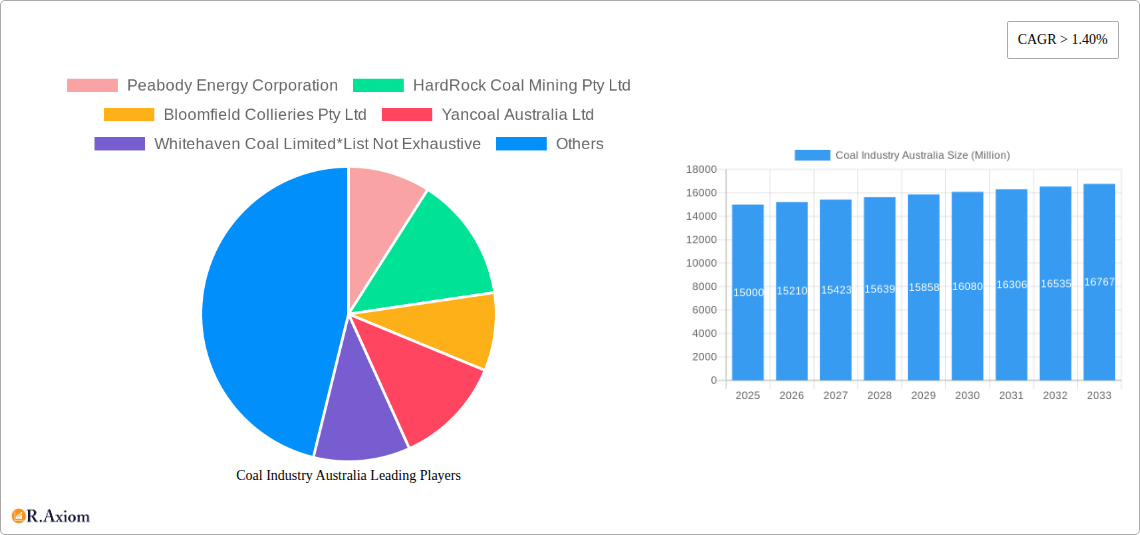
Coal Industry Australia Market Size (In Billion)
The competitive landscape includes multinational corporations and regional players, with the Asia-Pacific region holding significant market share due to its energy demands and established trade ties with Australia. While global decarbonization efforts create long-term uncertainty, short-term growth is anticipated, especially for high-quality coking coal, supporting global steel production. The industry's future success hinges on balancing economic viability with environmental sustainability, potentially through investments in carbon capture technologies and business diversification.

Coal Industry Australia Company Market Share
Coal Industry Australia: Market Analysis & Forecast 2019-2033
This comprehensive report provides an in-depth analysis of the Australian coal industry, covering market size, segmentation, key players, and future growth prospects. The study period spans from 2019 to 2033, with 2025 serving as both the base and estimated year. This report is essential for industry stakeholders, investors, and policymakers seeking a clear understanding of this dynamic sector.
Keywords: Coal Industry Australia, Thermal Coal, Coking Coal, Semi-Soft Coking Coal, Power Generation, Steelmaking, Market Size, Market Share, Market Growth, CAGR, Peabody Energy, Yancoal Australia, Whitehaven Coal, BHP Group, M&A, Industry Trends, Regulatory Framework, Australian Coal Market, Coal Mining Australia
Coal Industry Australia Market Concentration & Innovation
This section analyzes the competitive landscape of the Australian coal industry, encompassing market concentration, innovation drivers, regulatory changes, and industry dynamics. The report examines the market share of major players like Peabody Energy Corporation, Yancoal Australia Ltd, and Whitehaven Coal Limited, amongst others, providing a detailed assessment of the industry's structure. Furthermore, it delves into the impact of mergers and acquisitions (M&A) activities, quantifying deal values over the study period (2019-2024) and their influence on market consolidation. The total M&A deal value for the period is estimated at xx Million.
- Market Concentration: The report uses the Herfindahl-Hirschman Index (HHI) to measure market concentration and identifies any trends towards increased or decreased concentration.
- Innovation Drivers: Analysis of R&D investments, technological advancements in mining techniques and coal processing, and the role of government incentives in fostering innovation within the sector.
- Regulatory Framework: Detailed examination of Australian federal and state-level regulations impacting coal production, transportation, and environmental standards.
- Product Substitutes: Assessment of the impact of renewable energy sources (solar, wind) and other alternative fuels on coal demand, including their market penetration rates.
- End-User Trends: Exploration of shifts in coal consumption across different end-use sectors (power generation, steelmaking, industrial applications), based on consumption data.
- M&A Activities: A comprehensive list of significant M&A deals during the study period (2019-2024), including deal values (estimated at xx Million in total) and their implications for market share distribution.
Coal Industry Australia Industry Trends & Insights
This section provides a comprehensive overview of the key trends and insights shaping the Australian coal industry. It examines market growth drivers, technological disruptions, evolving consumer preferences (driven by energy transition policies), and competitive dynamics influencing market shares and pricing. The Compound Annual Growth Rate (CAGR) for the forecast period (2025-2033) is projected at xx%, with specific breakdowns for thermal, coking and semi-soft coking coal segments. The report also analyses market penetration of different coal types in various end-use sectors. This analysis considers factors like fluctuating global energy prices, government policies favouring renewable energy, and the ongoing impact of climate change regulations.
Dominant Markets & Segments in Coal Industry Australia
This section identifies the leading regions, countries, and market segments within the Australian coal industry. Dominance is analyzed based on production volume, revenue generation, and market share. The report thoroughly analyzes the key drivers of market dominance for each segment, including:
By Coal Type:
- Thermal Coal: Dominant due to its significant use in power generation, particularly in older power plants. Key drivers include existing infrastructure and relatively lower initial investment costs for thermal plants compared to renewables.
- Coking Coal: Key driver is the demand from the steel industry. The report analyzes the impact of global steel production fluctuations on coking coal demand.
- Semi-Soft Coking Coal: This section details the market share and key drivers specific to semi-soft coking coal, including its blendability and applications.
By End-Use:
- Power Generation: The largest segment, driven by Australia's existing coal-fired power plants. This section will examine the effect of planned plant closures (such as Loy Yang A) on future demand.
- Steelmaking: This segment's growth is linked to Australia's domestic steel production and exports. The report will include analysis of the steel industry's capacity utilization and future projections.
- Industrial Applications: Covers the smaller, yet significant, applications of coal in various industrial processes, outlining specific use-cases and growth projections.
Coal Industry Australia Product Developments
This section summarizes recent product innovations, focusing on advancements in coal mining technologies (e.g., automation, improved extraction techniques), coal processing techniques aimed at enhancing quality and reducing environmental impact, and any novel applications of coal-derived products. The report analyses the competitive advantages offered by these innovations, assessing their market fit and potential for influencing market share.
Report Scope & Segmentation Analysis
The report covers the Australian coal market segmented by coal type (Thermal Coal, Coking Coal, Semi-Soft Coking Coal) and end-use (Power Generation, Steelmaking, Industrial Applications). Each segment’s growth projections, market sizes (in Million tons and Million AUD), and competitive dynamics are analyzed for both the historical period (2019-2024) and the forecast period (2025-2033). The impact of policy changes and technological disruptions on these segments is also addressed.
- By Coal Type: Individual market size analysis (Million tons and revenue in Million AUD) for each coal type, including CAGR projections and competitive analysis.
- By End-Use: Detailed market size analysis (Million tons and revenue in Million AUD) for each end-use segment, incorporating growth projections and competitive landscapes.
Key Drivers of Coal Industry Australia Growth
The growth of the Australian coal industry is primarily driven by several key factors:
- Existing Infrastructure: The existing coal-fired power plants and steelmaking facilities in Australia contribute to a significant level of demand for coal, though subject to the ongoing energy transition.
- Global Demand: While fluctuating, global demand for coal, particularly coking coal, continues to play a role in supporting Australian exports.
- Technological Advancements: Improvements in mining and processing technologies contribute to increased efficiency and reduced production costs.
Challenges in the Coal Industry Australia Sector
Several significant challenges hinder the growth of the Australian coal industry:
- Environmental Regulations: Stricter environmental regulations and growing pressure for emissions reduction are impacting coal production and consumption.
- Renewable Energy Transition: The increasing adoption of renewable energy sources poses a significant threat to coal's long-term market share. The closure of coal-fired power plants such as Loy Yang A in 2035 will significantly reduce demand.
- Price Volatility: Global coal prices are highly volatile, impacting profitability and investment decisions. Estimated losses due to price volatility between 2019 and 2024 are xx Million.
Emerging Opportunities in Coal Industry Australia
Despite the challenges, certain opportunities exist for the Australian coal industry:
- High-Quality Coking Coal: Australia possesses significant reserves of high-quality coking coal, which continues to be in demand globally.
- Technological Innovation: Investments in clean coal technologies and carbon capture and storage could mitigate some of the environmental concerns and extend the industry's lifespan.
- Export Markets: Continued demand from certain Asian markets could support Australian coal exports, although this is subject to changing geopolitical dynamics and global energy transitions.
Leading Players in the Coal Industry Australia Market
- Peabody Energy Corporation
- HardRock Coal Mining Pty Ltd
- Bloomfield Collieries Pty Ltd
- Yancoal Australia Ltd
- Whitehaven Coal Limited
- Idemitsu Australia Resources Pty Ltd
- Jellinbah Group Pty Ltd
- BHP Group Ltd
- Centennial Coal Company Ltd
- Vale S A
Key Developments in Coal Industry Australia Industry
- September 2022: AGL Energy announced the closure of its Loy Yang A coal-fired power station in Victoria by 2035, signaling a shift away from coal-based power generation. This significantly impacts future coal demand.
- October 2022: New South Wales awarded contracts for the design and replacement of four of its five remaining coal power stations over the next 11 years. This reflects a planned transition to alternative energy sources, impacting future coal demand from power generation.
Strategic Outlook for Coal Industry Australia Market
The future of the Australian coal industry is intertwined with global energy transitions and national decarbonization policies. While challenges related to environmental regulations and the shift to renewable energy are significant, Australia's high-quality coking coal reserves and potential for technological innovation in clean coal technologies present opportunities for long-term sustainability. The industry's strategic outlook hinges on adapting to changing market conditions, investing in sustainable technologies, and securing export markets. The overall forecast for the industry is one of gradual decline in thermal coal and continued demand (though potentially reduced) for coking coal, leading to a nuanced outlook in the coming years.
Coal Industry Australia Segmentation
- 1. Electricity
- 2. Iron and Steel
- 3. Other Applications
Coal Industry Australia Segmentation By Geography
-
1. North America
- 1.1. United States
- 1.2. Canada
- 1.3. Mexico
-
2. South America
- 2.1. Brazil
- 2.2. Argentina
- 2.3. Rest of South America
-
3. Europe
- 3.1. United Kingdom
- 3.2. Germany
- 3.3. France
- 3.4. Italy
- 3.5. Spain
- 3.6. Russia
- 3.7. Benelux
- 3.8. Nordics
- 3.9. Rest of Europe
-
4. Middle East & Africa
- 4.1. Turkey
- 4.2. Israel
- 4.3. GCC
- 4.4. North Africa
- 4.5. South Africa
- 4.6. Rest of Middle East & Africa
-
5. Asia Pacific
- 5.1. China
- 5.2. India
- 5.3. Japan
- 5.4. South Korea
- 5.5. ASEAN
- 5.6. Oceania
- 5.7. Rest of Asia Pacific
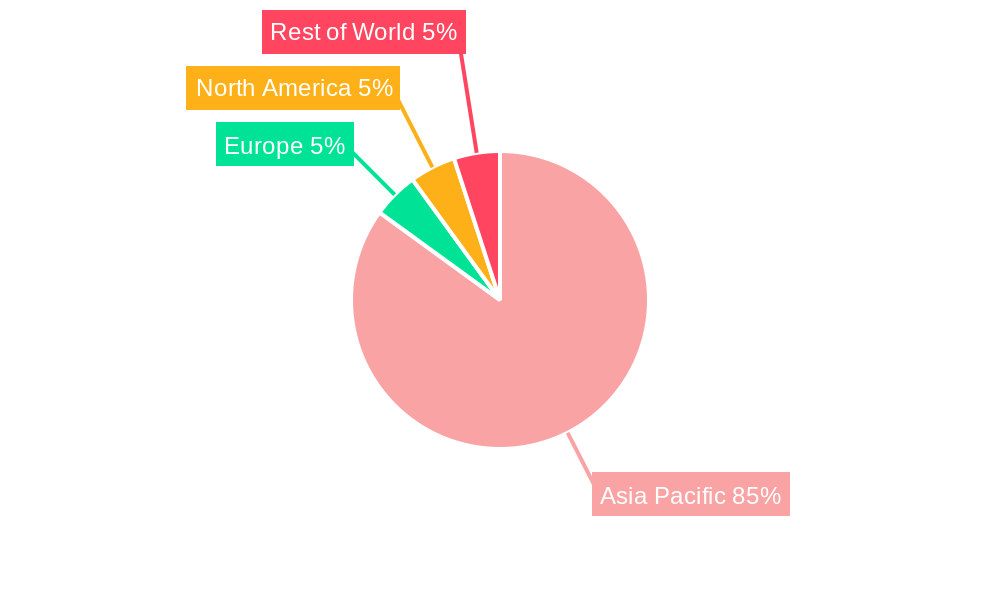
Coal Industry Australia Regional Market Share
Geographic Coverage of Coal Industry Australia
Coal Industry Australia REPORT HIGHLIGHTS
| Aspects | Details |
|---|---|
| Study Period | 2020-2034 |
| Base Year | 2025 |
| Estimated Year | 2026 |
| Forecast Period | 2026-2034 |
| Historical Period | 2020-2025 |
| Growth Rate | CAGR of 2.2% from 2020-2034 |
| Segmentation |
|
Table of Contents
- 1. Introduction
- 1.1. Research Scope
- 1.2. Market Segmentation
- 1.3. Research Objective
- 1.4. Definitions and Assumptions
- 2. Executive Summary
- 2.1. Market Snapshot
- 3. Market Dynamics
- 3.1. Market Drivers
- 3.2. Market Restrains
- 3.3. Market Trends
- 3.4. Market Opportunities
- 4. Market Factor Analysis
- 4.1. Porters Five Forces
- 4.1.1. Bargaining Power of Suppliers
- 4.1.2. Bargaining Power of Buyers
- 4.1.3. Threat of New Entrants
- 4.1.4. Threat of Substitutes
- 4.1.5. Competitive Rivalry
- 4.2. PESTEL analysis
- 4.3. BCG Analysis
- 4.3.1. Stars (High Growth, High Market Share)
- 4.3.2. Cash Cows (Low Growth, High Market Share)
- 4.3.3. Question Mark (High Growth, Low Market Share)
- 4.3.4. Dogs (Low Growth, Low Market Share)
- 4.4. Ansoff Matrix Analysis
- 4.5. Supply Chain Analysis
- 4.6. Regulatory Landscape
- 4.7. Current Market Potential and Opportunity Assessment (TAM–SAM–SOM Framework)
- 4.8. RAX Analyst Note
- 4.1. Porters Five Forces
- 5. Market Analysis, Insights and Forecast 2021-2033
- 5.1. Market Analysis, Insights and Forecast - by Electricity
- 5.2. Market Analysis, Insights and Forecast - by Iron and Steel
- 5.3. Market Analysis, Insights and Forecast - by Other Applications
- 5.4. Market Analysis, Insights and Forecast - by Region
- 5.4.1. North America
- 5.4.2. South America
- 5.4.3. Europe
- 5.4.4. Middle East & Africa
- 5.4.5. Asia Pacific
- 6. Global Coal Industry Australia Analysis, Insights and Forecast, 2021-2033
- 6.1. Market Analysis, Insights and Forecast - by Electricity
- 6.2. Market Analysis, Insights and Forecast - by Iron and Steel
- 6.3. Market Analysis, Insights and Forecast - by Other Applications
- 7. North America Coal Industry Australia Analysis, Insights and Forecast, 2020-2032
- 7.1. Market Analysis, Insights and Forecast - by Electricity
- 7.2. Market Analysis, Insights and Forecast - by Iron and Steel
- 7.3. Market Analysis, Insights and Forecast - by Other Applications
- 8. South America Coal Industry Australia Analysis, Insights and Forecast, 2020-2032
- 8.1. Market Analysis, Insights and Forecast - by Electricity
- 8.2. Market Analysis, Insights and Forecast - by Iron and Steel
- 8.3. Market Analysis, Insights and Forecast - by Other Applications
- 9. Europe Coal Industry Australia Analysis, Insights and Forecast, 2020-2032
- 9.1. Market Analysis, Insights and Forecast - by Electricity
- 9.2. Market Analysis, Insights and Forecast - by Iron and Steel
- 9.3. Market Analysis, Insights and Forecast - by Other Applications
- 10. Middle East & Africa Coal Industry Australia Analysis, Insights and Forecast, 2020-2032
- 10.1. Market Analysis, Insights and Forecast - by Electricity
- 10.2. Market Analysis, Insights and Forecast - by Iron and Steel
- 10.3. Market Analysis, Insights and Forecast - by Other Applications
- 11. Asia Pacific Coal Industry Australia Analysis, Insights and Forecast, 2020-2032
- 11.1. Market Analysis, Insights and Forecast - by Electricity
- 11.2. Market Analysis, Insights and Forecast - by Iron and Steel
- 11.3. Market Analysis, Insights and Forecast - by Other Applications
- 12. Competitive Analysis
- 12.1. Company Profiles
- 12.1.1 Peabody Energy Corporation
- 12.1.1.1. Company Overview
- 12.1.1.2. Products
- 12.1.1.3. Company Financials
- 12.1.1.4. SWOT Analysis
- 12.1.2 HardRock Coal Mining Pty Ltd
- 12.1.2.1. Company Overview
- 12.1.2.2. Products
- 12.1.2.3. Company Financials
- 12.1.2.4. SWOT Analysis
- 12.1.3 Bloomfield Collieries Pty Ltd
- 12.1.3.1. Company Overview
- 12.1.3.2. Products
- 12.1.3.3. Company Financials
- 12.1.3.4. SWOT Analysis
- 12.1.4 Yancoal Australia Ltd
- 12.1.4.1. Company Overview
- 12.1.4.2. Products
- 12.1.4.3. Company Financials
- 12.1.4.4. SWOT Analysis
- 12.1.5 Whitehaven Coal Limited*List Not Exhaustive
- 12.1.5.1. Company Overview
- 12.1.5.2. Products
- 12.1.5.3. Company Financials
- 12.1.5.4. SWOT Analysis
- 12.1.6 Idemitsu Australia Resources Pty Ltd
- 12.1.6.1. Company Overview
- 12.1.6.2. Products
- 12.1.6.3. Company Financials
- 12.1.6.4. SWOT Analysis
- 12.1.7 Jellinbah Group Pty Ltd
- 12.1.7.1. Company Overview
- 12.1.7.2. Products
- 12.1.7.3. Company Financials
- 12.1.7.4. SWOT Analysis
- 12.1.8 BHP Group Ltd
- 12.1.8.1. Company Overview
- 12.1.8.2. Products
- 12.1.8.3. Company Financials
- 12.1.8.4. SWOT Analysis
- 12.1.9 Centennial Coal Company Ltd
- 12.1.9.1. Company Overview
- 12.1.9.2. Products
- 12.1.9.3. Company Financials
- 12.1.9.4. SWOT Analysis
- 12.1.10 Vale S A
- 12.1.10.1. Company Overview
- 12.1.10.2. Products
- 12.1.10.3. Company Financials
- 12.1.10.4. SWOT Analysis
- 12.1.1 Peabody Energy Corporation
- 12.2. Market Entropy
- 12.2.1 Company's Key Areas Served
- 12.2.2 Recent Developments
- 12.3. Company Market Share Analysis 2025
- 12.3.1 Top 5 Companies Market Share Analysis
- 12.3.2 Top 3 Companies Market Share Analysis
- 12.4. List of Potential Customers
- 13. Research Methodology
List of Figures
- Figure 1: Global Coal Industry Australia Revenue Breakdown (billion, %) by Region 2025 & 2033
- Figure 2: Global Coal Industry Australia Volume Breakdown (Kiloton, %) by Region 2025 & 2033
- Figure 3: North America Coal Industry Australia Revenue (billion), by Electricity 2025 & 2033
- Figure 4: North America Coal Industry Australia Volume (Kiloton), by Electricity 2025 & 2033
- Figure 5: North America Coal Industry Australia Revenue Share (%), by Electricity 2025 & 2033
- Figure 6: North America Coal Industry Australia Volume Share (%), by Electricity 2025 & 2033
- Figure 7: North America Coal Industry Australia Revenue (billion), by Iron and Steel 2025 & 2033
- Figure 8: North America Coal Industry Australia Volume (Kiloton), by Iron and Steel 2025 & 2033
- Figure 9: North America Coal Industry Australia Revenue Share (%), by Iron and Steel 2025 & 2033
- Figure 10: North America Coal Industry Australia Volume Share (%), by Iron and Steel 2025 & 2033
- Figure 11: North America Coal Industry Australia Revenue (billion), by Other Applications 2025 & 2033
- Figure 12: North America Coal Industry Australia Volume (Kiloton), by Other Applications 2025 & 2033
- Figure 13: North America Coal Industry Australia Revenue Share (%), by Other Applications 2025 & 2033
- Figure 14: North America Coal Industry Australia Volume Share (%), by Other Applications 2025 & 2033
- Figure 15: North America Coal Industry Australia Revenue (billion), by Country 2025 & 2033
- Figure 16: North America Coal Industry Australia Volume (Kiloton), by Country 2025 & 2033
- Figure 17: North America Coal Industry Australia Revenue Share (%), by Country 2025 & 2033
- Figure 18: North America Coal Industry Australia Volume Share (%), by Country 2025 & 2033
- Figure 19: South America Coal Industry Australia Revenue (billion), by Electricity 2025 & 2033
- Figure 20: South America Coal Industry Australia Volume (Kiloton), by Electricity 2025 & 2033
- Figure 21: South America Coal Industry Australia Revenue Share (%), by Electricity 2025 & 2033
- Figure 22: South America Coal Industry Australia Volume Share (%), by Electricity 2025 & 2033
- Figure 23: South America Coal Industry Australia Revenue (billion), by Iron and Steel 2025 & 2033
- Figure 24: South America Coal Industry Australia Volume (Kiloton), by Iron and Steel 2025 & 2033
- Figure 25: South America Coal Industry Australia Revenue Share (%), by Iron and Steel 2025 & 2033
- Figure 26: South America Coal Industry Australia Volume Share (%), by Iron and Steel 2025 & 2033
- Figure 27: South America Coal Industry Australia Revenue (billion), by Other Applications 2025 & 2033
- Figure 28: South America Coal Industry Australia Volume (Kiloton), by Other Applications 2025 & 2033
- Figure 29: South America Coal Industry Australia Revenue Share (%), by Other Applications 2025 & 2033
- Figure 30: South America Coal Industry Australia Volume Share (%), by Other Applications 2025 & 2033
- Figure 31: South America Coal Industry Australia Revenue (billion), by Country 2025 & 2033
- Figure 32: South America Coal Industry Australia Volume (Kiloton), by Country 2025 & 2033
- Figure 33: South America Coal Industry Australia Revenue Share (%), by Country 2025 & 2033
- Figure 34: South America Coal Industry Australia Volume Share (%), by Country 2025 & 2033
- Figure 35: Europe Coal Industry Australia Revenue (billion), by Electricity 2025 & 2033
- Figure 36: Europe Coal Industry Australia Volume (Kiloton), by Electricity 2025 & 2033
- Figure 37: Europe Coal Industry Australia Revenue Share (%), by Electricity 2025 & 2033
- Figure 38: Europe Coal Industry Australia Volume Share (%), by Electricity 2025 & 2033
- Figure 39: Europe Coal Industry Australia Revenue (billion), by Iron and Steel 2025 & 2033
- Figure 40: Europe Coal Industry Australia Volume (Kiloton), by Iron and Steel 2025 & 2033
- Figure 41: Europe Coal Industry Australia Revenue Share (%), by Iron and Steel 2025 & 2033
- Figure 42: Europe Coal Industry Australia Volume Share (%), by Iron and Steel 2025 & 2033
- Figure 43: Europe Coal Industry Australia Revenue (billion), by Other Applications 2025 & 2033
- Figure 44: Europe Coal Industry Australia Volume (Kiloton), by Other Applications 2025 & 2033
- Figure 45: Europe Coal Industry Australia Revenue Share (%), by Other Applications 2025 & 2033
- Figure 46: Europe Coal Industry Australia Volume Share (%), by Other Applications 2025 & 2033
- Figure 47: Europe Coal Industry Australia Revenue (billion), by Country 2025 & 2033
- Figure 48: Europe Coal Industry Australia Volume (Kiloton), by Country 2025 & 2033
- Figure 49: Europe Coal Industry Australia Revenue Share (%), by Country 2025 & 2033
- Figure 50: Europe Coal Industry Australia Volume Share (%), by Country 2025 & 2033
- Figure 51: Middle East & Africa Coal Industry Australia Revenue (billion), by Electricity 2025 & 2033
- Figure 52: Middle East & Africa Coal Industry Australia Volume (Kiloton), by Electricity 2025 & 2033
- Figure 53: Middle East & Africa Coal Industry Australia Revenue Share (%), by Electricity 2025 & 2033
- Figure 54: Middle East & Africa Coal Industry Australia Volume Share (%), by Electricity 2025 & 2033
- Figure 55: Middle East & Africa Coal Industry Australia Revenue (billion), by Iron and Steel 2025 & 2033
- Figure 56: Middle East & Africa Coal Industry Australia Volume (Kiloton), by Iron and Steel 2025 & 2033
- Figure 57: Middle East & Africa Coal Industry Australia Revenue Share (%), by Iron and Steel 2025 & 2033
- Figure 58: Middle East & Africa Coal Industry Australia Volume Share (%), by Iron and Steel 2025 & 2033
- Figure 59: Middle East & Africa Coal Industry Australia Revenue (billion), by Other Applications 2025 & 2033
- Figure 60: Middle East & Africa Coal Industry Australia Volume (Kiloton), by Other Applications 2025 & 2033
- Figure 61: Middle East & Africa Coal Industry Australia Revenue Share (%), by Other Applications 2025 & 2033
- Figure 62: Middle East & Africa Coal Industry Australia Volume Share (%), by Other Applications 2025 & 2033
- Figure 63: Middle East & Africa Coal Industry Australia Revenue (billion), by Country 2025 & 2033
- Figure 64: Middle East & Africa Coal Industry Australia Volume (Kiloton), by Country 2025 & 2033
- Figure 65: Middle East & Africa Coal Industry Australia Revenue Share (%), by Country 2025 & 2033
- Figure 66: Middle East & Africa Coal Industry Australia Volume Share (%), by Country 2025 & 2033
- Figure 67: Asia Pacific Coal Industry Australia Revenue (billion), by Electricity 2025 & 2033
- Figure 68: Asia Pacific Coal Industry Australia Volume (Kiloton), by Electricity 2025 & 2033
- Figure 69: Asia Pacific Coal Industry Australia Revenue Share (%), by Electricity 2025 & 2033
- Figure 70: Asia Pacific Coal Industry Australia Volume Share (%), by Electricity 2025 & 2033
- Figure 71: Asia Pacific Coal Industry Australia Revenue (billion), by Iron and Steel 2025 & 2033
- Figure 72: Asia Pacific Coal Industry Australia Volume (Kiloton), by Iron and Steel 2025 & 2033
- Figure 73: Asia Pacific Coal Industry Australia Revenue Share (%), by Iron and Steel 2025 & 2033
- Figure 74: Asia Pacific Coal Industry Australia Volume Share (%), by Iron and Steel 2025 & 2033
- Figure 75: Asia Pacific Coal Industry Australia Revenue (billion), by Other Applications 2025 & 2033
- Figure 76: Asia Pacific Coal Industry Australia Volume (Kiloton), by Other Applications 2025 & 2033
- Figure 77: Asia Pacific Coal Industry Australia Revenue Share (%), by Other Applications 2025 & 2033
- Figure 78: Asia Pacific Coal Industry Australia Volume Share (%), by Other Applications 2025 & 2033
- Figure 79: Asia Pacific Coal Industry Australia Revenue (billion), by Country 2025 & 2033
- Figure 80: Asia Pacific Coal Industry Australia Volume (Kiloton), by Country 2025 & 2033
- Figure 81: Asia Pacific Coal Industry Australia Revenue Share (%), by Country 2025 & 2033
- Figure 82: Asia Pacific Coal Industry Australia Volume Share (%), by Country 2025 & 2033
List of Tables
- Table 1: Global Coal Industry Australia Revenue billion Forecast, by Electricity 2020 & 2033
- Table 2: Global Coal Industry Australia Volume Kiloton Forecast, by Electricity 2020 & 2033
- Table 3: Global Coal Industry Australia Revenue billion Forecast, by Iron and Steel 2020 & 2033
- Table 4: Global Coal Industry Australia Volume Kiloton Forecast, by Iron and Steel 2020 & 2033
- Table 5: Global Coal Industry Australia Revenue billion Forecast, by Other Applications 2020 & 2033
- Table 6: Global Coal Industry Australia Volume Kiloton Forecast, by Other Applications 2020 & 2033
- Table 7: Global Coal Industry Australia Revenue billion Forecast, by Region 2020 & 2033
- Table 8: Global Coal Industry Australia Volume Kiloton Forecast, by Region 2020 & 2033
- Table 9: Global Coal Industry Australia Revenue billion Forecast, by Electricity 2020 & 2033
- Table 10: Global Coal Industry Australia Volume Kiloton Forecast, by Electricity 2020 & 2033
- Table 11: Global Coal Industry Australia Revenue billion Forecast, by Iron and Steel 2020 & 2033
- Table 12: Global Coal Industry Australia Volume Kiloton Forecast, by Iron and Steel 2020 & 2033
- Table 13: Global Coal Industry Australia Revenue billion Forecast, by Other Applications 2020 & 2033
- Table 14: Global Coal Industry Australia Volume Kiloton Forecast, by Other Applications 2020 & 2033
- Table 15: Global Coal Industry Australia Revenue billion Forecast, by Country 2020 & 2033
- Table 16: Global Coal Industry Australia Volume Kiloton Forecast, by Country 2020 & 2033
- Table 17: United States Coal Industry Australia Revenue (billion) Forecast, by Application 2020 & 2033
- Table 18: United States Coal Industry Australia Volume (Kiloton) Forecast, by Application 2020 & 2033
- Table 19: Canada Coal Industry Australia Revenue (billion) Forecast, by Application 2020 & 2033
- Table 20: Canada Coal Industry Australia Volume (Kiloton) Forecast, by Application 2020 & 2033
- Table 21: Mexico Coal Industry Australia Revenue (billion) Forecast, by Application 2020 & 2033
- Table 22: Mexico Coal Industry Australia Volume (Kiloton) Forecast, by Application 2020 & 2033
- Table 23: Global Coal Industry Australia Revenue billion Forecast, by Electricity 2020 & 2033
- Table 24: Global Coal Industry Australia Volume Kiloton Forecast, by Electricity 2020 & 2033
- Table 25: Global Coal Industry Australia Revenue billion Forecast, by Iron and Steel 2020 & 2033
- Table 26: Global Coal Industry Australia Volume Kiloton Forecast, by Iron and Steel 2020 & 2033
- Table 27: Global Coal Industry Australia Revenue billion Forecast, by Other Applications 2020 & 2033
- Table 28: Global Coal Industry Australia Volume Kiloton Forecast, by Other Applications 2020 & 2033
- Table 29: Global Coal Industry Australia Revenue billion Forecast, by Country 2020 & 2033
- Table 30: Global Coal Industry Australia Volume Kiloton Forecast, by Country 2020 & 2033
- Table 31: Brazil Coal Industry Australia Revenue (billion) Forecast, by Application 2020 & 2033
- Table 32: Brazil Coal Industry Australia Volume (Kiloton) Forecast, by Application 2020 & 2033
- Table 33: Argentina Coal Industry Australia Revenue (billion) Forecast, by Application 2020 & 2033
- Table 34: Argentina Coal Industry Australia Volume (Kiloton) Forecast, by Application 2020 & 2033
- Table 35: Rest of South America Coal Industry Australia Revenue (billion) Forecast, by Application 2020 & 2033
- Table 36: Rest of South America Coal Industry Australia Volume (Kiloton) Forecast, by Application 2020 & 2033
- Table 37: Global Coal Industry Australia Revenue billion Forecast, by Electricity 2020 & 2033
- Table 38: Global Coal Industry Australia Volume Kiloton Forecast, by Electricity 2020 & 2033
- Table 39: Global Coal Industry Australia Revenue billion Forecast, by Iron and Steel 2020 & 2033
- Table 40: Global Coal Industry Australia Volume Kiloton Forecast, by Iron and Steel 2020 & 2033
- Table 41: Global Coal Industry Australia Revenue billion Forecast, by Other Applications 2020 & 2033
- Table 42: Global Coal Industry Australia Volume Kiloton Forecast, by Other Applications 2020 & 2033
- Table 43: Global Coal Industry Australia Revenue billion Forecast, by Country 2020 & 2033
- Table 44: Global Coal Industry Australia Volume Kiloton Forecast, by Country 2020 & 2033
- Table 45: United Kingdom Coal Industry Australia Revenue (billion) Forecast, by Application 2020 & 2033
- Table 46: United Kingdom Coal Industry Australia Volume (Kiloton) Forecast, by Application 2020 & 2033
- Table 47: Germany Coal Industry Australia Revenue (billion) Forecast, by Application 2020 & 2033
- Table 48: Germany Coal Industry Australia Volume (Kiloton) Forecast, by Application 2020 & 2033
- Table 49: France Coal Industry Australia Revenue (billion) Forecast, by Application 2020 & 2033
- Table 50: France Coal Industry Australia Volume (Kiloton) Forecast, by Application 2020 & 2033
- Table 51: Italy Coal Industry Australia Revenue (billion) Forecast, by Application 2020 & 2033
- Table 52: Italy Coal Industry Australia Volume (Kiloton) Forecast, by Application 2020 & 2033
- Table 53: Spain Coal Industry Australia Revenue (billion) Forecast, by Application 2020 & 2033
- Table 54: Spain Coal Industry Australia Volume (Kiloton) Forecast, by Application 2020 & 2033
- Table 55: Russia Coal Industry Australia Revenue (billion) Forecast, by Application 2020 & 2033
- Table 56: Russia Coal Industry Australia Volume (Kiloton) Forecast, by Application 2020 & 2033
- Table 57: Benelux Coal Industry Australia Revenue (billion) Forecast, by Application 2020 & 2033
- Table 58: Benelux Coal Industry Australia Volume (Kiloton) Forecast, by Application 2020 & 2033
- Table 59: Nordics Coal Industry Australia Revenue (billion) Forecast, by Application 2020 & 2033
- Table 60: Nordics Coal Industry Australia Volume (Kiloton) Forecast, by Application 2020 & 2033
- Table 61: Rest of Europe Coal Industry Australia Revenue (billion) Forecast, by Application 2020 & 2033
- Table 62: Rest of Europe Coal Industry Australia Volume (Kiloton) Forecast, by Application 2020 & 2033
- Table 63: Global Coal Industry Australia Revenue billion Forecast, by Electricity 2020 & 2033
- Table 64: Global Coal Industry Australia Volume Kiloton Forecast, by Electricity 2020 & 2033
- Table 65: Global Coal Industry Australia Revenue billion Forecast, by Iron and Steel 2020 & 2033
- Table 66: Global Coal Industry Australia Volume Kiloton Forecast, by Iron and Steel 2020 & 2033
- Table 67: Global Coal Industry Australia Revenue billion Forecast, by Other Applications 2020 & 2033
- Table 68: Global Coal Industry Australia Volume Kiloton Forecast, by Other Applications 2020 & 2033
- Table 69: Global Coal Industry Australia Revenue billion Forecast, by Country 2020 & 2033
- Table 70: Global Coal Industry Australia Volume Kiloton Forecast, by Country 2020 & 2033
- Table 71: Turkey Coal Industry Australia Revenue (billion) Forecast, by Application 2020 & 2033
- Table 72: Turkey Coal Industry Australia Volume (Kiloton) Forecast, by Application 2020 & 2033
- Table 73: Israel Coal Industry Australia Revenue (billion) Forecast, by Application 2020 & 2033
- Table 74: Israel Coal Industry Australia Volume (Kiloton) Forecast, by Application 2020 & 2033
- Table 75: GCC Coal Industry Australia Revenue (billion) Forecast, by Application 2020 & 2033
- Table 76: GCC Coal Industry Australia Volume (Kiloton) Forecast, by Application 2020 & 2033
- Table 77: North Africa Coal Industry Australia Revenue (billion) Forecast, by Application 2020 & 2033
- Table 78: North Africa Coal Industry Australia Volume (Kiloton) Forecast, by Application 2020 & 2033
- Table 79: South Africa Coal Industry Australia Revenue (billion) Forecast, by Application 2020 & 2033
- Table 80: South Africa Coal Industry Australia Volume (Kiloton) Forecast, by Application 2020 & 2033
- Table 81: Rest of Middle East & Africa Coal Industry Australia Revenue (billion) Forecast, by Application 2020 & 2033
- Table 82: Rest of Middle East & Africa Coal Industry Australia Volume (Kiloton) Forecast, by Application 2020 & 2033
- Table 83: Global Coal Industry Australia Revenue billion Forecast, by Electricity 2020 & 2033
- Table 84: Global Coal Industry Australia Volume Kiloton Forecast, by Electricity 2020 & 2033
- Table 85: Global Coal Industry Australia Revenue billion Forecast, by Iron and Steel 2020 & 2033
- Table 86: Global Coal Industry Australia Volume Kiloton Forecast, by Iron and Steel 2020 & 2033
- Table 87: Global Coal Industry Australia Revenue billion Forecast, by Other Applications 2020 & 2033
- Table 88: Global Coal Industry Australia Volume Kiloton Forecast, by Other Applications 2020 & 2033
- Table 89: Global Coal Industry Australia Revenue billion Forecast, by Country 2020 & 2033
- Table 90: Global Coal Industry Australia Volume Kiloton Forecast, by Country 2020 & 2033
- Table 91: China Coal Industry Australia Revenue (billion) Forecast, by Application 2020 & 2033
- Table 92: China Coal Industry Australia Volume (Kiloton) Forecast, by Application 2020 & 2033
- Table 93: India Coal Industry Australia Revenue (billion) Forecast, by Application 2020 & 2033
- Table 94: India Coal Industry Australia Volume (Kiloton) Forecast, by Application 2020 & 2033
- Table 95: Japan Coal Industry Australia Revenue (billion) Forecast, by Application 2020 & 2033
- Table 96: Japan Coal Industry Australia Volume (Kiloton) Forecast, by Application 2020 & 2033
- Table 97: South Korea Coal Industry Australia Revenue (billion) Forecast, by Application 2020 & 2033
- Table 98: South Korea Coal Industry Australia Volume (Kiloton) Forecast, by Application 2020 & 2033
- Table 99: ASEAN Coal Industry Australia Revenue (billion) Forecast, by Application 2020 & 2033
- Table 100: ASEAN Coal Industry Australia Volume (Kiloton) Forecast, by Application 2020 & 2033
- Table 101: Oceania Coal Industry Australia Revenue (billion) Forecast, by Application 2020 & 2033
- Table 102: Oceania Coal Industry Australia Volume (Kiloton) Forecast, by Application 2020 & 2033
- Table 103: Rest of Asia Pacific Coal Industry Australia Revenue (billion) Forecast, by Application 2020 & 2033
- Table 104: Rest of Asia Pacific Coal Industry Australia Volume (Kiloton) Forecast, by Application 2020 & 2033
Frequently Asked Questions
1. What is the projected Compound Annual Growth Rate (CAGR) of the Coal Industry Australia?
The projected CAGR is approximately 2.2%.
2. Which companies are prominent players in the Coal Industry Australia?
Key companies in the market include Peabody Energy Corporation, HardRock Coal Mining Pty Ltd, Bloomfield Collieries Pty Ltd, Yancoal Australia Ltd, Whitehaven Coal Limited*List Not Exhaustive, Idemitsu Australia Resources Pty Ltd, Jellinbah Group Pty Ltd, BHP Group Ltd, Centennial Coal Company Ltd, Vale S A.
3. What are the main segments of the Coal Industry Australia?
The market segments include Electricity, Iron and Steel, Other Applications.
4. Can you provide details about the market size?
The market size is estimated to be USD 57 billion as of 2022.
5. What are some drivers contributing to market growth?
4.; Increase in Prices of Electricity Procured from Conventional Mechanisms 4.; Decline in Cost of Solar Energy Infrastructure.
6. What are the notable trends driving market growth?
Demand for Bituminous Coal to Drive the Market.
7. Are there any restraints impacting market growth?
4.; Competition from Other Alternative Energy Sources.
8. Can you provide examples of recent developments in the market?
September 2022: AGL Energy announced the company's coal-fired Loy Yang A power station in Victoria will close in 2035.
9. What pricing options are available for accessing the report?
Pricing options include single-user, multi-user, and enterprise licenses priced at USD 3800, USD 4500, and USD 5800 respectively.
10. Is the market size provided in terms of value or volume?
The market size is provided in terms of value, measured in billion and volume, measured in Kiloton.
11. Are there any specific market keywords associated with the report?
Yes, the market keyword associated with the report is "Coal Industry Australia," which aids in identifying and referencing the specific market segment covered.
12. How do I determine which pricing option suits my needs best?
The pricing options vary based on user requirements and access needs. Individual users may opt for single-user licenses, while businesses requiring broader access may choose multi-user or enterprise licenses for cost-effective access to the report.
13. Are there any additional resources or data provided in the Coal Industry Australia report?
While the report offers comprehensive insights, it's advisable to review the specific contents or supplementary materials provided to ascertain if additional resources or data are available.
14. How can I stay updated on further developments or reports in the Coal Industry Australia?
To stay informed about further developments, trends, and reports in the Coal Industry Australia, consider subscribing to industry newsletters, following relevant companies and organizations, or regularly checking reputable industry news sources and publications.
Methodology
Step 1 - Identification of Relevant Samples Size from Population Database


Step 2 - Approaches for Defining Global Market Size (Value, Volume* & Price*)

Note*: In applicable scenarios
Step 3 - Data Sources
Primary Research
- Web Analytics
- Survey Reports
- Research Institute
- Latest Research Reports
- Opinion Leaders
Secondary Research
- Annual Reports
- White Paper
- Latest Press Release
- Industry Association
- Paid Database
- Investor Presentations

Step 4 - Data Triangulation
Involves using different sources of information in order to increase the validity of a study
These sources are likely to be stakeholders in a program - participants, other researchers, program staff, other community members, and so on.
Then we put all data in single framework & apply various statistical tools to find out the dynamic on the market.
During the analysis stage, feedback from the stakeholder groups would be compared to determine areas of agreement as well as areas of divergence

